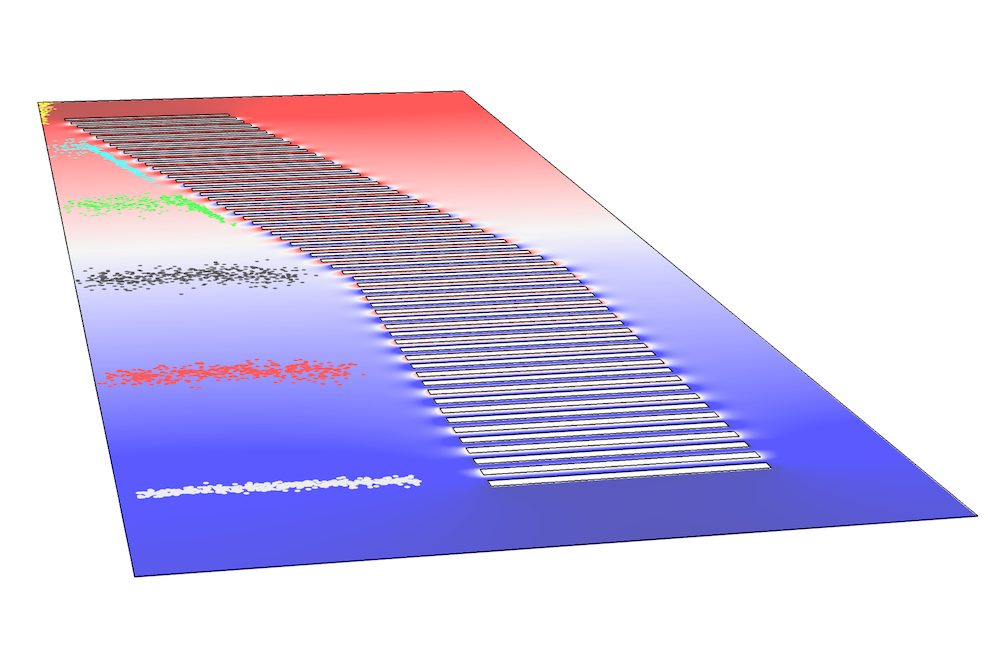
Within mass spectrometers, plasmas are often used to ionize a sample and an inert background gas. Before the ions produced in the plasma are sent into the mass filter, which determines the sample’s chemical composition, they must be focused into a beam with a suitably small radius. One way to focus ions is with an ion funnel. Focusing ions is a critical stage of the overall design, so it’s important to have a fundamental understanding of the funnel’s operating principles.
Improving Mass and Ion Mobility Spectrometry with Ion Funnels
Ion funnels consist of a stack of ring electrodes that have decreasing inner diameters. Due to a combination of RF and DC potentials as well as the presence of a background gas, these devices can focus ion beams by confining ions radially and moving them toward the narrow end of the funnel. In doing so, the funnel can transport ions between the ion source and mass filter with minimal ion losses.

Simulation of an ion funnel.
Ion funnels can be used to inject ions into quadrupole mass filters and ion mobility spectrometers, enabling them to separate and analyze mixtures of ionized gases. These devices have a wide variety of applications, such as:
- Detecting explosives
- Studying complicated biological molecules
- Analyzing residual gas
- Identifying cancer during surgery
- Studying dinosaur skin
Of course, before ion funnels can be put to use, we need to gain insight into their design and functionality.
Studying an Ion Funnel with the AC/DC and Particle Tracing Modules
In this example, we analyze the focusing effect of an ion funnel that combines RF and DC potentials. The model contains a set of insulated ring-shaped electrodes that are exposed to an RF potential and have adjacent electrodes out of phase. In addition, there is a neutral argon buffer gas within the funnel. To model the interaction of the ions and neutral background gas, we use the Collisions node with an Elastic subnode and the Monte Carlo collision setting.
The RF potential radially confines the ions, and a DC bias directs them toward the increasingly narrow electrodes. The superposition of these two fields enables the funnel to focus the ions, sending them through the funnel and counteracting the thermal dispersion and Coulombic repulsion effects.
To create this model, we use three different interfaces in the COMSOL Multiphysics® software:
- The Electrostatics interface to compute the DC fields
- The Electric Currents interface to compute the AC fields
- The Charged Particle Tracing interface to model ion movement through the funnel. This interface accounts for the interaction of the AC and DC fields and neutral particles in the gas, although the interactions between the ions themselves are not taken into account as their density is suitably low.
Examining the Simulation Results
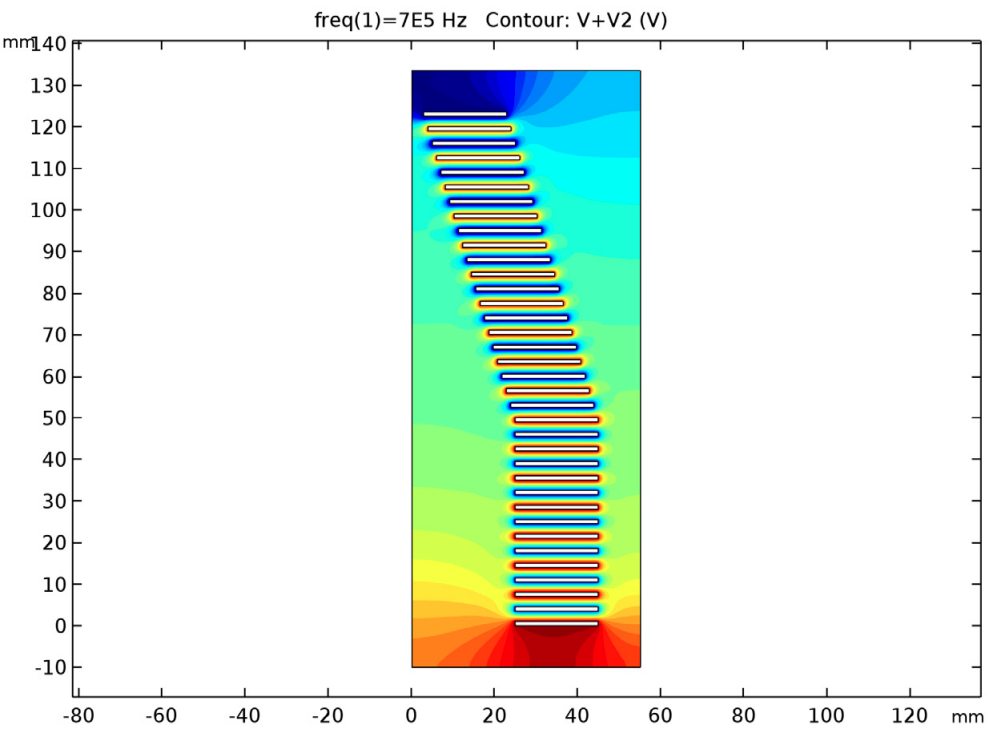
The simulation results for the ion funnel show that the positive ions are successfully moved from the wider end of the funnel to the narrow end via the gradual DC bias. To keep the ions inside the funnel, the AC voltage is kept out of phase between the adjacent electrodes. As seen below, this results in a very large electric potential gradient near the electrodes.

The combined electric potential of the electrodynamic ion funnel when time = 0.
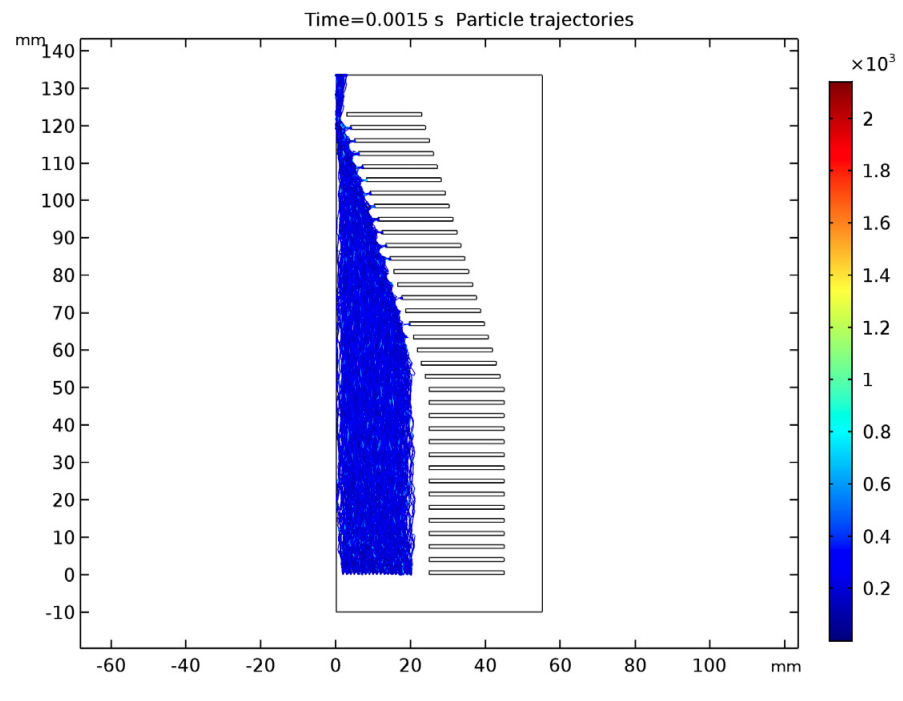
Using this model, we also investigate the ion trajectories in the funnel. These trajectories show that the ions are confined to the increasingly small area. Due to this confinement, the ions can be efficiently transported to another device, such as a mass filter.

Positive ion trajectories in the electrodynamic ion funnel.
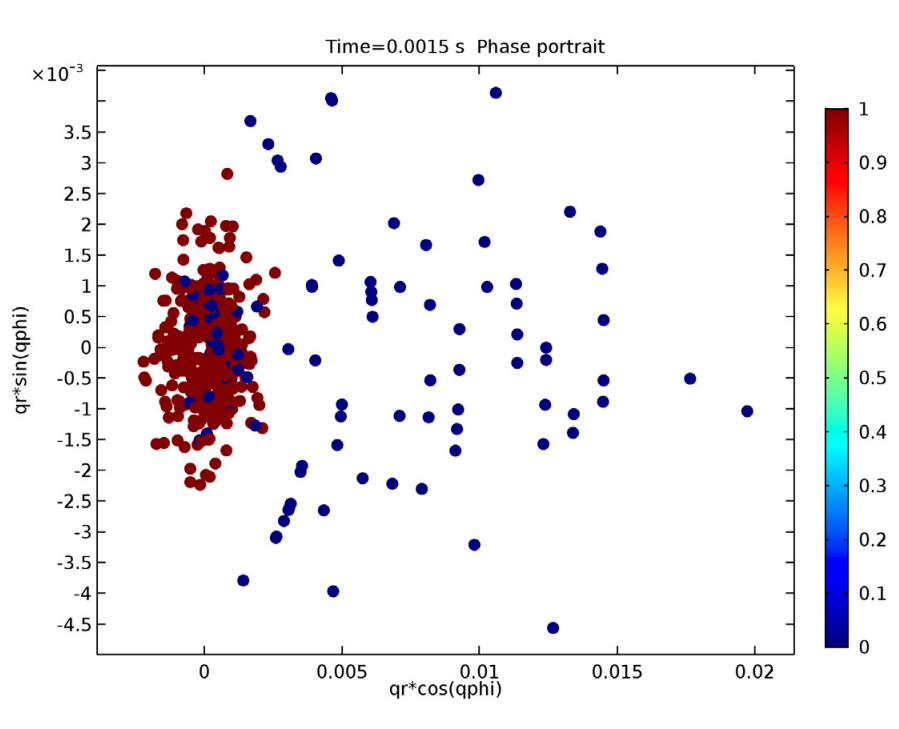
Moving on, let’s take a closer look at the ions located at the narrow end of the funnel. While the ions are released along the positive x-axis, they become uniformly distributed around the z-axis when they reach the end of the funnel.

The x– and y-coordinates of the ions at the narrow end of the funnel. In this plot, blue indicates particles still in the funnel and red indicates particles that have exited the funnel. Note that these results may differ from the former two plots because the Collisions node uses random numbers to decide if a collision takes place at every time step.
Want to try this ion funnel example? Access the model documentation and associated MPH files via the button below.


Comments (0)