
Tubular reactors are commonly used in the chemical industry, where they help with continuous large-scale production. To accurately analyze these devices, we can simulate the tubular reactor’s dissociation process. In this blog post, we compare isothermal and nonisothermal simulation studies. Such studies showcase multiple helpful features from the Chemical Reaction Engineering Module that you can use in your own simulations.
Tubular Reactors: A Common Device in the Chemical Industry
If you were to look inside a tubular reactor, you would see reactants flowing and continuously reacting at high velocities. As these reactants move through the pipe, they are turned into products. Since the production process is continuous, these devices are often an efficient way to produce large quantities of products in the chemical and petroleum industries.
Additionally, tubular reactors are utilized in other areas, such as off-gas treatment in the combustion processes of power plants and engines. This type of reactor can even be used as a purification method for drugs, potentially leading to more affordable pharmaceuticals.
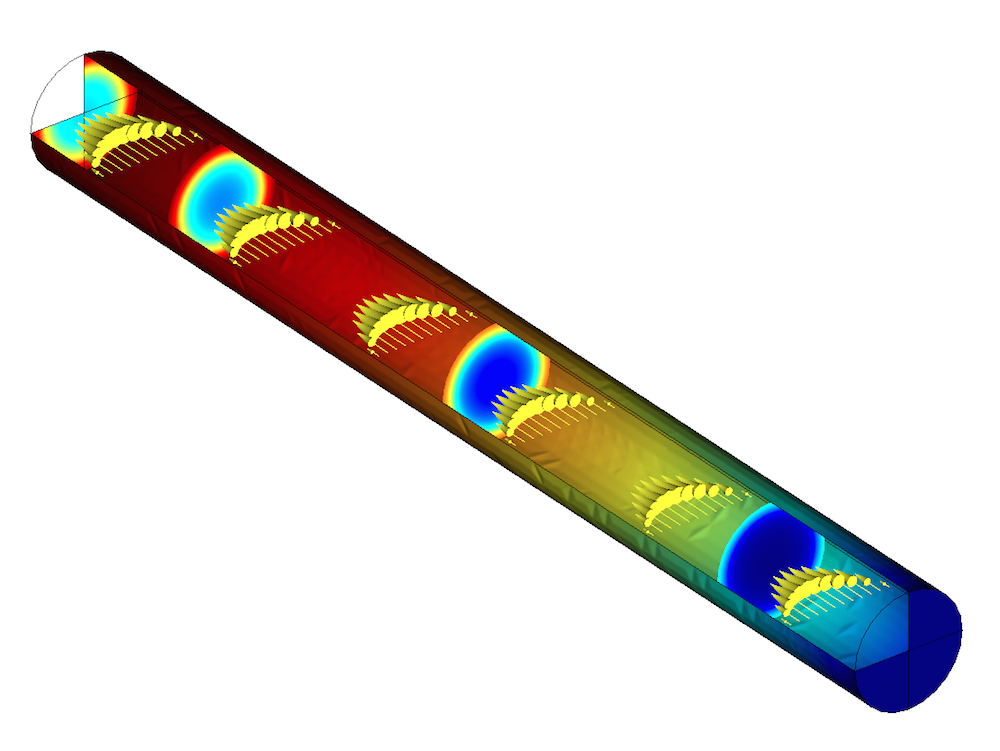
A model of a tubular reactor.
To design tubular reactors that efficiently generate the highest amount of product possible, we can turn to multiphysics simulation. In this example, we will use the COMSOL Multiphysics simulation software to build an accurate reactor model to examine the gas-phase dissociation process. In the next section, we’ll share an example created with the Chemical Reaction Engineering Module. Many of the key techniques that we use to solve this model can be applied to other chemical reaction engineering simulations.
Simulating the Dissociation Process
Our analysis of a tubular reactor starts with a rotationally symmetric model. The model uses a mapped or structured mesh because of the reactor’s regular shape. To set up boundary conditions in our model, we use the Laminar Flow and Transport of Concentrated Species interfaces.
The model enables us to focus on the gas-phase dissociation process. This is when species A reacts and forms the product, B. Here, every mole of A reacts and generates two moles of B, which causes a volumetric expansion of the gas mixture. Due to this change in density, the gas velocity increases as the mixture moves through the reactor, a scenario that we can model with the compressible formulation of the Navier-Stokes equations.
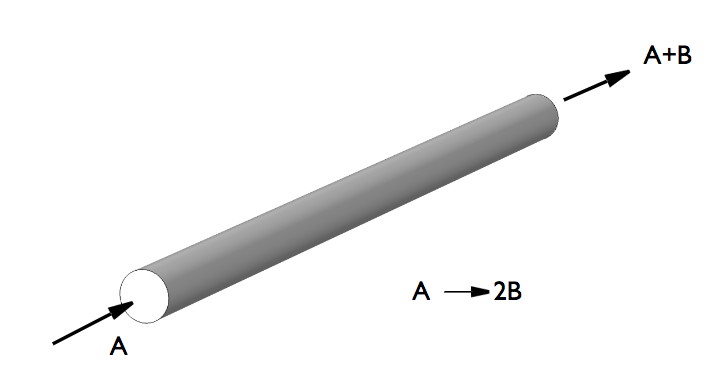
A simplified image showing the dissociation process in a tubular reactor.
During the dissociation reaction, the composition of the mixture shifts. Although it starts off as pure A at the inlet, at the outlet, there is a mixture of A and B, making it a multicomponent system. When dealing with a concentrated multicomponent mixture like this, you need to take all of the possible interactions into account. In this case, we describe the interactions between all of these components with the Transport of Concentrated Species interface and the Maxwell-Stefan or mixture-averaged diffusion equations.
Further, according to the ideal gas law, density variation depends on pressure, temperature, and composition. The “ideal gas” option for density in the Transport of Concentrated Species interface will automatically account for all of these factors. The Laminar Flow interface describes the momentum balances and continuity of fluids with changes in density.
In our model, the production rate of the product, B, is dependent on composition and temperature. However, if you assume that the gas is isothermal, the rate will only vary with composition. We’ll see how this affects our results by comparing an isothermal study with a nonisothermal study, where both composition and temperature are considered.
Comparing Isothermal and Nonisothermal Studies
The isothermal study of a tubular reactor solves a coupled model of the compressible Navier-Stokes equations and the Maxwell-Stefan convection and conduction equations. The model is expanded upon in the nonisothermal case, which adds a Heat Transfer in Fluids interface and an energy balance equation to model the temperature.
While the temperature remains constant at 473 K for the isothermal case, it changes in the nonisothermal case. In the latter, gas enters the reactor at a temperature of 293 K (room temperature) and warms up during the reaction because the reactor’s walls are heated to 473 K. In the nonisothermal study, the heat of reaction is included. As such, a main difference between these two models lies with how they handle temperature.
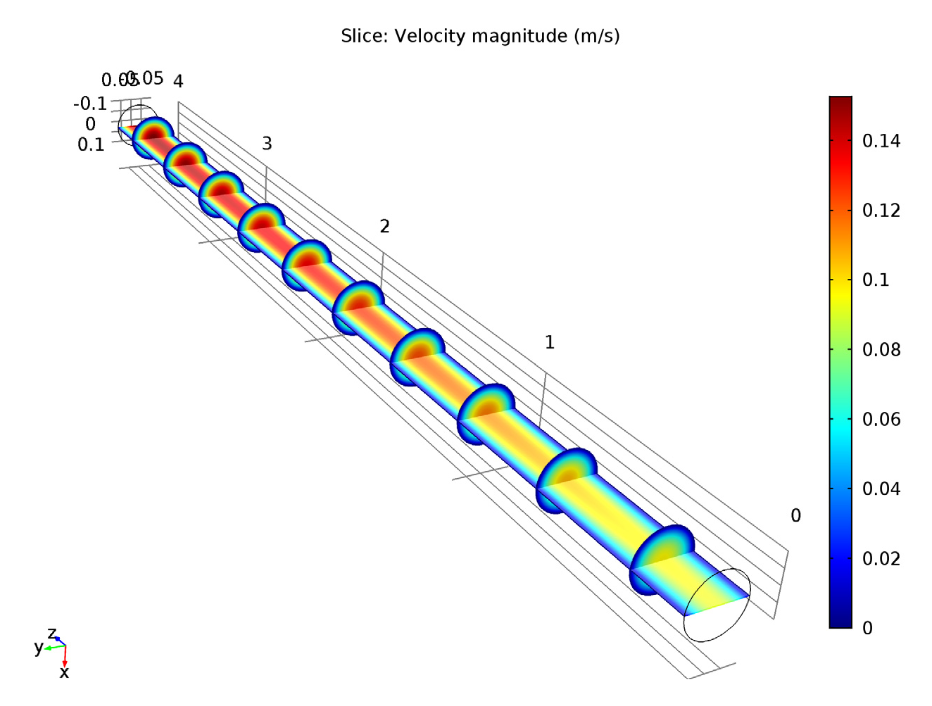
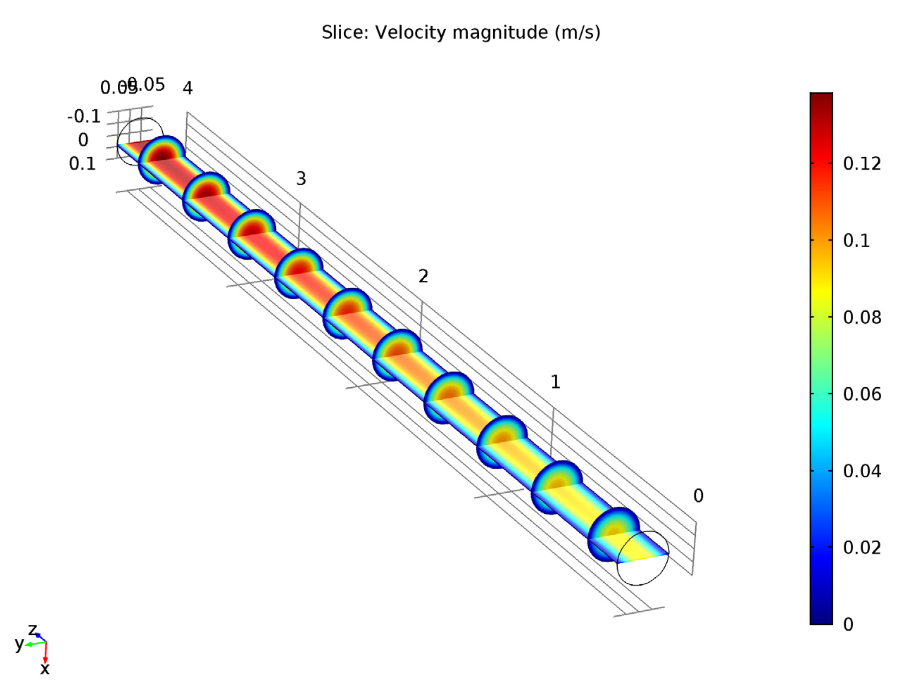
This difference in temperature affects other aspects of the studies. For instance, let’s take a closer look at the velocity magnitude. When comparing these studies, we can see that the velocity increases along the z-axis due to the expanding volume of the gas mixture during the reaction. In the nonisothermal case, however, the velocity magnitude is slightly smaller. This is because the nonisothermal case has a lower temperature and thus a lower reaction rate.
Comparing velocity magnitude for the isothermal case (left) and nonisothermal case (right). You can see that the maximum velocity is a little greater in the isothermal case.
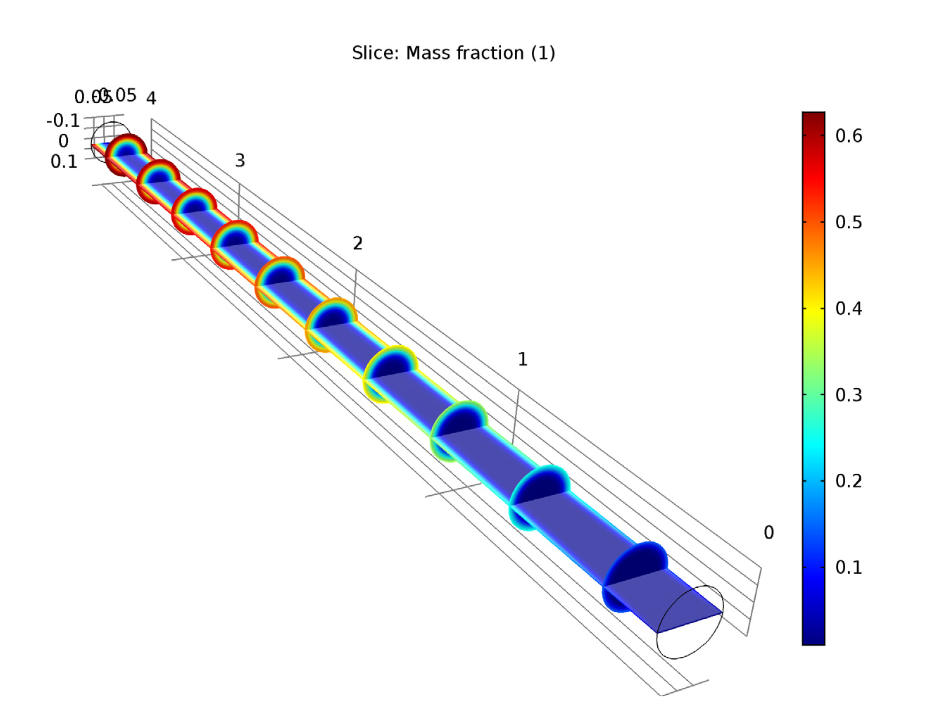
We also compared the mass fraction of species B for the two studies. For the isothermal model, we found out that there is a higher mass fraction of species B near the tube surface than in the central area. This is due to the lower convective flow velocity near the side surface. For the nonisothermal model, the mass fraction is also higher at the area close to the side surface, but overall, the mass fraction is lower than the isothermal case, as we can see when comparing the two figures below. This difference is clear when observing the average mass fraction of species B at the outlet, which is 64.1% for the isothermal case and 26.4% for the nonisothermal case.
Comparing the mass fraction of species B for the isothermal case (left) and nonisothermal case (right).
There is an average conversion rate of 64.4% at the outlet for the isothermal study and 24.2% for the nonisothermal study. This further shows the effect that temperature has on performance in tubular reactors. From these studies, we can see that the temperature profile has a significant impact on the reactor’s reaction and conversion rates.
This model can be used to analyze the reaction rates of tubular reactors that are still in the design stage, as well as existing reactors. You can also apply many of the modeling techniques mentioned in this blog post, from accounting for multicomponent diffusion to discretizing a long and thin geometry with a mapped mesh, in your own simulations.
Learn More About Chemical Reaction Engineering and Tubular Reactors
- Try it yourself: Download the Dissociation in a Tubular Reactor tutorial model
- Read this blog post to find out how a tubular reactor simulation app can be used to teach mathematical modeling
- Check out these tubular reactor tutorials:





Comments (0)