
On April 18, 1906, a massive earthquake struck Northern California, killing an estimated 3000 people, leaving more than 200,000 people homeless, and sparking fires that leveled most buildings in San Francisco and other cities across the region. The earthquake spurred novel inquiry and analyses, which led to a new conception of seismic activity: the elastic rebound theory of Harry Fielding Reid. This theory was a crucial step forward in our modern ability to predict and prepare for earthquakes.
In this light, we see how even a tragic experience can be valuable — if we can learn from it. Since 1906, the feedback loop of experience, inquiry, and theory has helped put modern seismology on a sound scientific foundation. On this foundational understanding, we can build credible models for simulating seismic activity. And by enabling us to better prepare for future seismic events, past experience led to something positive for the present and future.
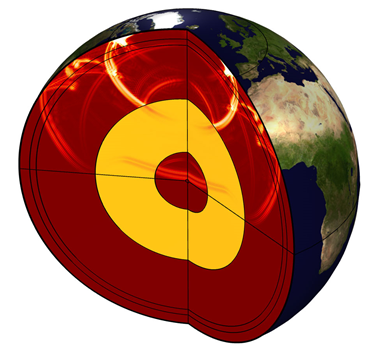
A computational model showing the propagation of seismic waves through Earth.
Let’s explore some of the layers of historical experience, inquiry, and theory that support our understanding of Earth’s seismic activity.
Experience: The California Earthquake of 1906
The 1906 earthquake was certainly not the first seismic event to strike a busy urban area, but it was effectively the first to be photographed and otherwise witnessed by the entire world. Panoramic images show the effects of the tremor and subsequent fires on San Francisco, then a city of 400,000; the largest in the Western United States.


Panoramic images show the devastation of San Francisco during and after the earthquake and subsequent fires. Top image by Pillsbury Picture Co. and in the public domain via Wikimedia Commons. Bottom image by Lester C. Guernsey and in the public domain via Wikimedia Commons.
Beyond its horrific human cost, “the earthquake confounded contemporary geologists with its large, horizontal displacements and great rupture length,” notes the US Geological Survey. The recently invented seismograph provided a valuable record of how the earthquake’s energy dispersed across Earth. Its impact was recorded as far away as the University of Gottingen in Germany, as shown here:
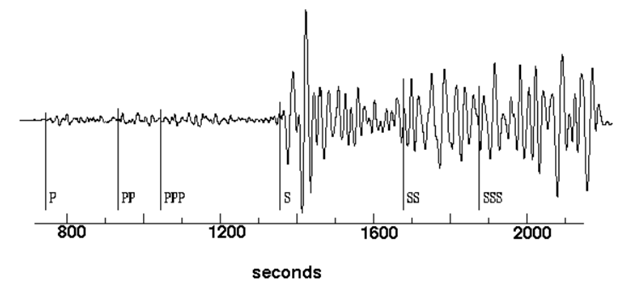
Seismogram of 1906 California earthquake, as recorded at the University of Gottingen, 9100 km away. Image in public domain via US Geological Survey.
Inquiry: The Lawson Report of 1908
After a natural disaster, people naturally ask: Why did this happen, and how? For most of history, answers to questions like these would have been purely speculative. But by the early 20th century, the empirical study of earthquakes and other natural phenomena had made important progress. Beginning in the mid-1700s, after an earthquake in Portugal, observation of seismic activity became more objective and systematic. By 1906, well-established universities and observatories contributed more than 20 earth scientists to California’s inquiry into the event, known as the State Earthquake Investigation Commission. Its findings would be published in a 1908 report named for the team’s leader, geologist A.C. Lawson.
Two of the Lawson Report’s observations would prove especially significant:
- Buildings on soft ground sustained more damage than those built on bedrock
- The ground had clearly shifted in opposite directions along a visible seam, and not just at the epicenter of the earthquake near San Francisco
In fact, the seam was nearly 300 miles long, and the ground had moved dramatically on either side of what we now know as the San Andreas Fault.
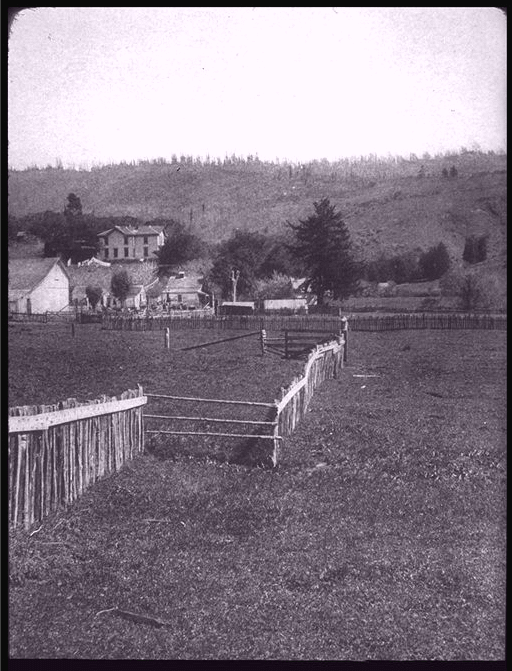
A fence that crossed the San Andreas Fault was displaced more than 8 feet by the 1906 earthquake, creating the gap shown in the center of the photo. Public domain image via US Geological Survey.
The first finding hinted at how seismic energy propagates differently through different materials; the second would lead to the elastic rebound theory of Johns Hopkins University professor and Commission member Harry Fielding Reid.
Theory: Elastic Rebound, Plate Tectonics, and the Behavior of Seismic Waves
Harry Fielding Reid’s elastic rebound theory, which was first proposed in the 1908 Lawson Report and then formalized in a 1910 paper, gave us a new conception of what causes earthquakes. This conception is now so familiar that it may be hard to imagine how groundbreaking it once was (pun intended).
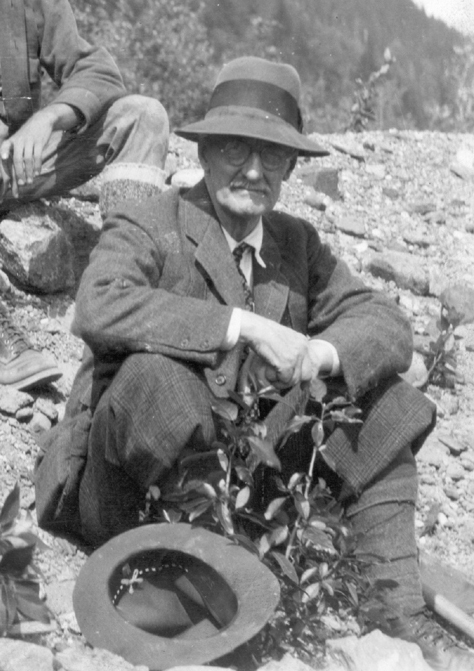
Harry Fielding Reid. Image by Charles Will Wright and in the public domain via Wikimedia Commons.
As noted above, the commission had compiled detailed observations of how the ground cracked on April 18. Were these cracks a cause of the earthquake, or an effect? It had long been assumed that fault lines were a result of seismic activity: The earthquake’s waves of energy had split solid ground. But what if the ground was not as solid as we had thought?
Reid’s theory, supported by photos and surveys of shifted ground, was that the exposed fault line was revealing the cause of the earthquake, not just its effect.
According to the US Geological Survey:
[The elastic rebound theory] describes how the earth’s crust gradually and elastically distorts with accumulating plate motion until it is suddenly returned to its undistorted state by rapid slip along a fault, releasing the years of accumulated strain and, in the process, generating seismic waves that produce shaking.
This explanation of the theory is from our time, not that of the Lawson Report. The clue that gives away its modernity is the phrase “accumulating plate motion.” For while Reid could articulate how earthquakes resulted from violent movement along fault lines, no one had yet conceived of faults as divisions between “plates” of rock that moved across the surface of Earth.
The modern theory of surface plate tectonics would not emerge until after decades of further inquiry. What lay beneath Earth’s crust was also mostly unknown, but soon another great theorist would help answer that question.
With the elastic rebound theory, Reid countered a common misunderstanding through careful extrapolation from empirical research. In 1936, Danish geophysicist and seismologist Inge Lehmann made a comparable leap forward by “finding” the solid core of Earth through her study of seismic wave behavior.

Inge Lehmann in 1932. Image by The Royal Library, National Library of Denmark and University of Copenhagen University Library and licensed under CC BY-SA 4.0 via Wikimedia Commons.
Seismic waves can be categorized as:
- P-waves
- Also called primary or pressure waves
- First to be detected after an earthquake
- Can travel through gases, liquids, and solids
- S-waves
- Also called secondary or shear waves
- Travel more slowly, so they are detected after P-waves
- Oscillate perpendicular to their direction of travel, hence, “shear”
Most significantly for Inge Lehmann’s work, S-waves do not propagate through liquids with very low viscosity.
In the late 1920s, there was broad agreement that Earth’s solid crust and mantle surrounded an entirely liquid core. However, there were inconsistencies in the behavior of P-waves and S-waves that suggested otherwise. Lehmann’s investigation culminated in a 1936 paper titled “P.” In her paper, she proposed that discontinuities in the structure of Earth could explain the observed pattern of seismic wave activity.
How could wave activity on the surface tell Lehmann what’s at the center of Earth? Her careful study of seismographic records showed the presence of a P-wave shadow zone, which suggested the presence of Earth’s solid core.
Building on Seismology’s Foundation with Simulation
The hard-won lessons of scientific history help support further exploration. For instance, the Acoustics Module in the COMSOL Multiphysics® software incorporates our understanding of wave behavior. The Propagation of Seismic Waves Through Earth tutorial model visualizes the generation and propagation of the different pressure and shear waves across the inner structure of Earth. The model also captures all other type of elastic waves, such as surface and interfacial waves.
Watch this video, which is based on the geometry of the new model, to see how the p-wave shadow zone helps us “find” the solid core of Earth.
The model featured here uses a 2D axisymmetric formulation of the Elastic Waves, Time Explicit interface, as well as the Pressure Acoustics, Time Explicit formulation to analyze how seismic waves propagate through Earth.
The model can easily couple fluids and solids and implement depth-dependent material properties. It’s also a large model, solving for 17.2 million degrees of freedom!
Next Step
Download the Propagation of Seismic Waves Through Earth tutorial model to try it yourself via the button below (includes step-by-step instructions in the PDF documentation):
NASA Goddard Space Flight Center Image by Reto Stöckli (land surface, shallow water, clouds). Enhancements by Robert Simmon (ocean color, compositing, 3D globes, animation). Data and technical support: MODIS Land Group; MODIS Science Data Support Team; MODIS Atmosphere Group; MODIS Ocean Group Additional data: USGS EROS Data Center (topography); USGS Terrestrial Remote Sensing Flagstaff Field Center (Antarctica); Defense Meteorological Satellite Program (city lights).




Comments (1)
Wen Luo
October 24, 2023Hi Alan,
Do you by chance know how to set a excitation source in the form of moment tensor in COMSOL?
thanks,
Wen