
Today, we welcome guest blogger William Vetterling of ZINK Imaging to the COMSOL Blog.
If you read the 2015 edition of COMSOL News, you may have seen my review of the newly released Application Builder. In that review, I shared an example of a simple thermal model of an IR microscope that we had created a year earlier for use in our laboratory at ZINK Imaging. Now I will share how we turned that model into an app.
About the IR Microscope Model
We turned the IR microscope model into an app by using the Application Wizard. Then, we outfitted it with some fancier features by calling into play some of the more powerful machinery available in the Application Builder environment. Since some people have expressed an interest in how these features were added, we decided to put some of the details into a blog post. To begin, let’s sketch out the model itself.
The problem was to use an IR microscope that we found on the eBay® website to map out the temperatures provided by a thin-film thermal print head (such as what you might find in a FAX machine). The print head was composed of a resistive heater with a linear array of electrodes to activate local regions. The electrodes were spaced at about 300 per inch, and when they were activated, the microscope would produce an IR image whose intensity pattern would indicate the temperature.
There was no calibration supplied with the microscope and it was not an inherently linear device with regard to temperature. A change in current in the print head would change not only the intensity of the IR it produces, but also the spectrum. However, the physics behind these changes are known and can be modeled with COMSOL Multiphysics®. Moreover, a model could convolve the temperature results with the responsivity of the microscope’s InSb detector and produce a predicted image that could be compared with the measured image.
The geometry of a short segment of the print head looked like this:
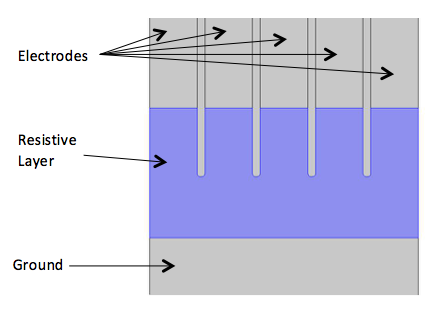
In the lab, we could connect a voltage source to selected electrodes for local heating of the resistive layer and record the resulting IR image. In one example measurement, the result was as follows:
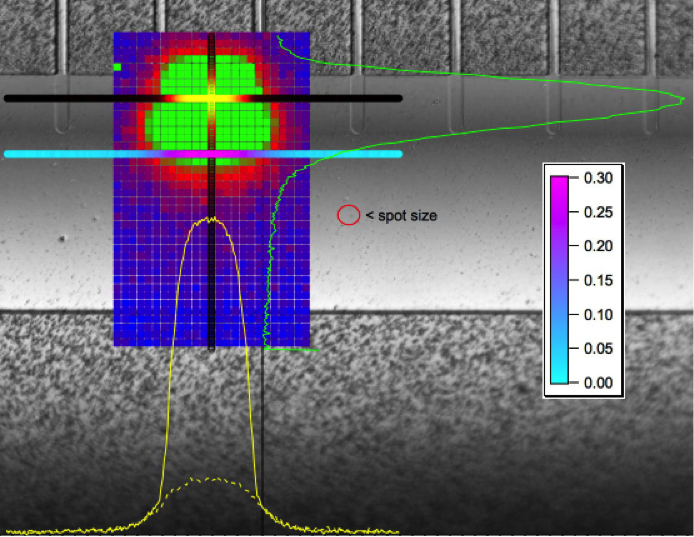
In the above image, the green blob on a blue background is the raw IR signal. It is superimposed on a photograph of the print head, so that you can see where the heat is produced in relation to the activated electrode. Cross-sectional plots of the signal were taken along three lines (one vertical and two horizontal) and these three lines are shown cutting through the green blob. The corresponding relative signal strengths are shown as the green and yellow curves.
Turning the Model into a Simulation App with the Application Wizard
When beginning our trial of the Application Builder, we already had a working model of this device and were ready to make an app. We opened the model and started the Application Wizard. The Wizard presented us with three lists of choices:
- Inputs and outputs to the model.
- Modeling-related operations.
- Graphics produced by the model.
From these three lists, we chose the things we wanted to make available to the user of the app. The Wizard then created input or display boxes for the input/output data, pushbuttons for the actions, and display panels for the graphics. There was no effort here to get everything right the first time.
If you make some unfortunate choices, it is pretty simple to remedy them, but having the lists in front of you makes it easy to make some quick selections and get something running right away. The Wizard makes its own choices about where to locate the buttons, boxes, and graphs on the screen. You will probably want to change it and fortunately this is a simple matter of dragging things around with the mouse until you have just the right “feng shui”.
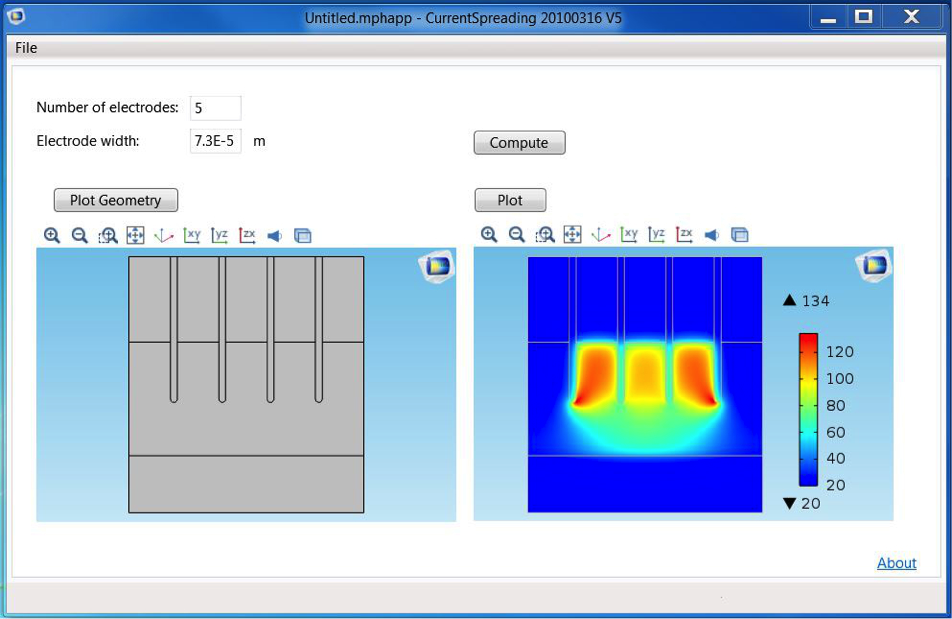
In the IR Microscope application, it seemed that it would be useful for the app users to be able to choose the number of electrodes to model as well as the electrode width. They would undoubtedly want to see a graphical image of the geometry they had specified and would want to see either the temperature map of the print head or the IR emission as seen in the microscope. They would also need buttons to run the model and plot the results.
So these were the selections we made and, moments later, the Wizard had produced an app that looked like this:
This was a fully functional app, ready for use. In fact, all we had to do to try it out was to click on Test Application. The app can also be saved and then opened with a browser or opened in the COMSOL® software environment with a double-click. For many models, the Application Wizard may be all that is needed, but some modelers will want to take this further by using the many powerful tools provided in the Application Builder. We will just touch on two of them.
Taking the App to the Next Level with the Form Editor
First, note that the Application Wizard always produces an app with a single page (or “Form”, as it is called). If you need a lot of input parameters or if you would like to see several graphs and charts, the app that is created may not fit easily on the screen. The cure for this is the Form Editor.
With the Form Editor, you may make changes to the form created by the Wizard and you can create as many additional forms as you like. Perhaps you will choose to devote a form to each graph. If there are many input and output parameters to the model, you might use an entire form for them, so that they can be seen on a single page. When you make extra forms, though, you will need a way to navigate through them and find the ones that you want. You could, for example, make one form that is an index and provide a button to click to go to each of the other forms (and, of course, a button on each of those forms to return to the index). Another method is to create a pull-down menu bar or a ribbon menu at the top of the app to make your form selections.
For our example, we chose to use a Form Collection.
Form Collections
Before making a form collection, we need to create some forms. To do this, we choose “New Form” in the ribbon bar.
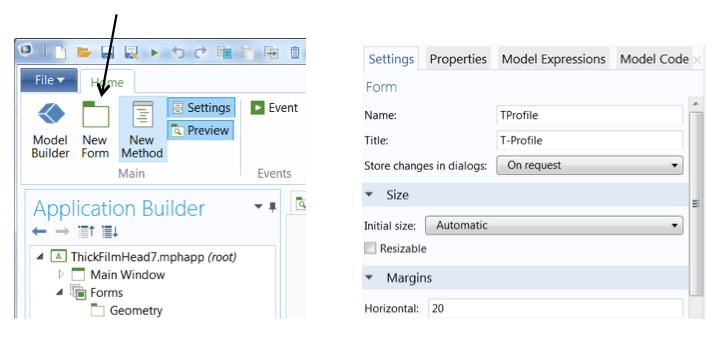
In the settings window for each form, we give the form a name that is preferably descriptive of what it contains. Note that each form has both a name and a title. The Name is a variable name, used to refer to the form in a program or within the Application Builder. It must follow the conventions for variable names — no spaces or odd characters, for example. The Title is a text string label. This is what you will see in your app’s user interface. (To employ an analogy, it’s like addressing a superhero — the Title field is his public persona — and the Name field is his secret superhero identity.)
In our IR Microscope app, we created seven forms. Their names and titles were:
| Name | Title | Contents |
|---|---|---|
| Geometry | Geometry | Input boxes, graph window for Geometry |
| Temperature | Temperature | Input boxes, Compute button, temperature |
| TProfile | T-Profile | 1D graph, temperature profile |
| InSb_Signal | InSb Signal | 2D graph, modeled signal from IR detector |
| InSb_Profile | InSb Profile | 1D graph, modeled profile from IR detector |
| Instructions | Instructions | Instructions for how to use the app |
We originally created the forms with nothing on them, just blank pages. When we were done, the application tree (the outline on the left side of the Application Builder window) looked much like this:
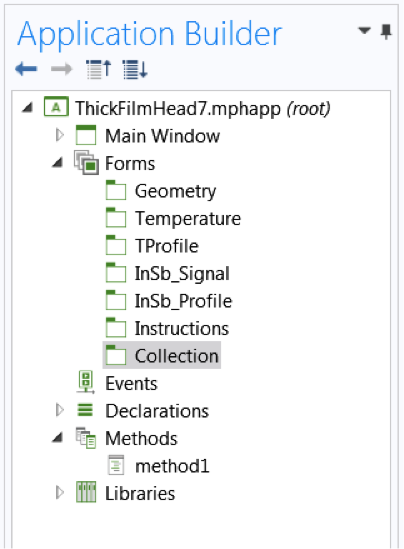
You will notice three things:
- The list of forms now contains each of the six forms listed above.
- It also contains a seventh form called Collection (highlighted in the screenshot above) that we added later.
- Each form in this list is shown according to its “name” and not its “title”.
Once we have this list, we can return to each form by double-clicking on its name in the application tree. This opens the form in the Form Editor and allows you to add your form objects. The form objects can be located by selecting Insert Object in the Application Builder ribbon menu. Each time you add a form object to your form, it will have a settings window that allows you to specify its function.
For example, with a graphics window, you will specify which graph in your model will be displayed in the window. For buttons, you will specify what actions they initiate (like running the model, jumping to a different form, or showing the geometry). With data boxes, you will select which variable or parameter is set or shown by the box.
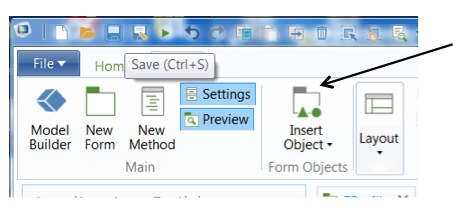
Rather than going into those details, which are covered exquisitely in the Introduction to Application Builder manual, let’s concentrate on the form called “Collection” that was highlighted above.
We added this form after creating all of the other forms and on it, we placed a single form object named “Form Collection”. There are two important settings for the form collection. First, in the “Panes” section of its settings, you may select which of the forms in your application will be part of the collection. (In our case, we added all six forms to the collection.) Second, in the “Active Pane Selector”, we have to choose a variable to hold the name of the currently selected form. The Active Pane Selector box shows you all of the currently eligible variables, and if there is one that you know to be unused, you may select it and click on Use as Source. More likely, you have not foreseen that you would be in need of a new variable. In this case, you just click on the big plus sign in the upper right to create one.
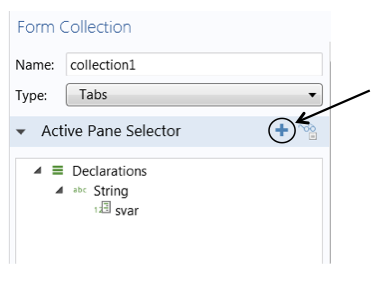
Now, if we return to the application tree and double-click on the form named “Collection”, the top of it looks like this:
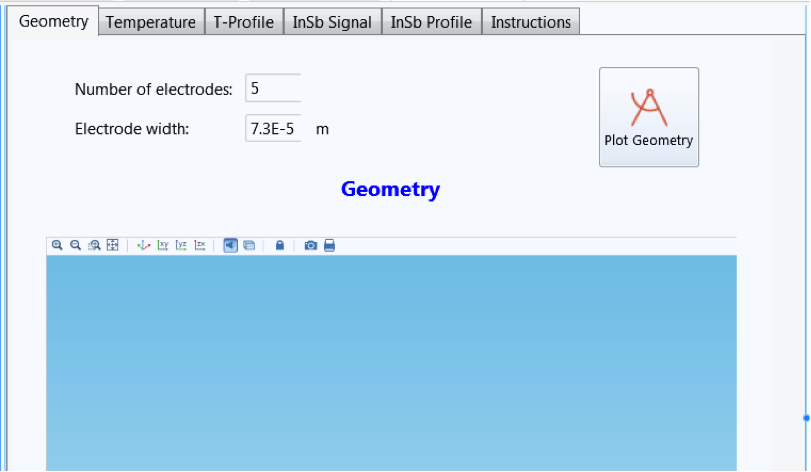
The form is, indeed, a collection. It is composed of all six forms that make up the app and now each one has a tab with its title on it.
Note: In this case, since it is part of the user interface, it is the “Title” of the form that is shown, and not its “Name”!
There is just one more thing to be done. There are now seven forms instead of six. The seventh one is a collection, but in all other respects, it is just another form with a form object on it.
So, when the application starts, which form is it going to show me? This is a choice that is not made in the Form Editor, but is made elsewhere. The choice of start-up window is a fundamental property of the entire application. Therefore, it is one of the settings of the Main Window node in the application tree. Like many other nodes, the Main Window has settings. In the “Form Reference” section of the settings, there is a pull-down list of forms. The appropriate one in this case is the “Collection” form.
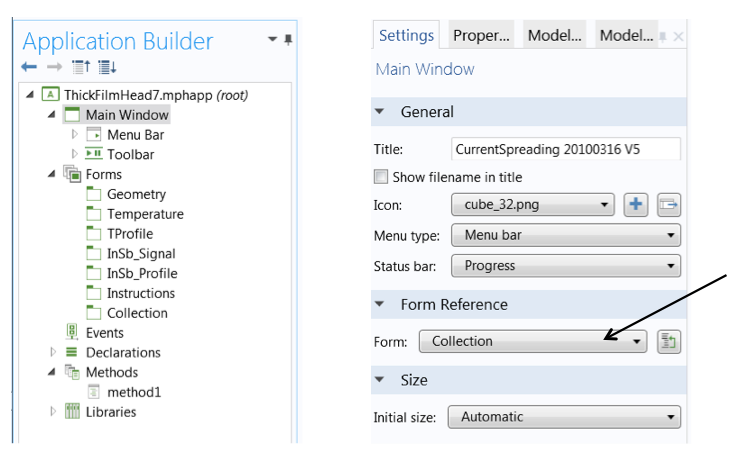
With this done, we can select Test Application in the Application Builder ribbon and witness that the application starts up with the collection window showing. All of the six forms of the application appear as tabs and we can freely move from one to the other by clicking on tabs.
Selection Input
The other aspects of the IR Microscope application (e.g., its use of buttons, data inputs, graphs, etc.) are all straightforward, with the single exception of the “Selection Input”.
In the original IR Microscope COMSOL model, it was evident that there was a substantial thermal interaction between adjacent pixels, and we wanted to provide the user with a means of turning the voltage on and off at each electrode to see the effects. This meant adding the ability for the user to select boundaries on which voltage would be applied.
It is important to know that you cannot do this with the Application Builder alone. It requires collaboration between the Model Builder (the traditional COMSOL Multiphysics GUI) and the Application Builder. The Model Builder, as we know, already provides the ability for the user to select and deselect boundaries on which boundary conditions will be applied. We are, in a sense, just “borrowing” this ability.
So, the first step is to go into the Model Builder tree and find the Electric Currents, Shell node that sets up the electrical boundary conditions on the electrodes. Under this node, we can go to the Electrical Potential subnode that specifies the voltages on the electrodes. Then we see a settings window like this:
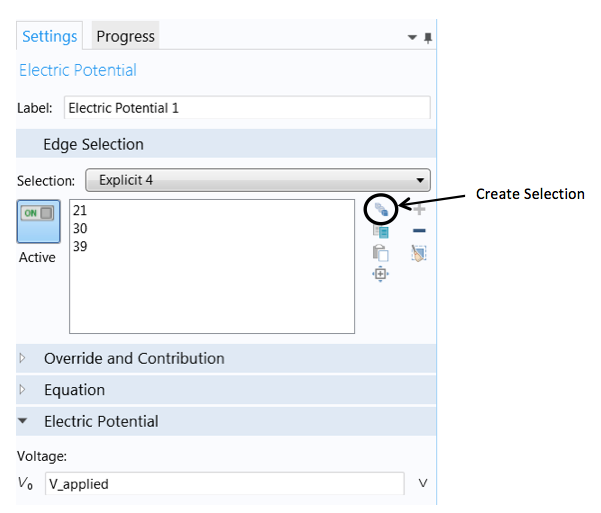
The “Edge Selection” box shows the selected boundaries on which the voltage is applied. All we need to do is to click on the Create Selection icon and give this selection a name. Then it becomes an “Explicit Selection”. As shown in the figure above, we named ours “Explicit 4”. The name and the contents of the selection are actually irrelevant. It is only necessary that an “Explicit Selection” exists. When it does, it will be found listed under the Definitions node of the model tree. Moreover, if you click on “Explicit 4”, you will find that it consists not only of the list of boundaries that was saved, but also the geometry figure to which it applies — in other words, a combination of data and graphics. This is an important fact!
Now, let’s go back to the Application Builder. Here, we can create a form and add a form object of the type “Selection Input” as well as a form object of the type “Graphics”. Let’s say that the selection input is given the name “selectioninput1” and the graphics window is given the name “graphics1”.
When we click on the selection input object, its settings window asks for two things. The first is a “Source”, and here it will provide us with a list of “Explicit Selections” from the model. Clearly, we will want to choose the one we just created, “Explicit 4”, and click on Use as Source. The second thing it asks for is what “Graphics to Use When Active”, which in this case will be “graphics1”. Now it’s ready.
If the app is started and we click on the Selection Input box, we can enter (in the usual ways) the numbers of the boundaries on which the Voltage boundary condition is to be applied. We also see the geometry diagram in the “graphics1” window. What’s more, we can also select and deselect boundaries by clicking on the diagram with a mouse!
Perhaps you do not find that surprising, but you probably will if I tell you that in this app, we can change the number of electrodes. If we do, then the diagram will change accordingly, now having a different number of boundaries, but the selection box still works. That’s not due to any cleverness in the app we created. It is built-in functionality in the software, for which somebody deserves our thanks.
Concluding Thoughts on App Building
That, we hope, explains some of the more interesting parts of the IR Microscope app. They are beyond the basics, but we think that they are important and easiest to learn by example. There are other Application Builder topics that fall in this category; such things as model data access, file handling within an app, animations and players, and using external libraries. We hope that some of these topics will be addressed in future blog posts so that we will all have plenty of examples to work with.
eBay is a registered trademark of eBay Inc.




Comments (1)
Luis Acevedo
July 9, 2015Can i get the file?
Thanks