There are many different forces that can induce flow in fluids, such as kinetic energy, pressure gradients, concentration gradients, and many more. In natural systems, one effect that can initiate fluid flow in a still fluid is a change in density. This density change will result in a change in the fluid’s buoyancy, thus inciting flow as the denser fluid sinks and the less dense, buoyant, fluid rises. You’re probably most familiar with these changes in density occurring due to differences in temperature. But the presence of different concentrations of solutes in a fluid also leads to density differentials; buoyancy-driven flow. A benchmark model that investigates this phenomenon is known as the Elder problem, and it calculates the fluid flow induced in a porous medium in response to time-dependent density changes.
Buoyancy Flow, a Benchmark CFD Problem
In order to explore the Elder problem using simulation, let’s look at how naturally occurring salt deposits can seep into porous, water-saturated rocks; change the fluid density; and create fluid flow. Understanding the ways in which brine and a porous medium interact would interest agriculturalists wanting to preserve their crops from the problems salt can cause them. In order to understand how the Elder problem can be solved using simulation, let’s look at a simplified situation where we can visualize how fluid flow inside a porous medium (sandstone, in this case) would change in response to increased salt concentrations.
Simulating the Effect of Density-Driven Fluid Flow
First, let’s assume that we want to measure the subsurface fluid flow in a 600 m by 150 m underground porous medium. In our simulation, we’ll set the porosity to 0.1, since sandstone usually has a porosity of around 10%. To simplify the model, we can assume that the formation is completely saturated with placid, pristine fresh water with a density of 1,000 kg/m3.
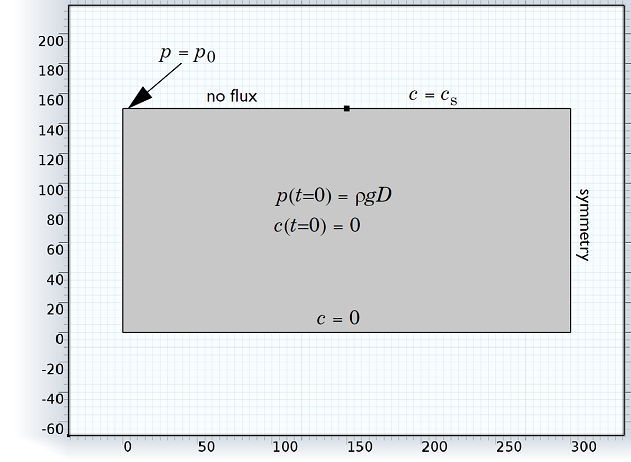
Now we’ll place salt on the surface of the layer. Since we want to visualize how fluid flow will be created inside the pores, we can introduce high salt concentrations to a small portion of the formation’s surface and see how far the brine will permeate into the stone. We can assume that the brine has a salt concentration of 1 kg/m3. In our simulation, the salt will be exposed to the porous medium at the top right-hand boundary of the model, spanning a distance of 300 m. To simulate this situation, we can create a vertical cross section of the porous medium, measuring 300 m by 150 m with a symmetry boundary at the vertical line at x = 300 and extending as a mirror image to the right. The high salt concentration is located along the top right boundary (y = 150) from x = 150 to x = 300. The geometry of the model can be seen below:

Geometry of the simulation for the Elder problem example of a water-saturated porous medium. A boundary of high salt concentration is located in the top right corner, and a mirror image of the model extends to the right of the boundary marked “symmetry”.
Initially, the pristine water in the porous medium is stationary, however, as the salt seeps in from the top right boundary, the water density changes, and fluid flow is created. What will this flow look like in one year? In ten? How far will the salt have seeped into the stone? We can use our simulation to develop an accurate picture of how buoyancy-driven fluid flow will change the salt concentrations in the medium over time.
Visualizing Salt Concentration and Fluid Flow Changes Over Time
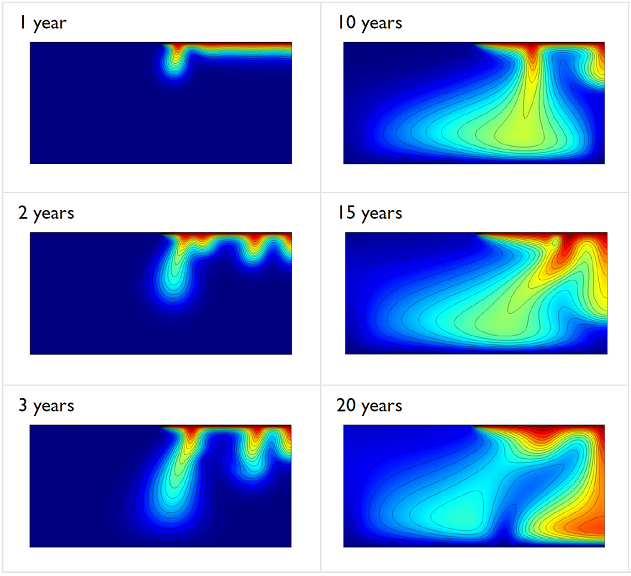
When we run the simulation for a period of 20 years, the results in the images below are obtained:

Snapshots of the salt concentrations in the sandstone using the COMSOL Multiphysics solution to the buoyancy-flow benchmark problem.
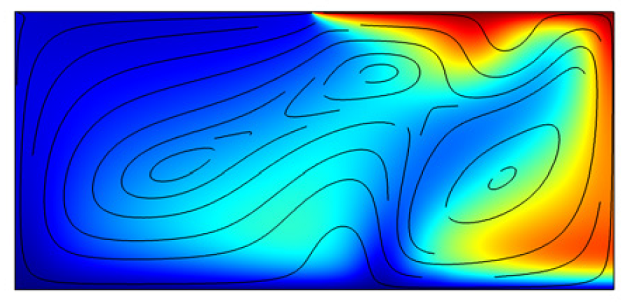
At the beginning of the simulation, the water inside the porous medium is pristine and stationary. However, as the salt concentration mixes with the fluid, the denser salt water is pulled down by gravity, inciting flow. After around 10 years, the salt has traveled around 150 m in the negative direction, reaching the horizontal boundary at y = 0, and covering nearly 60% of the porous medium. After 20 years, almost all of the porous media has been exposed to a salt concentration to some extent. Using this same simulation, we can also visualize the convection cells that are created by the flow field, and how they change over the period of 20 years. The fluid flow in the porous medium after 20 years, and the convection cells caused by the brine, can be seen in the figure below:

Salt concentrations (surface plot) and velocities (streamlines) from the COMSOL Multiphysics solution after 20 years shows the convection cells caused by the intrusion of salt.


Comments (0)