
The flash method, first described by W.J. Parker et. al in 1961, is a widely used technique for measuring the thermal conductivity of materials. Our Flash Method demo app, highlighted here, performs a numerical simulation of this experiment, offering a simplified approach to modifying parameters that can impact its overall accuracy. Today, we’ll take a closer look at this easy-to-use app, as well as the theory behind it.
Flash Method: The Experimental Procedure
A flash method apparatus, like the figure shown below on the left, takes a material sample the size and shape of a coin to measure its thermal conductivity. First, a heat pulse is deposited uniformly on one face of the sample for a few milliseconds. In this short period of time, the deposited power needs to be high enough in order to increase the temperature at the opposite face by about 1 or 2 K.
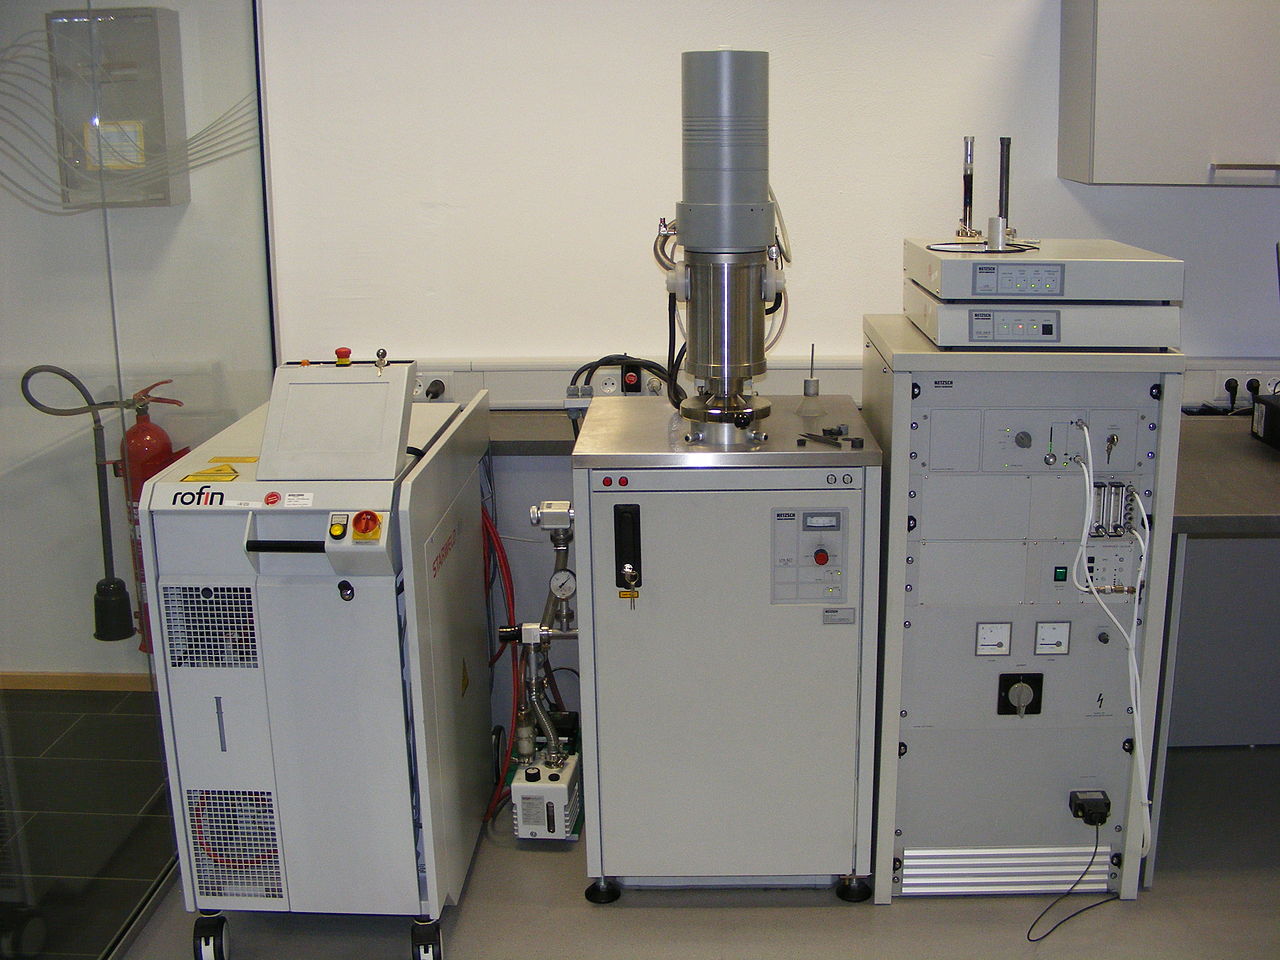
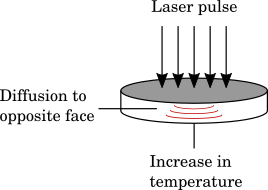
Left: Flash method apparatus. Image by Stonovic — Own work. Licensed under CC BY-SA 3.0, via Wikimedia Commons. Right: Schematic of the flash method procedure.
The figure below depicts a typical thermal response at the rear face. The temperature reaches a maximum value in a few seconds due to the heat pulse. Then, it decreases almost, but not quite, significantly by dissipation through the imperfectly insulated borders of the apparatus from the exterior.
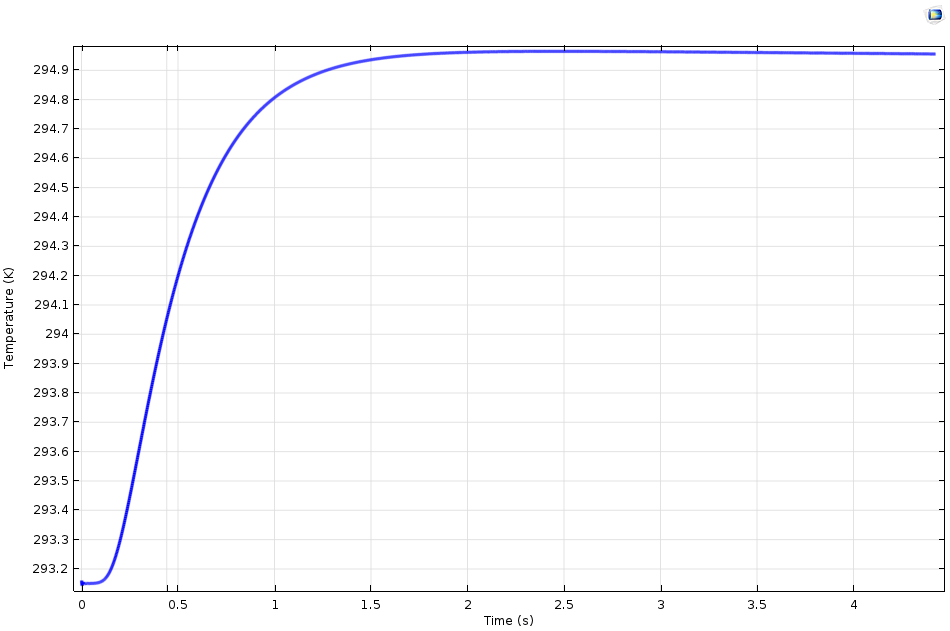
A plot illustrating the typical thermal response at the rear face.
According to the theory for an ideal configuration, knowledge of the sample thickness, H_0, and the half temperature rise time, t_{1/2}, taken by the rear face to increase the temperature by half of the maximum rise is sufficient to estimate the thermal conductivity, k. This can be achieved with the following formula, the justification of which goes beyond the scope of this blog post:
Such an estimation assumes ideal operating conditions (i.e., the sample is perfectly thermally insulated). While this approximation remains accurate enough for many practical applications, it still carries some error due to heat losses resulting from convection and radiation between the sample and the external environment.
Now that we’ve covered the underlying elements of the flash method, let’s move onto the design of our computational app.
Creating a Computational App to Model the Flash Method Procedure
The Flash Method app, like the other examples available in our Application Gallery, is designed to be a source of guidance and inspiration in your app-building processes, as well as to help those who want to utilize simulation without being an expert. With the customization capabilities of the Application Builder, you can tailor the layout and structure of an app’s interface to best suit your particular modeling needs and thus benefit from the simulation capabilities of COMSOL Multiphysics. As is the case here, through the intuitive interface of the Flash Method app, it is easy to model the experimental protocol of the flash method technique.
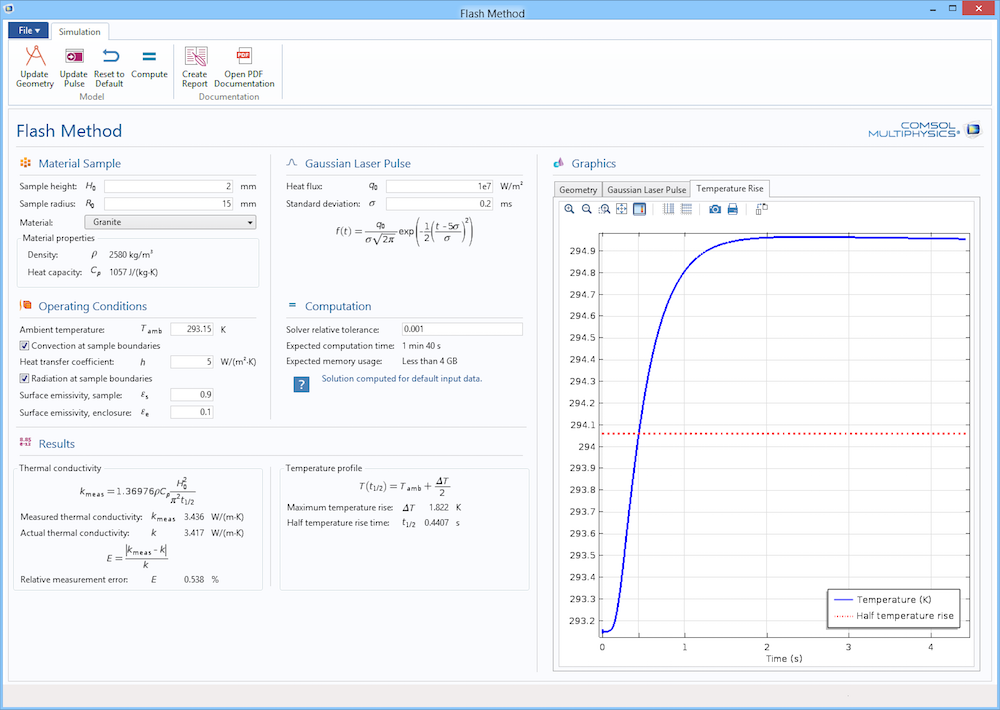
User interface (UI) of the Flash Method demo app.
To customize the material sample, you can begin by defining its radius, thickness, and material. Reducing the sample thickness accelerates the heat diffusion to the opposite face and causes the temperature to rise. This means that the half temperature rise, \Delta T / 2, can be obtained more accurately, but determining the corresponding time, t_{1/2}, requires a temperature sensor with a better sampling rate.
The laser pulse is another parameter that you can specify to fit particular equipment. In this example, only Gaussian pulses are supported and you can choose a custom heat flux (default value of 10 MW/m²) and standard deviation, \sigma. The duration of the pulse is approximately equal to 3 \sigma — 0.6 milliseconds in the demo app’s default settings. For a greater accuracy, the ASTM E1461-13 standard recommends keeping the duration of the pulse at less than 2% of the total time taken to reach the maximum temperature at the rear face. This condition is fulfilled by the default settings of the app.
A convenient ribbon at the top of the window enables you to graphically visualize the geometry representation of the sample and its enclosure in the apparatus, as well as the Gaussian laser pulse profile. The following recording demonstrates this.
The operating conditions, meanwhile, define the following elements:
- Ambient temperature, which is also naturally the initial temperature of the sample
- Convective cooling of the sample by the surrounding air, represented by the heat transfer coefficient h
- Radiative exchanges, via providing the surface emissivities of the sample and enclosure
After computation, which generally takes less than one minute, the numerical results are displayed in the bottom-left area of the Results section.

The Results section of the app.
As highlighted in the screenshot above, the Results section features the measured thermal conductivity, along with the relative error due to the use of the analytical estimate for the thermal conductivity, k. Such information offers an indication of the error that can be expected from the experiment with the specified material, laser pulse, and operating conditions. In particular, this error partly reflects the perfect thermal insulation assumption in estimating k, while the numerical simulation includes convective and radiative losses. However, this does not account for any imprecision of the equipment. For instance, the temperature sensor accuracy and the laser flash pulse may not be perfectly uniform.
The right side of the Results section, meanwhile, showcases the temperature sensor output. In the plot below, a horizontal red line is added to the graph, locating the half temperature rise. Therefore, it is placed at the middle height between the minimum and maximum value taken by the temperature. This intersection gives t_{1/2}.
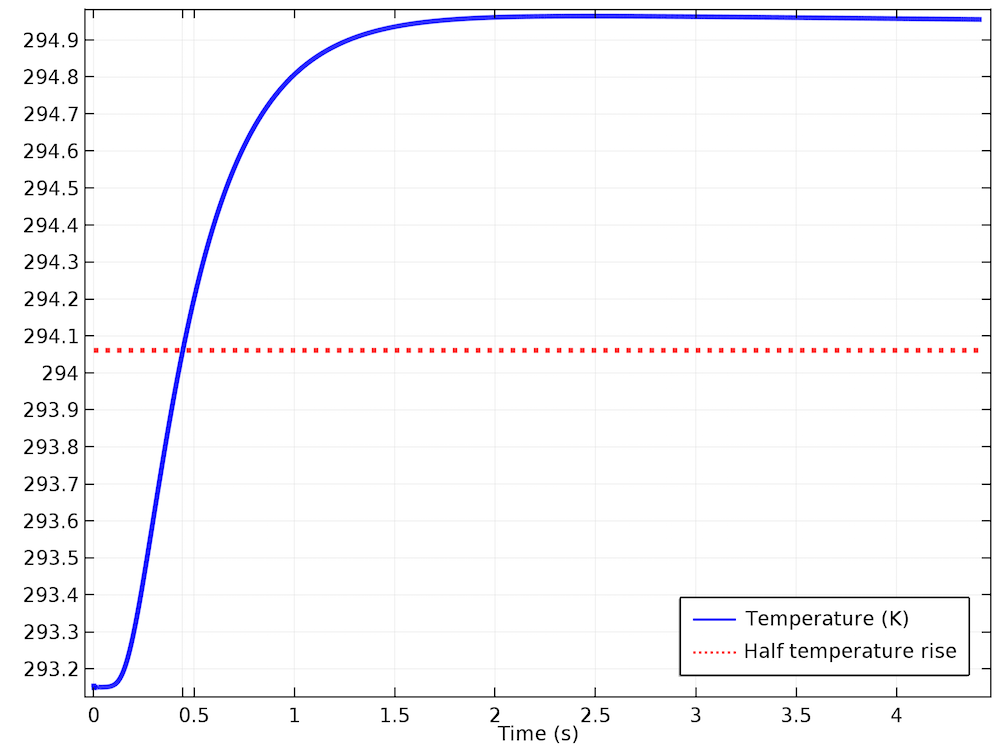
Graphical results highlighting the temperature and half-temperature rise.
An advantage of the Flash Method demo app, as well as any other app, is that you can easily embed the power of the finite element method and its dedicated solvers within a mobile device and run simulations while working in the field. And with the intuitive nature of its interface, users can quickly test out various input values, say for the heat transfer coefficient, in order to run a series of experiments for different convective cooling intensities.
Get started building apps today and experience the many benefits that they can bring to your design workflow…
Further Resources to Advance Your App-Building Processes
- Try it out yourself: Download the Flash Method app
- For further inspiration and guidance in building apps, browse related posts here on the COMSOL Blog
References
- W.J. Parker, R.J. Jenkins, C.P. Butler, and G.L. Abbott, “Method of Determining Thermal Diffusivity, Heat Capacity and Thermal Conductivity,” J. Applied Physics, vol. 32, issue 9, pp. 1679-1684, 1961.


Comments (1)
Gerald Pekmezi
May 28, 2024I am interested in this app, but the download link appears to have been orphaned.