
In 1977, the axion, a type of elementary particle, was suggested as a solution to a theoretical particle physics problem: the strong charge-parity (CP) problem. Later, it was discovered that the particle may actually be a component of dark matter. Many experiments are currently underway that have the goal of detecting axions. In this blog post, we’ll focus on the Axion Dark Matter eXperiment (ADMX), which uses a microwave cavity in an attempt to accomplish this goal.
Detecting an Elusive Particle
Detecting axions seems to be extremely challenging. It is believed that the particle interacts very weakly with ordinary matter and has a very low mass — similar to a ghost particle. However, some spectacular experiments are currently being conducted to find this elusive particle. One experiment is attempting to “shine light through walls” by exposing a laser beam that contains photons to a 9 Tesla magnetic field. Another experiment is striving to find axions produced in the Sun using a special kind of telescope. Moreover, another experiment is aiming to detect a postulated miniscule power source in a microwave cavity.
Challenges in Designing an Axion Detection Experiment
Some major challenges in the design of an experiment to detect axions are that no one knows the particle’s mass or how weakly it couples with ordinary particles. As a matter of fact, the range of predicted masses spans many orders of magnitude (anything from 1 μeV to 1 eV). Masses outside this range are considered less likely due to theoretical and astrophysical considerations. In addition, the so-called coupling constant, which determines how much the axion interacts with ordinary matter, is also unknown.
Several axion experiments are based on the prediction that axions and photons are converted into each other when subjected to a strong magnetic field. The wide range of predicted masses then translates into detecting electromagnetic radiation, or photons, in a span of frequencies. Each team is hoping to find the axion in a certain interval of possible masses and coupling constants, and they are constructing experimental equipment accordingly. Depending on the predicted axion properties, completely different techniques are used.
The Axion Dark Matter eXperiment (ADMX)
The Axion Dark Matter eXperiment (ADMX) takes place at the Center for Experimental Physics and Astrophysics at the University of Washington. The experiment uses a resonant cylindrical microwave cavity within a large superconducting magnet. If the axions turn out to have low masses, they may show up as microwaves detectable by the microwave cavity. The experiment can detect low-mass axions in the range of 1 μeV to 10 μeV. This mass is tiny compared to the electron, which weighs 0.5 MeV, or about a million million times more. The corresponding power spike that the ADMX needs to be able to detect is correspondingly puny, which sets almost impossible requirements for experimental equipment.

Gravitational lensing of a galaxy cluster, which indicates the presence of dark matter.
The innovative ADMX microwave receiver has an extremely low signal-to-noise ratio and uses a Superconducting Quantum Interference Device (SQUID) amplifier that’s cooled by liquid helium. The receiver is able to detect power spikes smaller than one percent of a yoctowatt (yoctowatt = 10-24 watt). This is an unbelievable level of sensitivity that’s close to the theoretical limit set by quantum mechanical fluctuations.
In a way, this experiment cannot fail. Finding the axion in the ADMX would be great, of course. However, proving that the axion is not within its search range would in itself count as a very important research result that would have implications on particle physics and astrophysics. There is also a chance that the ADMX could detect some even more exotic particles, such as chameleon particles or dark photons.
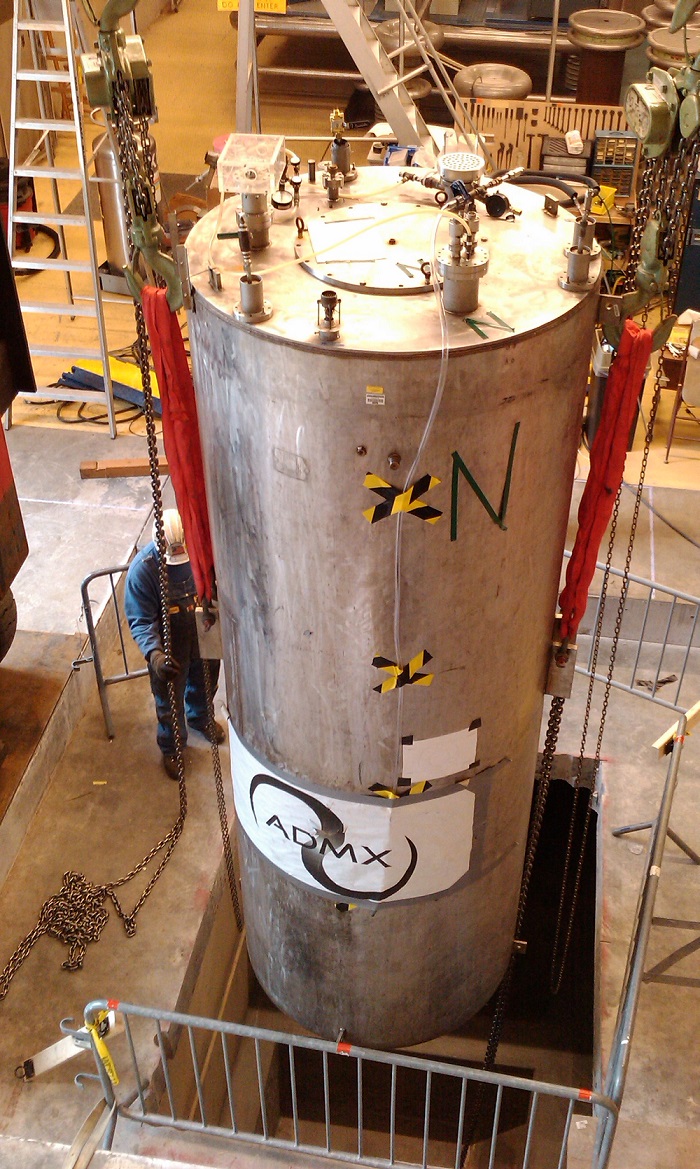
The installation of the Tesla ADMX magnet. (“The 8.5 Tesla ADMX magnet being installed at the University of Washington, Seattle” by Lamestlamer — Own work. Licensed under Creative Commons Attribution Share-Alike 3.0, via Wikimedia Commons).
Microwave Cavities
Microwave cavities are used in many types of microwave applications such as radars, cell phone stations, and microwave ovens. They are also used as resonators because of their excellent ability to store electromagnetic energy.
In the world of electrical circuits, the “cousin” of the microwave cavity is the resonant RLC-circuit, which consists of resistive, inductive, and capacitive circuit elements. A resonant circuit can be made to resonate at a particular frequency by tuning its capacitors and inductors (the principle behind a radio tuner). In a similar way, a microwave cavity can be tuned to the frequency of the axion (or rather the photon that the axion is converted into).
Tuning a microwave cavity is made possible by using tuning rods — metallic or dielectric rods that protrude into the cavity. By simply changing the position of the tuning rods, you change the resonant frequency, or the “radio station”, of the cavity.
Predicting exactly what change in resonant frequency that a particular alteration in the tuning rod position will give is made easier using simulation. We simulated this scenario using the RF Module.
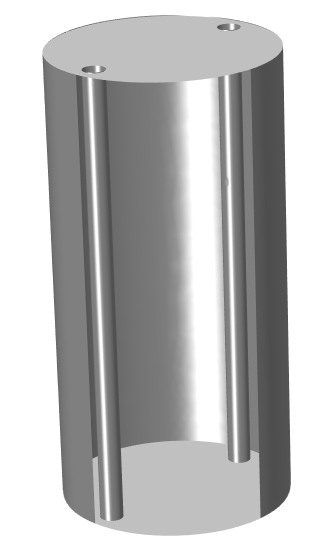
The CAD geometry used in the COMSOL Multiphysics simulation. The cylindrical microwave cavity and the two metallic tuning rods are shown.
Simulations with the RF Module
We created both a 3D and 2D model of the cavity to compare results. The resonant mode that’s expected to couple to the axion-generated photon the strongest is the so-called TM010 mode. To find this particular mode, employing a 2D simulation is just as suitable as a 3D simulation.
The figure below shows the electric field distribution in the 3D model for the TM010 mode.
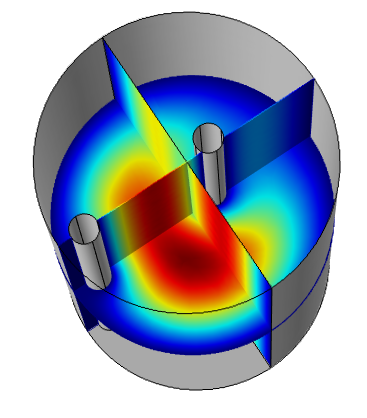
The TM010 mode showing the electric field component aligned with the axis of the cylinder. The normalized field magnitude is plotted on three perpendicular slices.
The superconducting magnet’s externally applied magnetic field has a strong magnetic flux component along the axis of the cylinder. If we assume that the cylinder axis is the z-axis, then we can represent the magnetic flux as approximately B = (0,0,Bz). Using this definition of the z-axis, the resonant TM010 mode is characterized by having a strong electric field component (Ez). So, with good approximation, we have E = (0,0,Ez). The field power is proportional to the dot product of E and B (Ez*Bz). The design of the experiment is meant to maximize this coupling and get the strongest possible signal if an axion-generated photon is created in the cavity.
The figure below shows the corresponding 2D simulation.
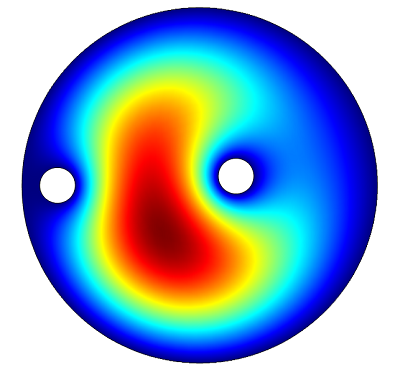
The electric field in the 2D simulation of the cavity.
The 2D and 3D simulations gave identical results. To understand the TM010 mode, it’s sufficient to use a 2D simulation, which is computationally much faster.
The figure below shows a simulation where the resonant frequency is plotted against the angular position of one of the tuning rods.
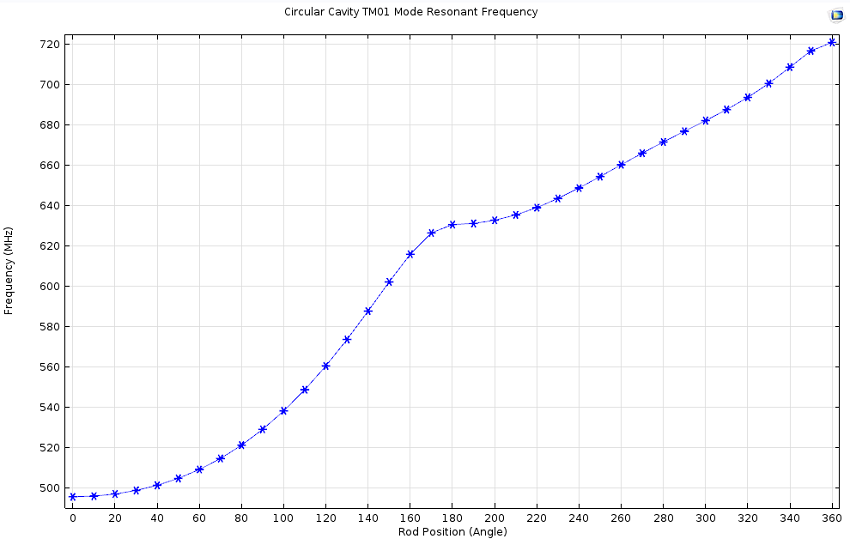
Resonant frequency vs. rod position for the cylindrical cavity simulation.
This simulation shows that this particular cavity design could be used for a search in the interval between ~500-700 MHz.
These results are similar to the results published by the AMDX team. One difference is that the cavity and tuning rods used in the simulation do not have the same properties and exact dimensions as in the ADMX.
Strictly speaking, the classification of a resonant mode being TM010 is only applicable for a cavity that does not contain tuning rods. As a matter of fact, the tuning rods introduce other modes similar to TM010. However, one doesn’t have to rely on the fundamental mode to get a coupling between the magnetic and electric fields. Other modes may also give a reasonable coupling.
The figure below shows a scan that includes an adjacent mode similar to TM010. Its sensitivity is in the range between ~740-800 MHz. The figure also includes a comparison to the 3D simulation.
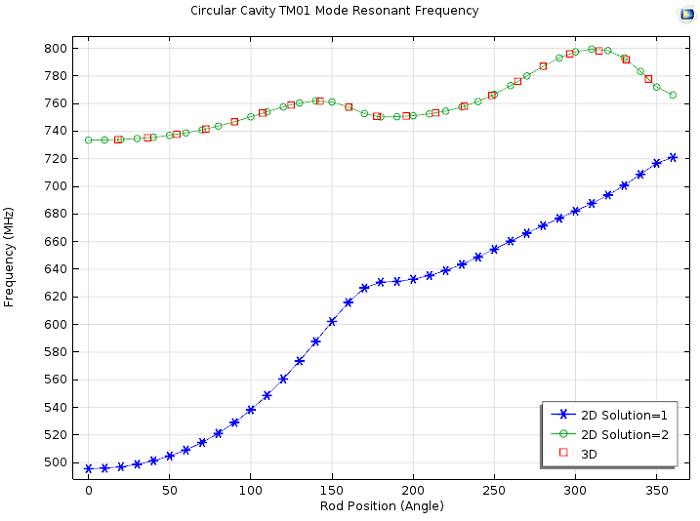
Resonant frequency vs. rod position for two adjacent modes. A comparison of the 3D simulation is included.
It should be noted that even higher-order modes can be used. By using these, one could potentially scan a wider frequency range without having to change the overall cavity dimensions.
Recent ADMX Upgrade
According to a recent presentation, the ADMX recently had major upgrades. The university’s experiment team is ready to begin what it refers to as “the definitive search for dark matter axions”. In the presentation, ADMX representative Gray Rybka confidently states that “if the axion is out there, we will find it”.
Related Resources on Axions
- Read this article: “Could dark matter be hiding in plain sight in existing experiments?“
- Watch this video on dark matter axions


Comments (8)
GuRu@BFI
February 4, 2015The angle changes 0 to 360 degree. But I see no periodic behavior of results.why?
Bjorn Sjodin
February 5, 2015 COMSOL EmployeeHi Yalcin,
Good question. You are right, there is no periodic behavior. The text actually doesn’t describe this. We followed the convention used at the ADMX web page. This is how it works: The first tuning rod is rotated in from 0 to 180 degrees while the second one is kept in its original position. After this the first tuning rod is kept fixed at 180 degrees. Then the second tuning rod is rotated in from 0 to 180 degrees. The resulting change in frequency will be continuous and is, for convenience, labeled with angles ranging from 0 to 360 degrees.
I hope this helps,
Bjorn
GuRu@BFI
February 5, 2015Thanks Bjorn. I have looked at the web page. Now it is clear to me. Each rod can be rotated about an axis. So when a rod is rotated 180, it either become closest or fartherst to the other. This means when one is turned 180 and then the other as the same, the whole range from minimal to maximal seperation is covered, which is not periodic:)
Ian Stern
November 19, 2016Some notes as they pertain specifically to ADMX.
First, the tuning rods used by ADMX do not run the enter length of the cavity, as they must be able to rotate and thus cannot be rigidly connected to the endcaps of the cavity. The resulting gaps create a capacitance that alters the modes locally, breaking TE-TM orthogonality. This causes the TE and TM modes to mix when they are similar in frequency. The mixing greatly reduces Ez*Bz, causing the mode to be unusable for axion searches around those frequencies. Since this is an extremely important phenomenon to ADMX, a 3D model is necessary to properly map the Ez*Bz values of the cavities throughout tuning.
Second, as higher modes are used to search for axions, the Ez*Bz value decreases to about 1/4 the previous mode value (ie., 1, 1/4, 1/16…). So only 2 or 3 modes at any given tuning configuration are usable for conducting a search, making searching at higher frequencies challenging.
Bjorn Sjodin
November 22, 2016 COMSOL EmployeeThanks for your insightful comments about the true ADMX design. Yes, you are correct in that this model is simplified compared to the real case. These simplifications make the 2D and 3D case very similar. The model can be extended to include such gaps to include the effects of that extra capacitance. Perhaps a theme for a future posting.
HMahdy
November 12, 2022Hi Bjorn
I’m working on a research related to Dark Metter and was wondering if there is a way to have access to the COMSOL simulation above! Thank you.
Bjorn Sjodin
November 14, 2022 COMSOL EmployeeHi HMahdy,
We don’t have that model file available. Please contact our technical support team in case you need any advice on setting this up.
HMahdy
November 16, 2022Thanks Bjorn. I appreciate it.