
Guest blogger Linus Fagerberg from Lightness by Design picks up where he left off in his previous blog post to discuss how radiated sound depends on the shell thickness of a muffler.
Here, we discuss different entities for gauging the performance of mufflers. One important parameter is the thickness of the muffler’s casing and how this affects its performance. By performing acoustic-structure interaction simulations, we can see how shell thickness affects muffler performance.
Analyzing How Shell Thickness Affects a Muffler’s Acoustics
Using the same model setup that was defined in the preceding blog post, we perform a parameterized study to observe the effect of varying shell thicknesses on the muffler. We start at a base thickness of 1 mm, which is the original shell thickness that was used in the previous studies. Then, we halve the base thickness and double it.
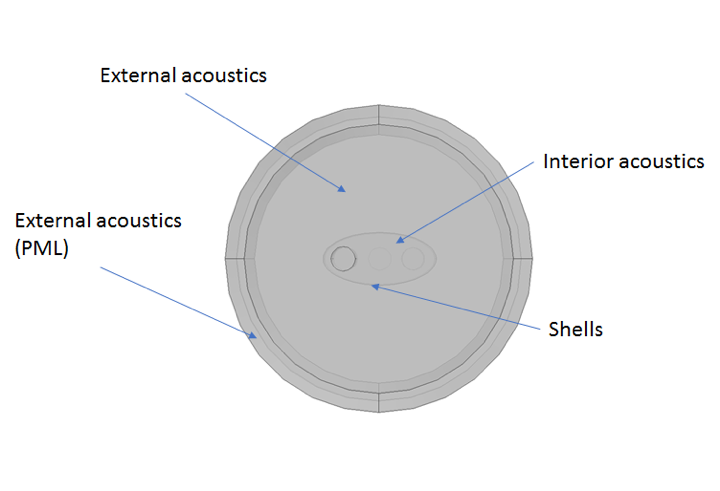
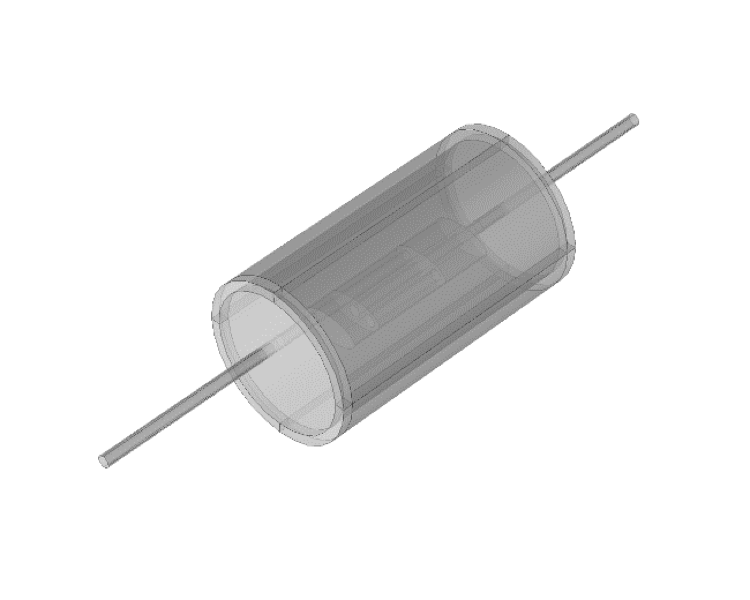
The acoustic domain (see below) surrounding the muffler model provides a good means to assess the sound emission into the atmosphere for the different shell thicknesses.
Figure 1. Cross-sectional and isometric views of the muffler model and surrounding acoustic domain.
Transmission Loss: From Muffler Inlet to Outlet
The transmission loss (TL) from the muffler inlet to the muffler outlet, as defined in the original blog post, is
where Pin is the acoustic power at the muffler inlet and Pout is the acoustic power at the muffler outlet. The variables Pin and Pout are dependent on the pressure at the inlet, pin, and outlet, pout, respectively.
The TL from the inlet to the outlet is computed in this study for the simulation cases with shell thicknesses of 0.5 mm and 2 mm. These TL curves are compared in Figure 2 below, along with the case for the 1-mm shell thickness.
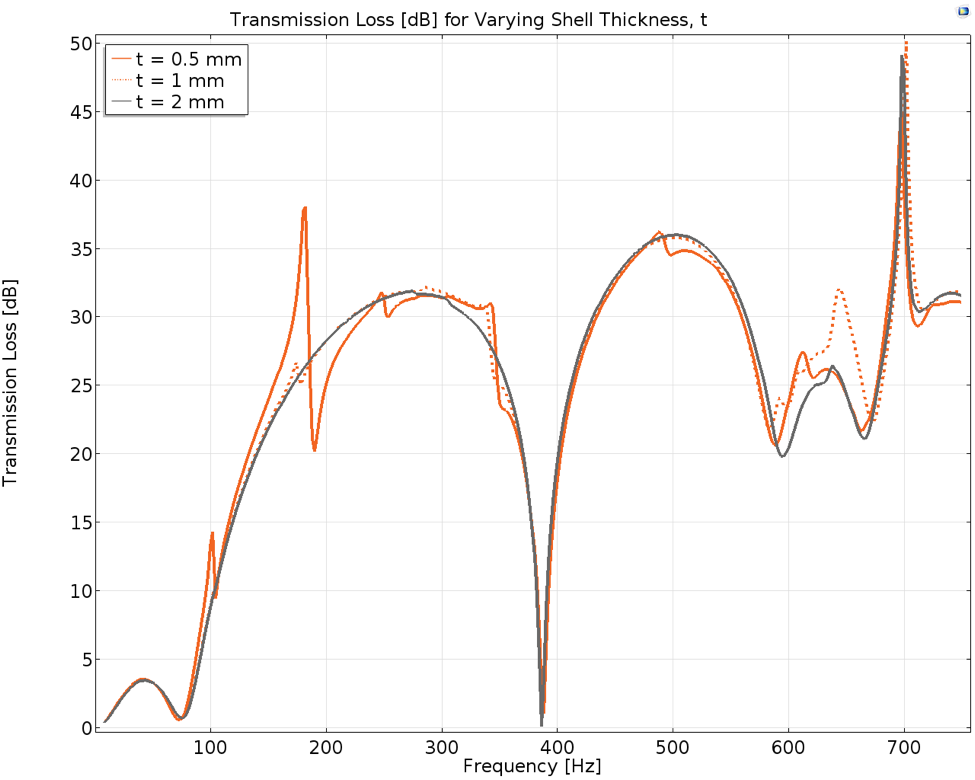
Figure 2. Transmission loss from the muffler inlet to the outlet for shell thickness, t, of 0.5 mm, 1 mm, and 2 mm.
The shell mode noted at 172 Hz for a shell thickness of 1 mm (from the previous studies) is found to occur at 180 Hz for the model with a shell thickness of 0.5 mm. In the vicinity of 180 Hz, the peak and the dip in the curve for the model with the 0.5-mm thickness is far more profound than that of the model with the 1-mm thickness for this eigenmode.
For the 0.5-mm case, the difference in the TL at this mode from the peak to the dip is approximately 18 dB, with a frequency spread of 8 Hz and the dip occurring at 188 Hz. This is expected, as the pressure pulses exciting the shell plates would have a greater impact on the plates with a smaller thickness. Therefore, for the largest computed shell thickness of 2 mm, the curve is smooth in the region where this spike occurs for the 0.5-mm case and 1-mm case.
The behavior of the TL for the 2-mm case is close to that of a pure pressure acoustics simulation, where the boundaries of the muffler are defined as sound hard boundaries. Similarly, the shell mode noted at 342 Hz for the 1-mm shell thickness case is present at 338 Hz for the 0.5-mm shell thickness case, but it is not visible in the TL curve for the 2-mm shell thickness case.
The resonating acoustic mode at 386 Hz is present for all three cases, as noted with a sharp dip present in all three curves at this frequency.
The next notable peak present in all three curves lies between 610 Hz and 640 Hz. As the shell thickness increases, the position of the peak shifts to the right. Shells with a frequency of 614 Hz, 632 Hz, and 638 Hz have a thickness of 0.5 mm, 1 mm, and 2 mm, respectively. This is coupled to the fact that the muffler structure becomes stiffer with increasing thickness and the frequency of this eigenmode is increased.
Despite the right-shift in frequency for increasing thickness, the amplitude of the peak is greater for 1-mm thickness than 2-mm thickness. It would be expected that a structure with a larger shell thickness would produce a better TL than a structure with a smaller thickness. However, an acoustic eigenfrequency noted in the pressure acoustics case from the original blog post is present in the vicinity of the eigenmode for the 1-mm shell thickness case. This acoustic mode could be in phase with the shell eigenmode for the 1-mm shell thickness, which in turn results in a greater peak in TL at this mode than for the other shell thickness cases.
The final peak observed in all three cases for the computed frequency range occurs in the vicinity of 700 Hz. The frequency spacing for this mode is minute for varying shell thicknesses in comparison to that of the preceding eigenmode for different thicknesses. The peaks occur at 696 Hz, 702 Hz, and 700 Hz in the TL curves for 0.5-mm, 1-mm, and-2 mm shell thicknesses, respectively. Therefore, it can be deduced that the frequency at which this eigenmode occurs remains impervious to the variation in shell thickness. It is likely an acoustic eigenmode where the stiffness of the shell does not affect the air contained inside the muffler.
Transmission Loss: From Muffler Inlet to Acoustic Domain Boundary
The transmission loss from the muffler inlet to the acoustic domain boundary was defined in the previous blog post and is also computed in this study for the muffler model with shell thicknesses of 0.5 mm and 2 mm (as plotted in the figure below). The two curves (solid orange and solid gray) are plotted, along with the TL curves from the previous graph, which account for the shell thicknesses of 0.5 mm and 2 mm (the dashed orange line and dashed gray line).
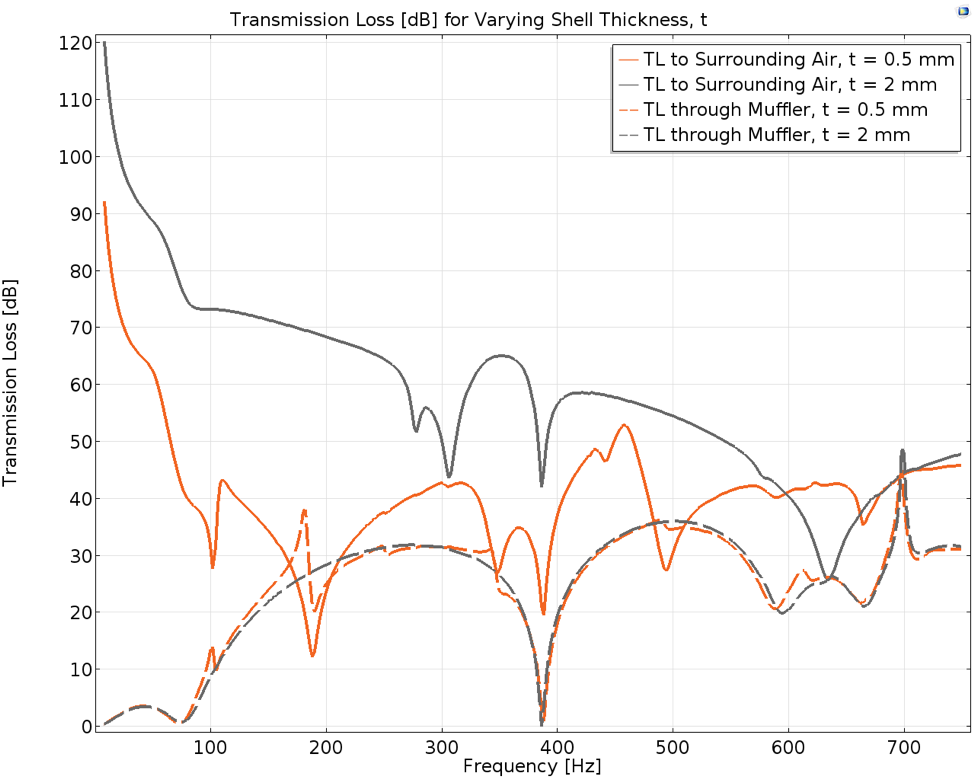
Figure 3. Transmission loss from the inlet to the outlet compared to the transmission loss from the inlet to the acoustic domain boundary, for shell thicknesses (t) of 0.5 mm and 2 mm.
It is evident that the solid gray curve is smoother and has fewer dips and peaks than the solid orange curve. The peaks and dips in the solid orange curve are sharper than that of the solid gray curve. Further, the solid gray curve has a higher TL than the orange curve for most of the computed frequency range. These differences in the solid curves are expected, considering that the muffler shell is stiffer with a thickness of 2 mm as compared with 0.5 mm. A stiffer shell makes the structural response less profound due to its interaction with the air volume in the muffler, causing less shell noise to be emitted into the surrounding atmosphere.
Comparisons can also be made between the curves for the two types of TL for each thickness. It can be noted that for the muffler model with a 0.5-mm thickness, the two orange curves coincide with each other far more than the gray curves. The two gray curves (2-mm shell) sit farther apart from each other than the two orange curves (0.5-mm shell) do for most of the computed frequency range. For the orange curves, the TL from the muffler inlet to the acoustic domain boundary drops below the TL from the inlet to the outlet in the vicinity of the 180-Hz shell eigenmode. This indicates that at this mode, more sound is emitted into the surrounding atmosphere than passes through the muffler outlet.
A more acoustics-specific comparison of the transmission loss from the muffler inlet to the acoustic domain boundary for the three shell thicknesses is provided in the plot below, by arranging the data in 1/3 octave bands.
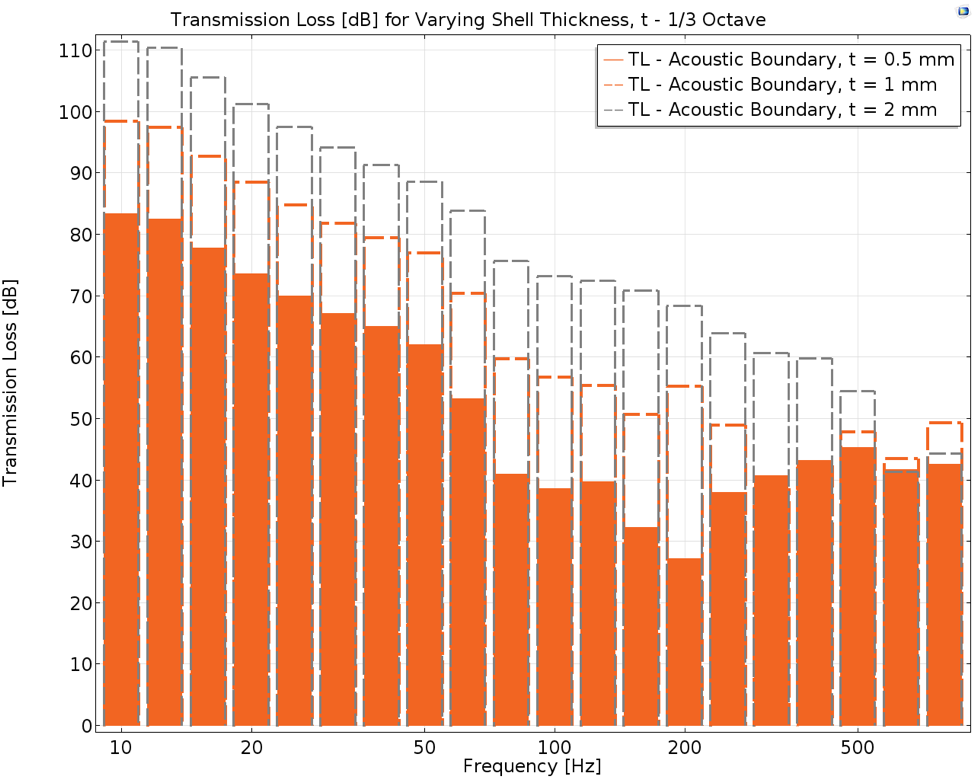
Figure 4. Transmission loss from the muffler inlet to the acoustic boundary, plotted in 1/3 octave bands for the three thicknesses.
Representing the transmission loss for different shell thicknesses by binning the TL in fractional octaves is akin to what is done with empirical data obtained from acoustic measurements to meet established standards. It can be clearly noted from the graph above that the muffler with a shell thickness of 2 mm performs best in most bands, except for the last two bands. This can be validated by looking at the solid gray curve in the line graph discussed at the beginning of this section, where it starts to dip after 600 Hz.
Computing the Muffler Efficiency
Aside from the transmission loss, an additional measure for gauging muffler performance is the muffler efficiency, which is defined as
where Pin and Pout are the acoustic power at the muffler inlet and outlet, respectively.
The muffler efficiency for the three shell thicknesses is plotted below, and it can be seen that the efficiency for each case is quite similar over the computed frequency range.
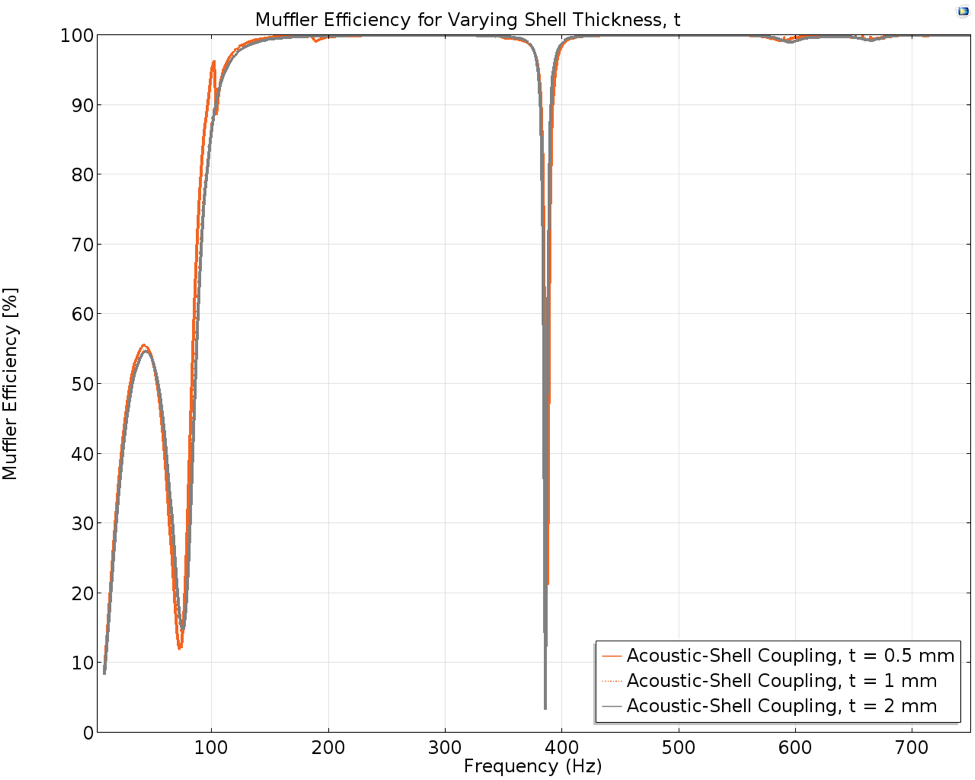
Figure 5. Muffler efficiency for the muffler inlet to the outlet for the different shell thicknesses.
The muffler performs at almost 100% efficiency from approximately 200 Hz onward for all three cases. The only exception in all cases is at the resonating acoustic mode of 386 Hz, when a sharp dip is observed. The muffler efficiency for computed frequencies below 85 Hz is less than 60%, and the poor performance of the muffler in the low-frequency range is also evident in the TL from the inlet to the outlet, shown at the beginning of the blog post.
Evaluating Normalized Radiated Sound Power
A third means to quantify muffler performance is the normalized radiated sound power at the acoustic domain boundary, which is defined as
where Pout_domain is the acoustic power at the acoustic domain boundary. This variable is dependent on pout_domain, the pressure at the acoustic domain boundary.
The computed P*out_domain for each of the three cases with different shell thicknesses is plotted in Figure 6 below.
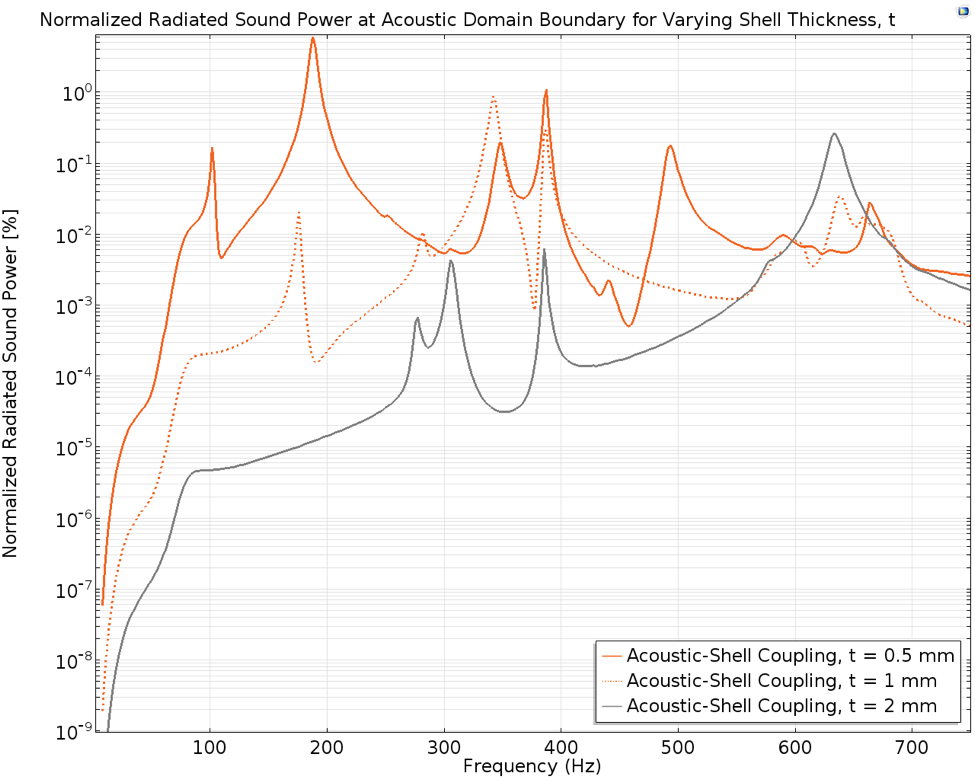
Figure 6. Normalized radiated sound power at the acoustic domain boundary for the shell thicknesses.
As expected, for most of the computed frequency range just below 600 Hz, the muffler with the 0.5-mm shell thickness has the highest sound radiation into the acoustic domain and the muffler with the 2-mm thickness has the lowest emitted sound. The sharp drop in the solid orange curve at 188 Hz in Figure 2 is noted as a large spike in the solid orange curve in Figure 6 (above). Therefore, the muffler with a shell thickness of 0.5 mm radiates more than 5% of the incident power into the atmosphere at the eigenmode occurring between 180 Hz and 188 Hz.
Although other peaks are present in the three curves, particularly at frequencies close to eigenmodes, these peaks are minute in comparison to the peak at 188 Hz for the 0.5-mm case, with less than 1% of incident power radiated into the surrounding domain.
Sound Pressure Level and Muffler Shell Thickness
The sound pressure level at the peak of normalized radiated sound power for each of the three shell thicknesses is plotted (as isosurfaces) below.
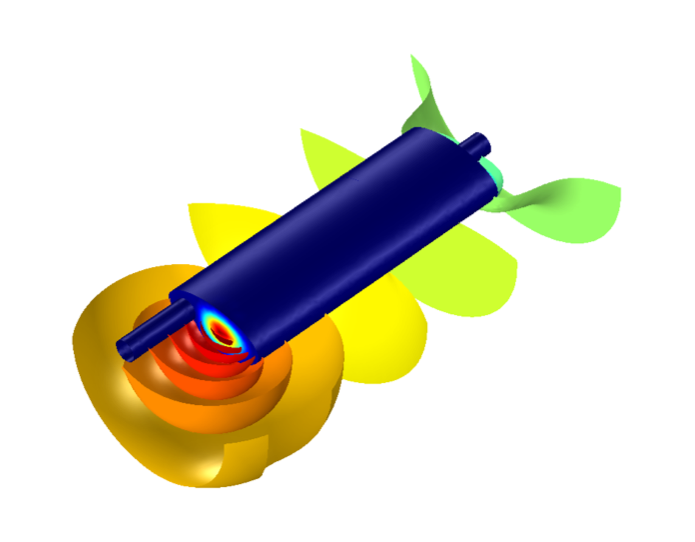
Figure 7. Sound pressure level at 188 Hz, t = 0.5 mm.
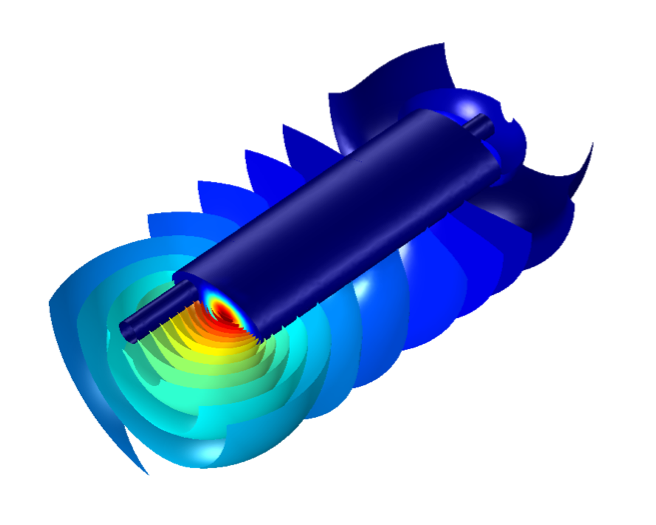
Figure 8. Sound pressure level at 342 Hz, t = 1 mm.
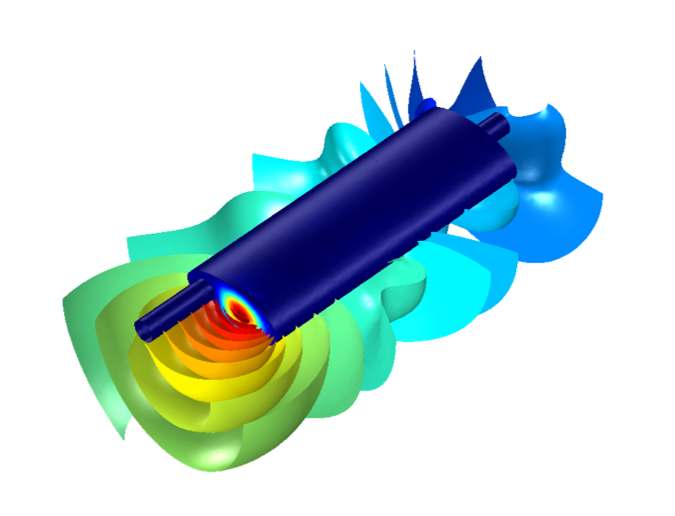
Figure 9. Sound pressure level at 634 Hz, t = 2 mm.
Concluding Remarks on Shell Thickness and Muffler Performance
It has been shown that the shell thickness drastically influences the performance of a muffler. Naturally, the greater the thickness, the stiffer the structure. Thus, with increasing thickness, the transmission loss curve approaches the hard boundary condition in a pure acoustics analysis (compare Figure 2 to the results from the previous blog post).
Further, the peak sound power radiating into the surrounding air is reduced from more than 5% to less than 1%, merely by increasing the shell thickness from 0.5 mm to 1 mm.
In addition to the reduction of the maximum radiated sound power, it is interesting to note the transmission loss curves in Figure 3. The results exemplify the complexity of the stated problem: The location of greater transmission loss is not constant, but rather a function of the frequency and shell thickness. For example, the intersection of the 0.5-mm curve indicates that the (total) transmission loss into the surrounding air is greater than at the muffler outlet. As we might expect, the greatest difference in transmission loss for increasing shell thickness generally occurs in the surrounding air. However, at certain frequencies (around 630 Hz), the transmission loss for the 2-mm shell thickness analysis reduces even below the corresponding 0.5-mm case.
In conclusion, the COMSOL Multiphysics® software provides a remarkably simple way to investigate the influence of the interaction between structural elements and gases or fluids. This enables acoustics engineers to easily determine suitable materials and/or structural parameters to obtain the desired behavior of the component. Common applications include analyses with regards to vibration, fatigue properties, and component noise evaluation.
About the Guest Author
Linus Fagerberg of Lightness by Design is an experienced consultant working with simulation-supported product development. He holds a PhD from KTH Royal Institute of Technology and is specialized in the structural mechanics of composites, stability, and optimization. Linus believes that numerical simulation is a great tool to consistently deliver high-quality products, improve performance, and mitigate risks. Lightness by Design is a COMSOL Certified Consultant based in Stockholm, Sweden.




Comments (1)
Ulf Orrenius
July 4, 2020Hi Linus,
good and interesting analysis. Do you think it would be possible to include the effect of a realistic mass flow, see for example https://sidlab.se/references/sidlab-references-1/?
/Ulf