
In this follow-up to a previous blog post on damping in structural dynamics, we take a detailed look at the harmonic response of damped mechanical systems. We also demonstrate different ways of setting up a frequency-response analysis in the COMSOL Multiphysics® software as well as how to interpret the results.
What Is Frequency Response?
In a general sense, the frequency response of a system shows how some property of the system responds to an input as a function of excitation frequency. When talking about frequency response in COMSOL Multiphysics, we usually mean the linear (or linearized) response to a harmonic excitation. In order to produce a frequency response curve, we need to perform a frequency sweep; that is, solve for a number of different frequencies. A frequency response curve will, in general, exhibit a number of distinct peaks located at the natural frequencies of the system.
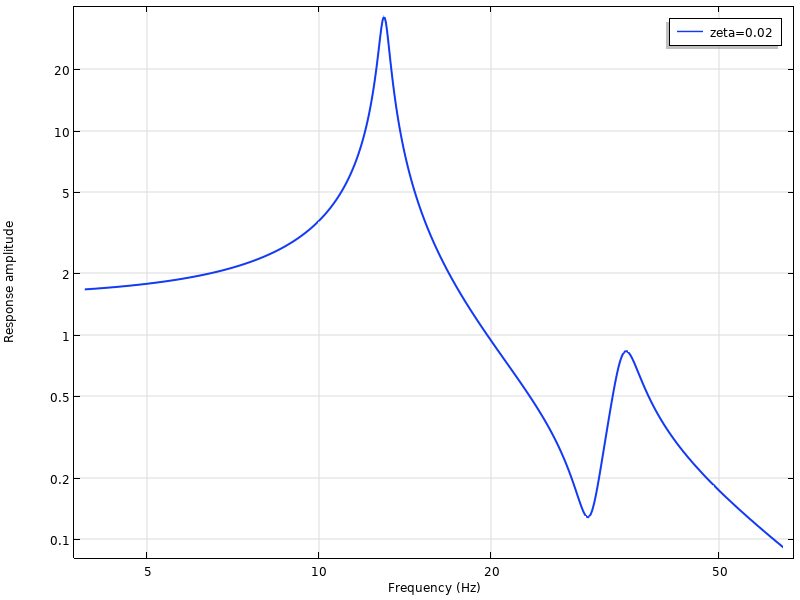
A typical frequency response curve. There are two natural frequencies at 13 Hz and 31 Hz in the plotted range.
The Single-DOF System, Revisited
Various aspects of the dynamics of a single-DOF system with viscous damping were discussed in the previous blog post. One result is that the damped natural frequency is
\omega_d = \omega_0\sqrt{1-\zeta^2} \approx \omega_0 \left ( 1 – \frac{\zeta^2}{2} \right )
This is the frequency at which the system will vibrate (with a decaying amplitude) if released from a deformed state, when there is no other external excitation.
An interesting question arises: “Which excitation frequency will give the maximum amplitude of the response?” You would expect it to be exactly the damped natural frequency, but as we will show below, this is not the case.

A single-DOF system.
Since we are dealing with harmonic motion, it is convenient to use a complex notation, factoring out the common harmonic multiplier e^{i \omega t}. The equation of motion is then
\left (-\omega^2m +ic\omega +k \right) u = f
The phase angle of the load f can be taken as reference so that f is real-valued. A normalized form can be obtained by dividing by the stiffness k:
\left (1-\left (\frac{\omega}{\omega_0} \right) ^2 +2i\zeta \left (\frac{\omega}{\omega_0} \right) \right) u = \frac{f}{k}
The right-hand side is now exactly the static displacement. Thus, the ratio between the dynamic and static solutions is
\displaystyle H(\omega) = \left (1-\left (\frac{\omega}{\omega_0} \right) ^2 +2i\zeta \left (\frac{\omega}{\omega_0} \right) \right)^{-1} =\frac{1}{1-\beta ^2 +2i\zeta \beta}
The function H is sometimes called the transfer function.
Here, β is used to denote the ratio between the excitation frequency and the undamped natural frequency. The magnitude of the transfer function is
\displaystyle \left | \frac{1}{1-\beta ^2 +2i\zeta \beta} \right | = \frac{1}{\sqrt {(1-\beta ^2)^2 +4\zeta^2 \beta^2}}
This function is shown in the graph below.
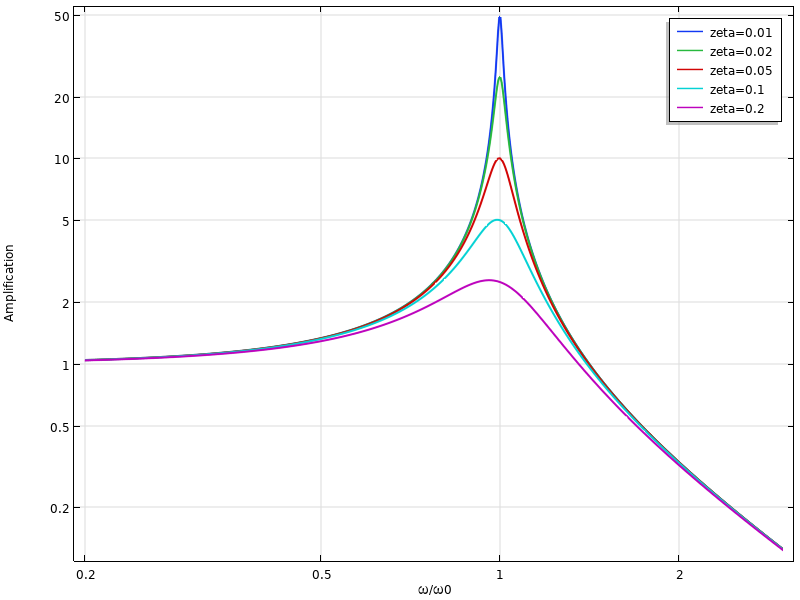
Using standard calculus, the frequency giving maximum amplitude can be determined by finding the minimum of the (squared) denominator {(1-\beta ^2)^2 +4\zeta^2 \beta^2}. The result is
\beta = \sqrt{1-2 \zeta^2}
Thus, the excitation frequency giving the maximum response is
\omega_{\mathrm {max}} = \omega_0\sqrt{1-2\zeta^2} \approx \omega_0 \left ( 1 – \zeta^2 \right )
which is lower than the damped natural frequency. Actually, the frequency shift is twice as large.
The fact that the excitation frequency that causes maximum amplification does not coincide with the frequency of free vibration may seem like a paradox. This can be attributed to the phase shift between force and displacement caused by the damping. Without damping, the load and displacement flip from being perfectly in phase below the natural frequency to being 180° out-of-phase above the natural frequency. With damping, the transition in phase shift is smooth, as shown in the graph below. Irrespective of the damping level, the phase shift at the undamped natural frequency is always 90°.
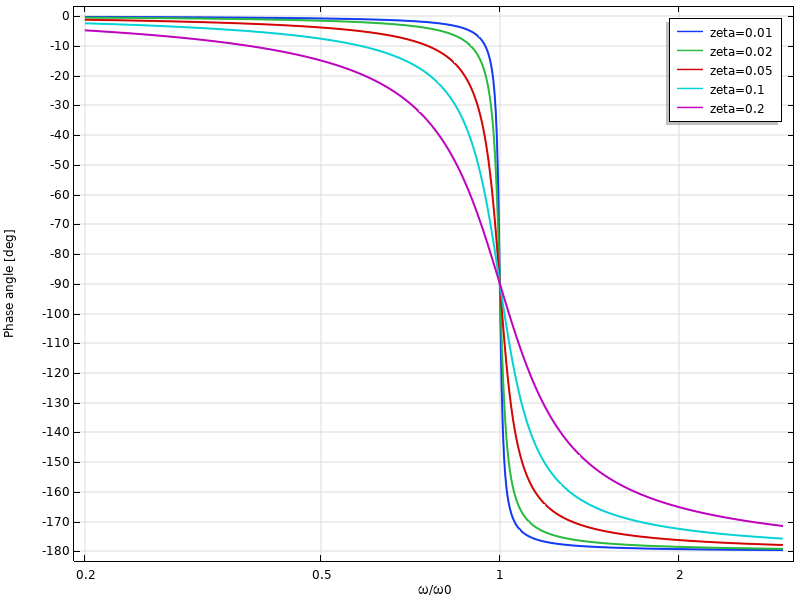
Phase shift of the displacement as function of frequency.
The fact that the force and displacement are slightly out-of-phase when there is damping affects the possibility of the force to supply energy to the system.
Loss Factor Damping
Let’s repeat the analysis for a single-DOF system with loss factor damping. In this case, the equation of motion is
\left (-\omega^2m +k(1+i\eta ) \right) u = f
and the damped natural frequency can be shown to be
\displaystyle \omega_d = \omega_0 \sqrt {\left( \frac{1}{2} \left( 1 + \sqrt{1+\eta^2} \right ) \right ) } \approx \omega_0 \left (1 + \frac{\eta^2}{8} \right )
It may come as a surprise that the effect of adding damping in this case is to increase, rather than decrease, the natural frequency. The explanation is that this form of loss factor damping representation actually also increases the stiffness. The absolute value of the complex-valued stiffness is
|\tilde k| = k \sqrt {1 + \eta^2} \approx k \left ( 1+ \frac{\eta^2}{2} \right )
With this loss factor damping, the transfer function is
\displaystyle \frac{1}{1-\beta ^2 +i\eta }
and its magnitude is
\displaystyle \left | \frac{1}{1-\beta ^2 +i\eta} \right | = \frac{1}{\sqrt {(1-\beta ^2)^2 +\eta^2}}
It can be immediately seen that the maximum amplitude occurs at β = 1; that is, at the undamped natural frequency. Again, maximum amplification occurs at a frequency that is lower than the damped natural frequency.
The alternative definition of loss factor damping mentioned in the previous blog post has the property that the absolute value of the complex stiffness is independent of the damping level. This is obtained by using a definition that normalizes the complex stiffness so that a pure rotation in the complex plane is obtained,
\tilde k = \displaystyle \frac{k(1+i \eta)}{\sqrt{1+ \eta^2}}
Such a formulation leads to a natural frequency that decreases with damping:
\displaystyle \omega_d = \omega_0 \sqrt { \frac {\frac{1}{2} \left( 1 + \sqrt{1+\eta^2} \right )}{1+ \eta^2} } \approx \omega_0 \left (1 – \frac{3\eta^2}{8} \right )
An analysis that is omitted here will show a corresponding drop in the excitation frequency that will give the maximum amplification so that it is still lower than the damped natural frequency.
The phase shift between excitation and response when using loss factor damping is particularly interesting: Even at very low excitation frequencies, there is still a phase shift. Its asymptotic value is arctan(η).
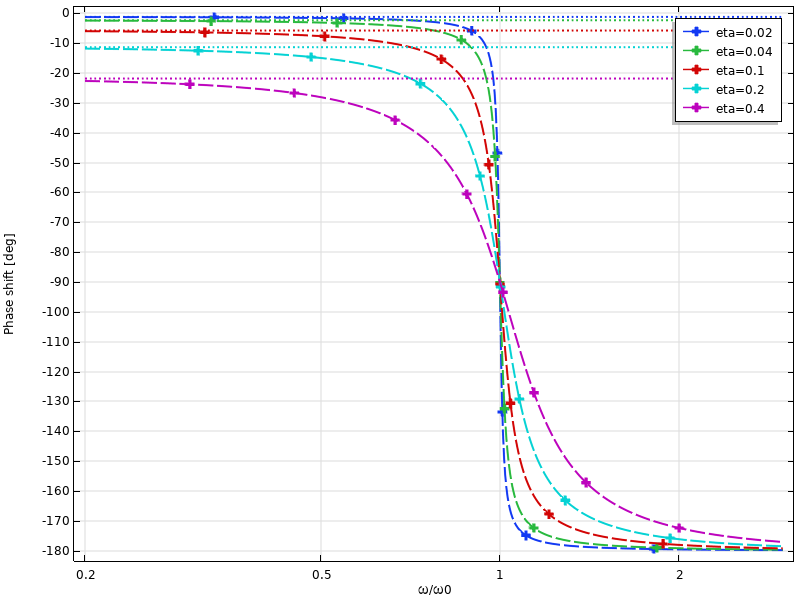
Phase shift of the displacement as a function of frequency when using loss factor damping. Low-frequency asymptotes are indicated by the dotted lines.
A Note About Friction
When friction between two surfaces supplies the damping mechanism, the response to a harmonic input is no longer harmonic because of the nonlinearity in the system. There may still be a periodic, but anharmonic, response. Such problems cannot be solved by the frequency-domain methods, in which the assumption is that the input-output relation is linear.
Modeling Frequency Response in COMSOL Multiphysics®
Setting Up the Study
After adding a structural mechanics physics interface in the Model Wizard, you will be presented with a number of study types, four of which can be used for computing frequency response:
- Frequency Domain
- Frequency Domain, Prestressed
- Frequency Domain, Modal
- Frequency Domain, Prestressed, Modal

Available study types for a Solid Mechanics interface.
Two of the studies use a direct solution approach and two use the mode superposition approach. In the prestressed types of analysis, the change in stiffness from a stationary preload is taken into account. Mode superposition is very well suited for frequency-domain analysis, since it it easy to select the appropriate eigenmodes based on the given frequencies.
In either case, you perform a frequency sweep by providing a list of frequencies in the study settings for which the response is computed. Often, you want to cluster the frequencies around the natural frequencies of the structure.
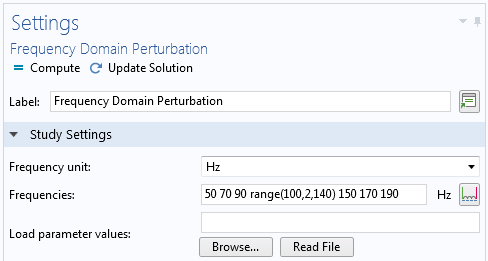
Entering frequencies for a frequency sweep.
Note that without damping, the response exactly at a natural frequency tends toward infinity. This means that it is not possible to solve an undamped frequency response problem at, or close to, a natural frequency. The numerical formulation will give a singular, or at least ill-conditioned, system matrix.
Perturbation or Not?
There is a very important setting in the Stationary node in the solver sequence for a frequency-domain study: Linearity.
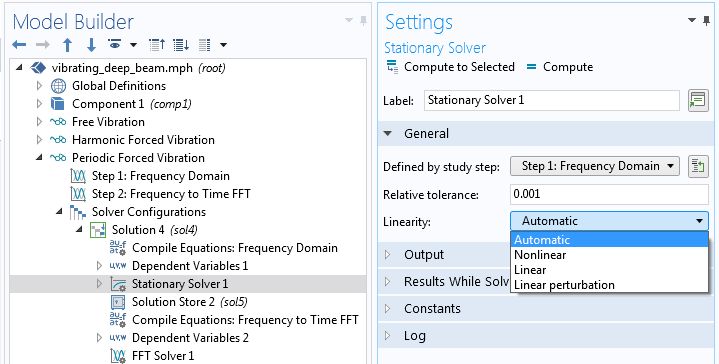
Selecting the Linearity property.
In principle, any frequency-domain analysis can be considered to be a small perturbation, so using Linear perturbation is never wrong. The most common case, however, is that the vibrations are centered around zero. In that case, it does not really matter whether the problem is considered as Linear or Linear Perturbation. The setting does, however, always fundamentally change the interpretation of loads. A load can be tagged as Harmonic Perturbation. Such a load is only taken into account if Linearity is set to Linear perturbation. All loads not marked as Harmonic Perturbation are ignored in such a study. Conversely, if Linearity is not Linear perturbation, then all loads marked as Harmonic Perturbation are ignored, and other loads are considered as harmonic.

An edge load, designated as Harmonic Perturbation.
The purpose of this setting is to be able to discriminate between loads causing a possible prestress state and the harmonic excitation acting on top of that.
When you add a standard Frequency Domain study, the study is, by default, not set as perturbation. Thus, the Harmonic Perturbation tag should not be used for the loads in this case, unless you change the Linearity setting. When you add a Frequency Domain, Prestressed study, the frequency response study step is set up for perturbation analysis. If the study is of a mode superposition type, then the study is always of a linear perturbation type.
Interpreting the Results
The results of a frequency-domain analysis are complex-valued and the harmonic variation is implicit. The phase angle of the complex number describes the phase shift with respect to the reference phase (which can be chosen arbitrarily, but is often taken as the phase of the main load). It also provides information about the phase shift between different points in the structure. Note that since the displacement components within a single finite element can have different phase angles, it is also quite possible that the components of the stress tensor are not in phase with each other. This can be of importance in, for example, fatigue analysis.
In many cases, like in a color plot, it is only possible to display a real number. The convention during all results presentation is as follows: If you request a complex-valued variable v in a context where a real value is expected, then the real part is used.
\displaystyle v = \Re(\tilde v e^{i \phi})
The phase angle Φ is a property of the dataset that you can modify.
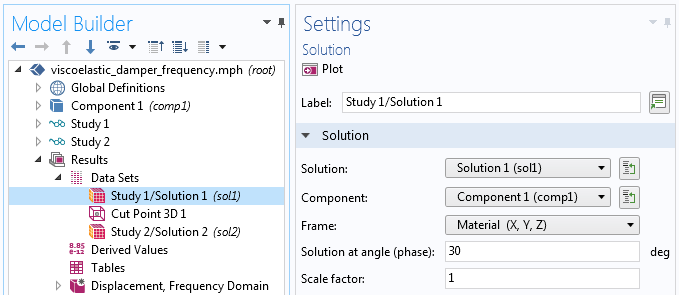
Adjusting the phase angle in the dataset.
In most frequency-response analyses, you are interested in the amplitude of a result quantity, v, as function of frequency. This means that you should investigate abs(v) rather than v itself. The difference between the two is shown in the figure below.
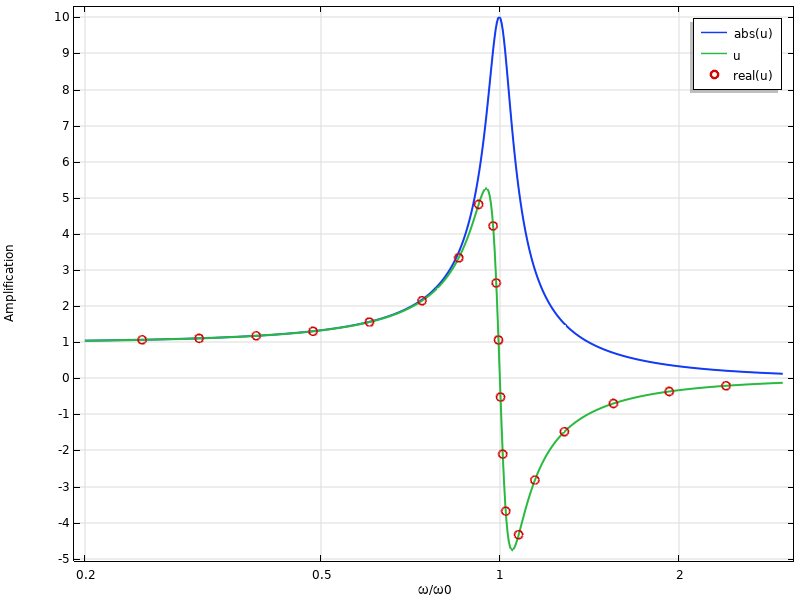
Example of a frequency response graph. Note that the graph of “u” is identical to “real(u)”.
In order to see what happens in more detail, we can add the imaginary part and argument of the result quantity to the graph:
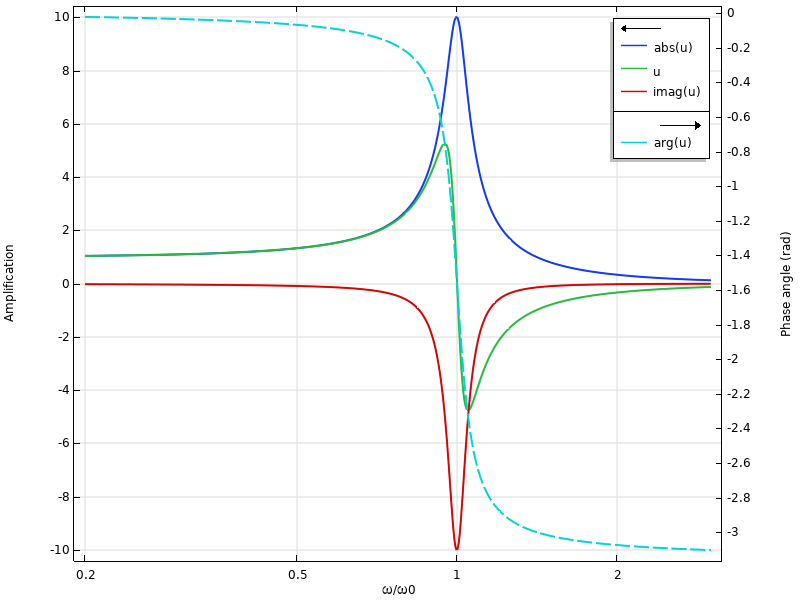
Frequency response including phase shift.
For low frequencies, the real part is close to the absolute value. In the vicinity of the natural frequency, the imaginary part is dominant instead. This means that the response is almost out of phase with the excitation.
Now, let’s investigate what happens if we change the phase angle in the dataset to 45°.
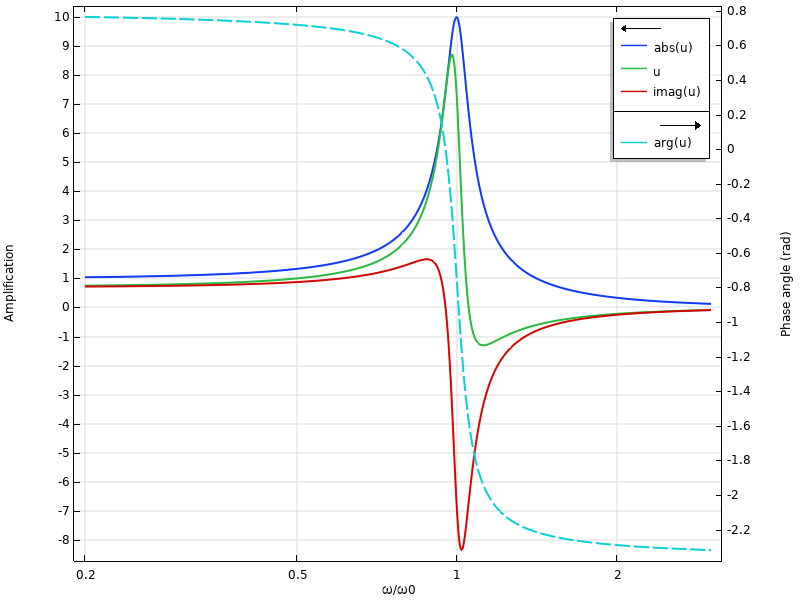
Frequency response when the phase angle in the dataset is 45°.
As expected, the amplitude graph does not change. However, the individual values of the real and imaginary parts do. The phase angle curve shifts π/4 upward. Actually, this is the same exact graph that we would obtain if a 45° phase angle was added to the load.
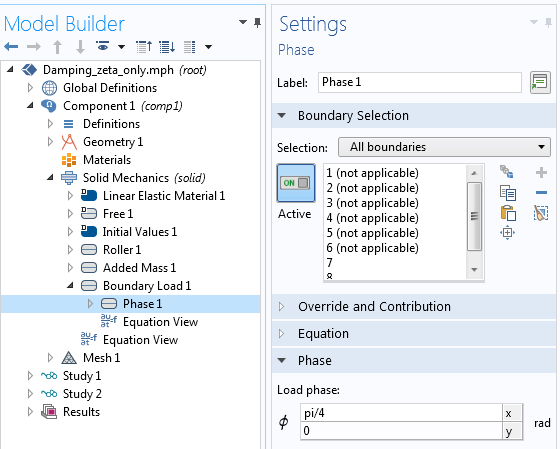
Adding a phase angle to a load.
Instead of using the phase angle input, you can equivalently enter the load directly using complex notation:
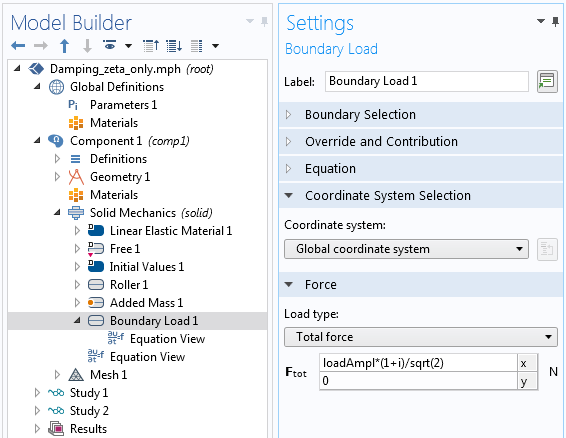
Complex representation of the same load as above.
The possibility to prescribe the phase angle is important when not all loads are in phase with each other. A rotating unbalanced mass can, for example, be described conveniently by giving the load in the y direction a 90° phase shift with respect to the load in the x direction.
Results from a Perturbation Study
If the study is of the perturbation type, there will actually be two sets of results: the prestress solution and the perturbation solution. In this case, you will, in the various result presentation features, get access to an extra selection: Expression evaluated for.

Selecting the evaluation type for a perturbation analysis.
Here, you can choose to study the perturbation solution, the prestress solution, or combinations thereof. For the perturbation solution, you also get one more option: the Compute differential check box.

Selecting Compute differential.
This setting affects how nonlinear expressions are treated. When Compute differential is not selected, then a nonlinear quantity is taken at face value. For example, the expression u^2 will simply take the square of the variable u from the perturbation solution. Since u is, in general, complex-valued, this will usually be a nonsensical operation.
When Compute differential is selected, then the nonlinear quantity will be linearized around the prestressed state. The expression u^2 will evaluate to 2*u0*u, where u0 is the value at the linearization point.
Converting Frequency-Response Results to the Time Domain
There are some situations in which you may want to actually visualize the harmonic response from a frequency-domain analysis in the time domain. In particular, this is true if you have multiple excitation frequencies.
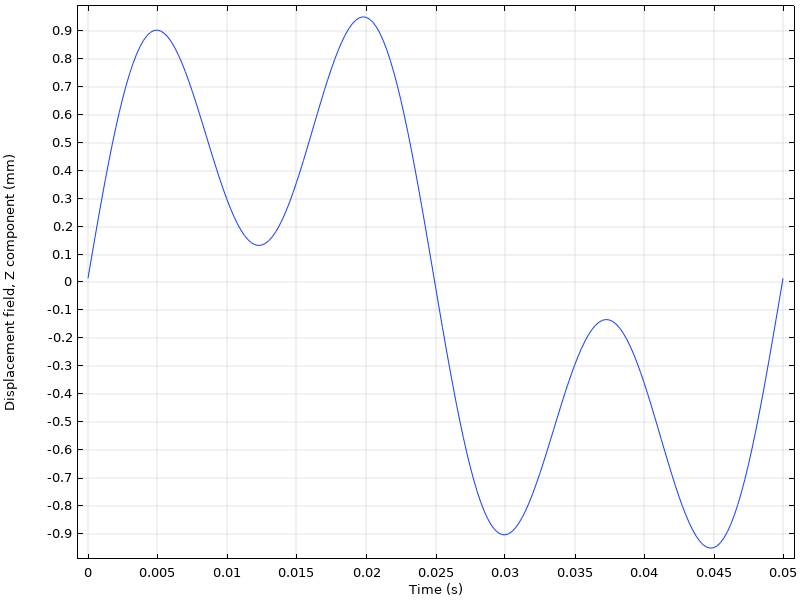
Response to the excitation of two loads with different frequencies.
You can transform frequency-response results to the time domain using the Frequency to Time FFT study step.
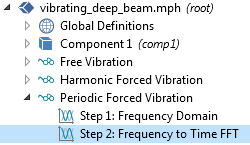
Study sequence for transforming results from the frequency domain to the time domain.
This technique is used in the following tutorial models:
Concluding Remarks
Frequency-domain analysis is a powerful tool for analyzing linear systems subjected to harmonic excitation. Actually, by performing an initial Fourier transform of the loading, any type of periodic excitation can be studied using frequency-response analysis.
There are many more examples of mechanical frequency-response analyses available in the Application Gallery, such as:


Comments (5)
志城 汪
December 14, 2019In the analysis of structural ground motions, is it possible to perform analysis in the frequency domain? If so, how should we input seismic waves?
Henrik Sönnerlind
December 16, 2019 COMSOL EmployeeHi,
In frequency domain, you have access to Prescribed Displacement, Prescribed Velocity, and Prescribed Acceleration to specify a harmonic base excitation. Frequency domain analysis does however assume a steady-state harmonic excitation, and that will usually not be the case for seismic waves.
Regards,
Henrik
志城 汪
December 21, 2019Thank you, I also found this problem, It can’t perform a analyze in frequency domain and time domains at the same time. Then if I want to analyze the effect of a constant acceleration to the structure in the frequency domain, the structure have two parts, one is modeled by the PDE module and the other is modeled by the structural mechanics mudule. Can the PDE module and the structural mechanics module be used at the same time?
yours sincerely,
Zhicheng Wang
amr elgendy
June 7, 2020Hi sir,
i want to transform my solution from frequency domain to time domain at the same study for monitoring my diagrams (electric field, pointing power) in time domain, further more i use “Electromagnetic waves frequency domain” study and i tray to use frequency to time FFT and my solution didn’t achieved
finally a kind help shall be appreciated.
Jiyoun Munn
June 8, 2020 COMSOL EmployeeYou can review this blog regarding the high frequency electromagnetics and FFT:
https://www.comsol.com/blogs/rf-signal-transformation-between-the-time-and-frequency-domains/
Please contact the technical support for any further information. https://www.comsol.com/support