
Ray tracing is an effective tool for high-frequency optics simulations. The Ray Optics Module for the COMSOL Multiphysics® software uses a multiphysics-capable wavefront method for its ray tracing. In this blog post, we’ll explore what makes the ray-tracing algorithm in COMSOL Multiphysics distinct from traditional ray-tracing algorithms described in standard geometrical optics textbooks and suggest a series of best practices to help you get the most out of your simulation results.
Sequential, Nonsequential, and Exact Ray-Tracing Algorithms
Ray-tracing algorithms can be categorized as sequential and nonsequential methods. The ray-tracing method used in the Ray Optics Module can be categorized as a nonsequential wavefront method.
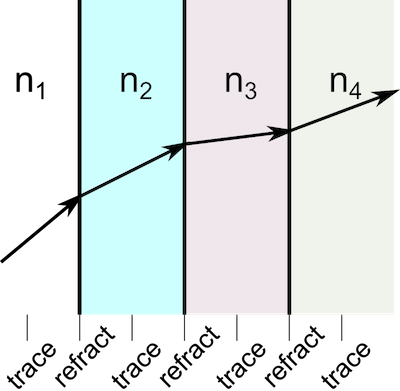
Ray tracing through an optical system largely takes place in two alternating steps, regardless of the details of the algorithm being used:
- Given an initial position and ray direction, either at a point on an object or on a surface in the optical system, the ray-tracing algorithm determines where the ray will hit the next surface and trace the ray to that point.
- The algorithm then continues by adjusting the ray direction by means of applying a boundary condition, such as reflection or refraction, where the ray hits a surface. This changes the direction of the reflected or refracted ray and prepares it to be traced through subsequent media.
Even in complex systems with a large number of surfaces, the entire ray-tracing process can usually be broken down into successive iterations of these two steps, as shown below.
Several sequential ray-tracing algorithms are described in some of the standard texts on geometrical optics (see, for example, Refs. 1, 2, and 3). By sequential ray tracing, it is meant that the order of the rays or mirrors to be encountered by the ray is specified as an input to the ray-tracing algorithm; in other words, you know that the ray will first pass through lens 1, then lens 2, and so on, but you don’t know exactly where the ray will pass through each lens surface or what the angles of the reflected and refracted rays will be.
In a nonsequential ray-tracing method, the order in which the rays encounter lenses and mirrors is not specified beforehand. Instead, you specify the light source and the method will automatically determine the interaction between the rays and the optical components in the system.
Some important sequential ray-tracing algorithms make use of paraxial approximations and assume that the angles between rays and the optic axis are small. In contrast, certain sequential and nonsequential ray-tracing methods can be classified as exact methods (1, 2, 3) in that the shape of the lens is taken into account when predicting the intersection point of the ray with the lens surface, and the paraxial approximation is not used. Thus, rays intersect the actual surface of a curved lens, not the vertex plane.
In exact analytical ray-tracing methods, the intersection point of the ray with the surface of a lens or mirror is computed by solving an algebraic equation. For example, if the surface of a lens is spherical, then given the initial position and direction of a ray, its intersection point with the surface of the lens can be computed exactly by solving a quadratic equation. For more elaborate, nonspherical surfaces, the equation for the intersection point of the ray with the surface might not have a closed-form analytic solution and may require a numerical approach.
In the following discussion, we’ll compare the approach used in the COMSOL® software to the exact ray-tracing method described above. We’ll ignore the simpler methods of paraxial optics, because ray tracing in COMSOL Multiphysics always uses the full implementation of Snell’s law and never uses the small-angle approximation.
Homogeneous vs. Graded-Index Materials
Many traditional ray-tracing methods require that each material is homogeneous; that is, the refractive index has zero gradient in each medium and only changes discontinuously at boundaries. An approach based on algebraically solving for the intersection point with the next lens, as described above, only works for nongraded media. This is because the rays in graded-index media can be curved, so the ray’s initial position and direction are not sufficient to determine where it will intersect a surface.
Real-world optical systems may have components with graded-index, or heterogeneous, materials either by design or due to multiphysics effects. Examples of graded refractive index distributions by design include the Luneburg lens, Maxwell’s fish-eye lens, and GRIN lenses fabricated by electrophoresis. A lens subject to an environment with nonuniform temperature distributions will inadvertently have a graded refractive index due to the material properties being dependent on temperature and strain. These are some of the most important cases for which the wavefront method excels.
An example of a ray path in a heterogeneous medium is shown in the following plot. In the image, the thermal color table shows the temperature in the modeling domain, with lighter colors corresponding to higher temperatures. The change in the refractive index is proportional to the change in the temperature, so the ray path becomes more noticeably curved where the temperature gradient is largest. The color along the ray path shows the instantaneous group velocity magnitude of the ray, with the greatest magnitude shown in red and the lowest magnitudes in blue and violet. This simulation, exaggerated for demonstration purposes, conceptually depicts what happens in pumped laser crystals in laser systems.
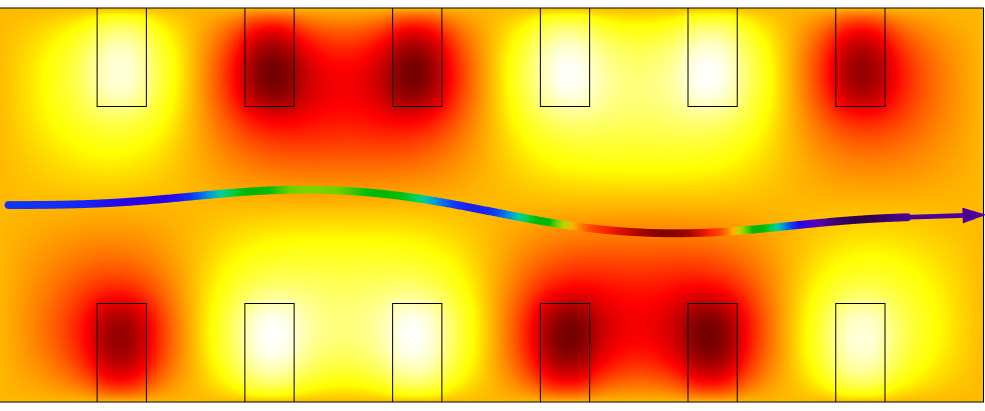
A single ray follows a curved path (exaggerated) through a heated material.
The Wavefront Ray-Tracing Method
The ray-tracing method in COMSOL Multiphysics numerically solves a set of coupled first-order ordinary differential equations (ODEs) for the components of the instantaneous ray position q and wave vector k. These coupled equations are analogous to the Hamiltonian formulation in classical mechanics,
where the angular frequency ω takes the place usually occupied by the Hamiltonian H (Ref. 4).
When the refractive index is homogeneous, the Hamiltonian formulations above are reduced to the expressions that account for a constant speed and ray direction of light, as follows:
When there is a discontinuity of the refractive index at an interface, COMSOL Multiphysics numerically computes the direction of the refracted ray using Snell’s law. This formulation makes it possible for the COMSOL® software to compute not only special cases with homogeneous refractive indices, but also more general cases such as thermal lensing in laser engineering (both straight rays and curved rays). Note that this is a time-stepping method and the results show the rays at different instances of time during propagation.
Discretization of Surfaces and Geometry Shape Order
As an example of a geometric shape, consider a rotationally symmetric aspheric lens surface sag described by the following analytical expression:
(1)
Here, z, \ c,\ k, \ A_i \ (i=1,2,\cdots) are the lens surface sag, curvature, conic constant, and the coefficients for the even polynomials, respectively; and r^2=x^2+y^2, where x and y are the two directions transverse to the optic axis.
In COMSOL Multiphysics, lenses and mirrors can have their shapes be input as analytic functions or as full-fledged 3D CAD models. Analytically given shapes are entered as parametric curves or surfaces and are approximated by high-order nonuniform rational spline (NURBS). In the next step, the surfaces (or curves) are approximated with a finite element mesh, which further approximates the shape using polynomials.
In the user interface, the maximum order of these polynomials is determined by the Geometry shape order in the Settings window for the model component. The accuracy of these approximations can be increased by refining the mesh and/or increasing the geometry shape order. The rays then interact with the individual mesh elements for the purposes of predicting intersection points and applying Snell’s law.
The default option Automatic for the Geometry shape order in most cases approximates surfaces using quadratic polynomials, although linear shape order is sometimes used to avoid creating inverted mesh elements. For most applications, the order can be increased by the user to 7th-order (Septic) polynomials.
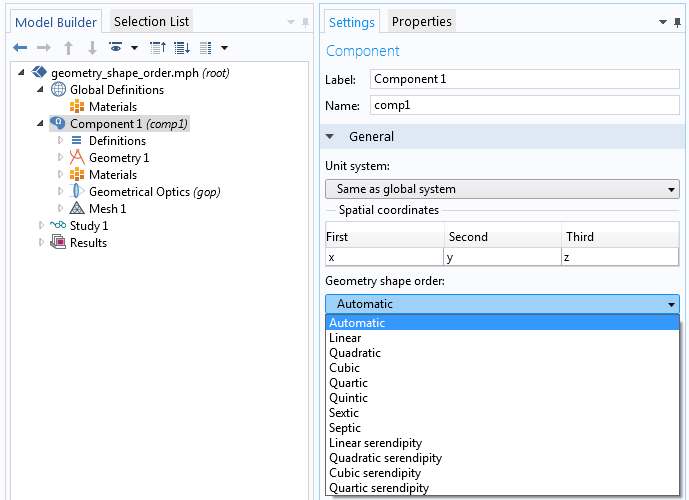
Settings window for geometry shape order.
Let’s now consider an aspheric lens, the shape of which was described earlier. To make it easier to see the discretization, the lens is here meshed extremely coarsely. In the figures below, the linearized mesh elements are indicated by gray lines, while the numeric representation of the curved surface is shown as a black outline.
The left figure is a ray-tracing result for the default (Automatic, i.e., mostly quadratic) setting and the right figure is for the case of Linear geometry shape order. The color of the rays represents the y-component (vertical axis) of the wave vector. You can see where rays get refracted by looking for the position where the color changes. In any choice of geometry shape order, the surface shape can no longer be written by the above aspheric surface formula; i.e., it’s a collection of piecewise continuous polynomials whose order is governed by the Geometry shape order setting.
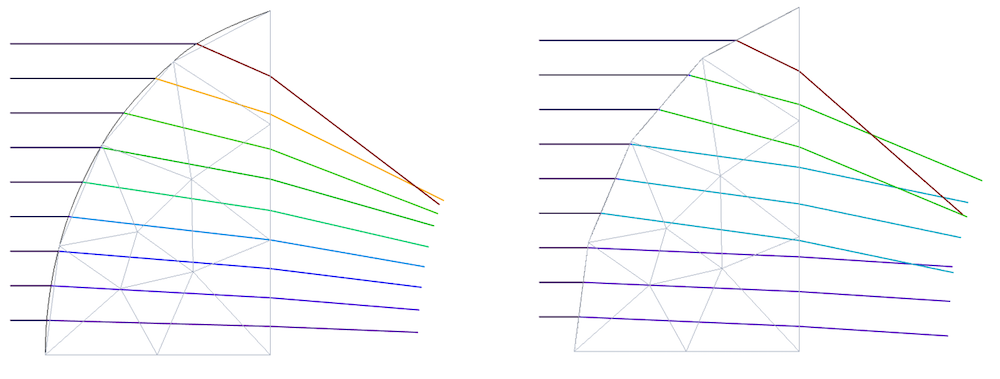
An aspheric lens surface and its approximate surface shape using quadratic (left) and linear (right) geometry shape order.
Rays and the Finite Element Mesh
There are several reasons why the ray-tracing algorithm in COMSOL Multiphysics uses the finite element mesh to reflect and refract rays at surfaces. As previously mentioned, this emphasizes the COMSOL® software’s strength as a multiphysics simulation tool by making it possible to trace rays through graded-index media where the refractive index distribution is a function of a field computed by another physics interface. Another situation where an analytic expression for the lens surface may not be available is when the surface is deformed as a result of thermal expansion or due to other external forces on the lens. In conclusion, almost any physics coupled to the optical system is modeled using the finite element method, so the coupling takes place through a finite element mesh.
Because the ray-tracing algorithm uses the finite element mesh, a minimum requirement for ray tracing in COMSOL Multiphysics is that all boundaries that reflect or refract the rays must have a boundary mesh. The boundary mesh elements are used to compute surface properties such as the normal direction and the principal radii of curvature that are needed when the rays are reflected or refracted. The boundary mesh also provides information to a mesh search algorithm that predicts the instant when rays will reach the boundary, allowing the quantities that are computed along ray paths, such as intensity and phase, to be computed more accurately.
In some cases, the domains that the rays propagate through should also have a domain-level finite element mesh. For example, domains containing a graded-index medium must always be meshed. If the refractive index is temperature dependent, then in order to compute the refractive index at the ray’s instantaneous position in the medium, it is necessary to query a value from the temperature field. The temperature can be interpolated at the ray’s exact location within a mesh element using the finite element basis functions defined in that element. Then, this temperature value can be substituted into a temperature-dependent expression for the refractive index.
A domain-level mesh is also required when the rays propagate in an absorbing medium. The deposited ray power in the medium is discretized using piecewise discontinuous functions that are defined on the mesh elements, so the mesh is necessary to confine the contribution of each ray to the total heat source to a region of finite extent.
How Mesh Resolution Affects the Solution
So far, we’ve learned that ray tracing in the COMSOL® software is an approximate solution that treats each surface as a piecewise continuous polynomial based on the finite element mesh. Therefore, the accuracy of the solution depends on the resolution of the mesh. Higher geometry shape order and finer meshes reduce the discretization errors. In the right plot of the previous figure, some rays pass through the same boundary element, which spuriously results in the same wave vectors (lines with the same colors). This is one type of approximation error that we can visibly see when the geometry shape order is low and the mesh is very coarse.
The following plots show the y-component of the unit wave vector of the refracted rays after the first refraction by the same lens in the previous example. The horizontal axis represents the initial ray position in the y axis. The error introduced by an underresolved mesh is most significant when the geometry shape order is linear.

Plots of the y-component of the unit wave vector for quadratic geometry shape order (left) and linear shape order (right) with different mesh element sizes (shown by different colors).
The Effect of Mesh Refinement on Spot Diagrams
We’ve seen that the level of mesh refinement affects the accuracy of the ray trajectories, so it should come as no surprise that it also affects the accuracy of spot diagrams. Results from exact ray-tracing methods usually show near-perfect symmetry and continuity if the distributions of initial ray positions and directions are symmetric and regular. The spot diagram for an aspheric lens is always symmetric around the optical axis and the ray aberrations are always smooth and continuous. For the finite-element-based wavefront method, the results will only be symmetric if the mesh inherits the symmetry of the original lens geometry.
Even for symmetrical optical systems with symmetrical initial distributions of ray position and direction, ray-tracing results in COMSOL Multiphysics can give you slightly unsymmetric results if the mesh is unsymmetric. But these deviations from symmetry will gradually be reduced as the mesh is refined, since the smaller mesh elements on either side of the symmetry plane converge toward the same representation of the surface. This is just another manifestation of the mesh discretization error. The symmetry of the solution can be improved by using a structured mesh. However, it should be noted that a symmetric solution doesn’t necessarily mean that the solution is more accurate.
The next figure shows the effect of the maximum mesh element size on the spot diagram and a plot of the RMS spot radius for a plano-convex lens. This focusing lens is designed to have a diffraction-limited spot. You can see how the RMS spot radius converges to a certain value as the mesh size drops as expected. Let’s take a closer look. The spot for the coarsest mesh is larger than the diffraction limit. It is also very asymmetric and the intersection points are distributed over a very large area. This mesh size doesn’t look particularly bad for other physics like heat and mechanical problems. However, for ray tracing with the default Automatic geometry shape order, this mesh is too coarse to produce an accurate spot diagram. Only the last two mesh sizes give a concentrated and symmetric-looking spot.
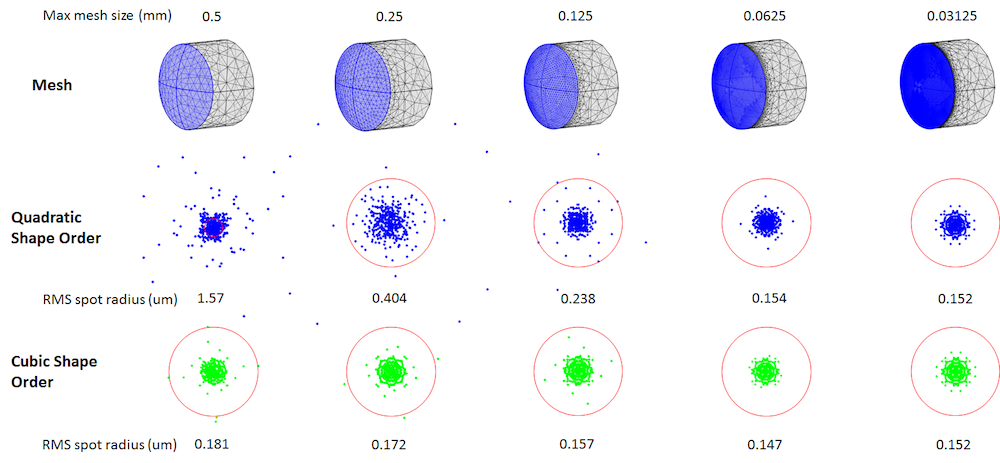
Comparison of spot diagram at the focus between quadratic and cubic geometry shape orders depending on the max mesh size. The red circles show the diffraction limit size for the lens at the wavelength of 0.66 um.
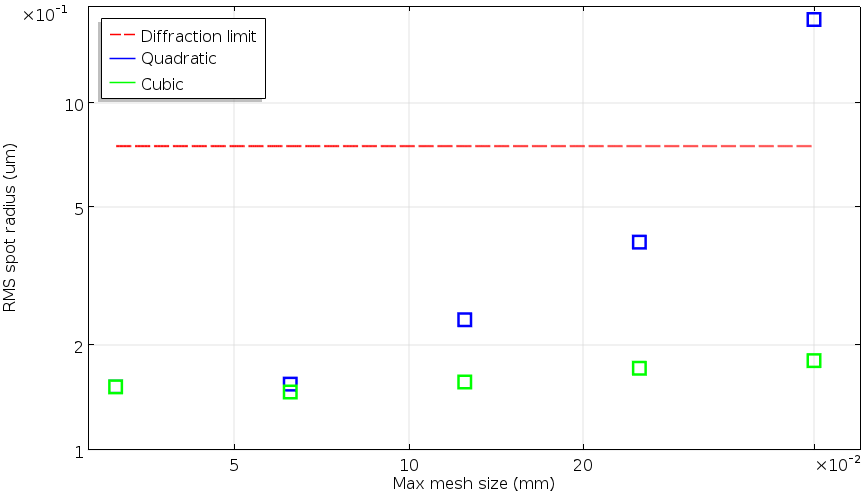
Log-log plot of the RMS spot radii as a function of the max mesh size for quadratic and cubic geometry shape order compared to the diffraction limit size.
Interpreting the Solution Data Generated by the Ray-Tracing Method in COMSOL Multiphysics®
Let’s now have a look at how the format of the solution data may differ from that of the traditional (stationary) analytical ray-tracing algorithms described above.
The following is an example that compares the time-dependent solution obtained in COMSOL Multiphysics to the typical output from the standard sequential ray tracing plane-to-plane method for the same focusing lens in the previous example. A plano-convex lens focuses rays into a spot. In the familiar results from the conventional plane-to-plane method, all of the rays are drawn to the end plane. On the other hand, in COMSOL Multiphysics, each ray is drawn to be at the position where the ray is supposed to be at the specified time step. So, in general, the rays are not laid in the same plane.
This is why ray trajectory results in COMSOL Multiphysics almost always show some curvature. This curvature is nothing but the wavefront in terms of the geometrical optics regime. In the example, the wavefront is curved by the quadratic phase function that the lens introduces to the rays. To draw all rays to the end plane, use a later solution time so that all rays have had sufficient time to reach the plane and stop propagating.
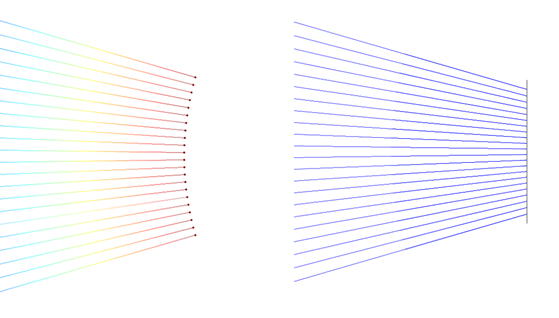
Simulation results for time-dependent ray tracing in COMSOL Multiphysics® (left) and the standard sequential plane-to-plane ray tracing (right).
While it’s convenient to see raw wavefronts, we need to make sure that all of the rays we simulate have passed the plane in which we want to evaluate a quantity. The following sequential spot diagrams illustrate a spot diagram for the above example at different solution times. In COMSOL Multiphysics, spot diagrams are generated using the Poincaré Map plot type. Because the wavefront is converging, outer rays arrive at the plane first and inner rays come after. Thus, in-plane evaluations may vary depending on the time we choose.

Spot diagrams generated at different solution times.
To make sure that we evaluate all rays in the plane we are interested in, COMSOL Multiphysics is equipped with operators called attimemin and attimemax. For example, the following expression gives the RMS spot radius in the yz-plane at x = 0.1 m:
sqrt( gop.gopaveop1( attimemin(0,0.4[ns],(qx-0.1[m])^2, qy^2+qz^2) ) )
The operator gop.gopaveop1() takes the average of the expression in parentheses over all rays. The argument to this operator,
attimemin(0,0.4[ns],(qx-0.1[m])^2, qy^2+qz^2)
calls the attimemin operator, which takes four arguments.
The first two arguments of attimemin define the beginning and end of the time period in which we want to compute the minimum value of an expression. We have to make sure that the time when the ray crosses the plane is in this range. The third argument is the expression to minimize. At the time when the minimum value of this third argument is detected for the ray, the value of the fourth argument is returned. The attimemin operator uses interpolation between the stored solution times, so it is possible to accurately get the intersection point of each ray with the plane even if this intersection point doesn’t coincide with a time step stored in the solution.
In words, the previous expression might read:
“Compute the square root of the average over all rays of the value of the radial coordinate at the time between 0 and 0.4 ns for which the ray’s distance from the plane x = 0.1 reaches a minimum.”
The next example shows how the storage of the solution at discrete time steps can affect the trajectory plots when rays are reflected or refracted at boundaries. We usually don’t know in advance the exact time or optical path length at which each ray will interact with each surface, so these intersection times will usually not coincide exactly with the stored solution times. As a result, the COMSOL Multiphysics ray-tracing results show some small incompleteness in the trajectories near an interface or a reflective wall, as shown in the figure below where rays seem to change direction a short distance away from the boundary instead of exactly on it. However, this is expected for this type of time-dependent ray-tracing method and does not affect the accuracy. Even if a ray doesn’t look like it’s hitting an interface or wall in the results, the COMSOL® software computes an accurate interaction time for each ray, typically using a second-order Taylor method to extrapolate the ray position from the previous stored solution time.
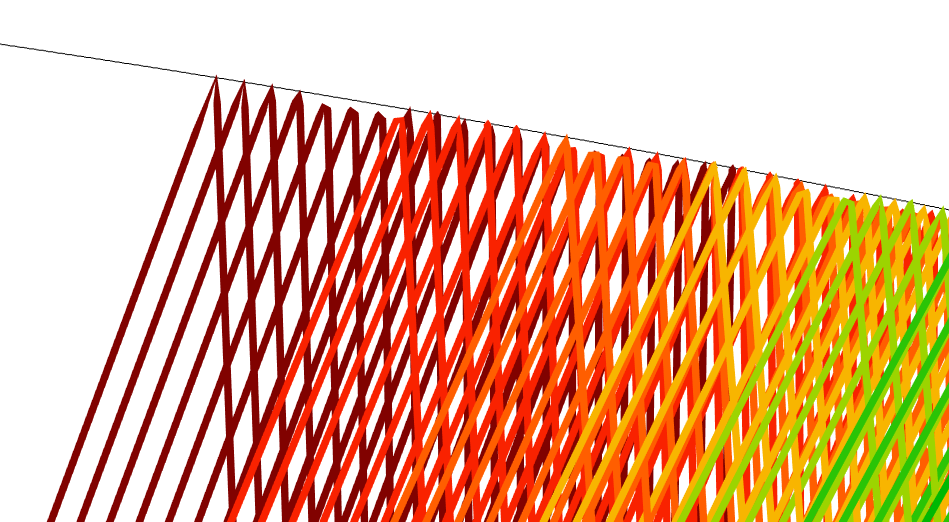
Reflection of rays at a reflective wall. Not all of the rays are snapped to the wall in the plot, but all ray trajectories are accurately computed.
Concluding Remarks
In this blog post, we have discussed the unique time-dependent and mesh-based method used in COMSOL Multiphysics for ray optics simulations. We also went over what types of anomalies you might encounter in the ray-tracing results, especially when the time step is large and the mesh is coarse. As in other physics interfaces, refining the mesh or improving the resolution in time can clear up these unusual-looking behaviors and yield an accurate, converged solution.
Further Resources
Learn more about the ray optics and ray-tracing capabilities of COMSOL Multiphysics on the COMSOL Blog:
- Using the New Ray-Tracing Algorithm in COMSOL Multiphysics 5.2a
- Modeling Thermally Induced Focal Shift in High-Powered Laser Systems
- How to Model Solar Concentrators with the Ray Optics Module
References
- R.R. Shannon, The Art and Science of Optical Design, Cambridge, 1997.
- D.C. O’Shea, Elements of Modern Optical Design, Wiley, 1985.
- R. Ditteon, Modern Geometrical Optics, Wiley, 1998.
- L.D. Landau and E.M. Lifshitz, The Classical Theory of Fields, 4th ed., Butterworth-Heinemann, Oxford, 1975.


Comments (4)
Ivar KJELBERG
June 20, 2017Hi Yosuke
Thanks for a nice BLOG. It is indeed very important to stress the difference between the time solving of the rays “à la COMSOL” and the traditional geometrical ray tracing, I would say one learn more with the COMSOL approach. And once used to it, you end up preferring it (at least I do ;).
Now, I do have a very hard time to “sell” COMSOL ray tracing results to though skilled optical engineers for my advanced optomechanics projects (or lectures), as this way of time tracing is unconventional, and people think and judge by their trained in habits (the human factor in information exchange).
Therefore, I can only stress out that even if the natural way of COMSOL is to have time step trajectory plots, you really need to provide us easy ways to display the results (purely post-processing) in the traditional optical Geometric Ray Tracing way.
Only by this means we will manage to show the usual spot and aberration diagrams to the trained optical engineers we work with, and then we can show them the advanced time responses, that allows us to show more detailed results, but only AFTER we have convinced our clients that we know what we are doing (=showing similar results as they are used to see).
COMSOL is an advanced tool that takes new approaches, that is good and mandatory, and give us new light and means to understand Physics, absolutely great.
But we need to keep track that to “sell” (we our project results, and you your tool) any results we need to convince our respective customers that we are giving them results they understand and are used to see.
So PLS boost even more your postprocessing means in COMSOL to allow us to very quickly and easily, without extra equations and twiddling, show “standard” optical diagrams, aberrations traces etc in the “classical textbook way” (spatially based), in addition to your time-wave front traces.
Thanks for your attention
Sincerely
Ivar
Yosuke Mizuyama
June 20, 2017 COMSOL EmployeeDear Ivar,
Thank you for reading this blog and thank you for your comment.
Yes, I think your opinion is very reasonable and important.
We will keep improving our Ray Optics module.
Best regards,
Yosuke
Matiewos Mekonen
June 25, 2018Dear Yosuke Mizuyama!
it very amazing work and this is my first time to join with my account to COMSOL Multiphsics . Hence, I wonderful with this powerful modelling tool.
Dear Yosuke, can I use COMSOL Multiphsics to model solar thermal storage of the specific site beginning from the modelling of parabolic dish reflector, thermal receiver, HTF pipe and thermal storage using the geographical location data consequentially?
Yosuke Mizuyama
June 25, 2018 COMSOL EmployeeDear Matiewos,
Thank you for reading my blog. I’m sorry but I’m afraid I’m not familiar with what you described. Please don’t hesitate to ask our support if you have more specific questions.
Best regards,
Yosuke