Wet chemical etching is used to form patterns on surfaces, with applications including the production of integrated circuits, MEMS devices, and pressure sensors. This process has been around for hundreds of years, and was a favorite method of Old Master Rembrandt van Rijn. The optimization of chemical etching was historically a matter of trial and error, but in this blog post, we’ll show how to model the process in the COMSOL Multiphysics® software.
How Does Wet Chemical Etching Work?
Some surfaces etch when exposed to solutions containing certain corrosive chemicals (etchants), such as acids. When exposed, these surfaces begin to dissolve. However, if the surface is painted with a material that does not corrode when exposed to the solution, patterns can be formed on the surface. The painted areas then stand in relief, allowing complex patterns to be created without the need for mechanical operations such as engraving with tools harder than the material.
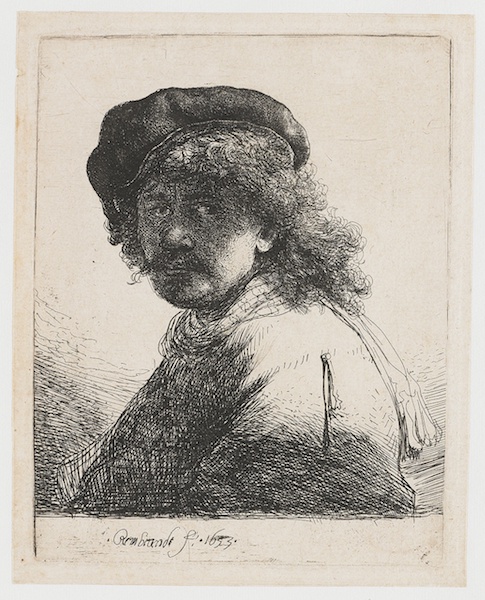
Historically, the method was especially important in printmaking. An artist would simply coat a copper plate in wax (a “mask”), remove certain parts of the wax to create a pattern, and then expose the plate to an acidic solution. The exposed parts then corroded, or “etched”, which would create grooves in the surface. After removing the wax, ink was spread over the plate and wiped off so that only the grooves contained ink. The plate could then be used to print copies of the original motif on paper. This is the method that Rembrandt would use, often in combination with engraving, to create works such as some of his famous self-portraits.

A self-portrait by Rembrandt van Rijn, printed off a plate prepared using wet chemical etching. Image in the public domain via Wikimedia Commons.
While the final results of industrial wet chemical etching are more prosaic than the works of the old masters, the fundamental principle remains the same.
Implementing a Model for Wet Chemical Etching in COMSOL Multiphysics®
Using COMSOL Multiphysics, the key physical processes involved in wet chemical etching can be described quantitatively:
- Mass transport of etchant toward the surface
- Hydrodynamics of the etching solution
- Surface reactions resulting in growth of grooves
- Change in geometry due to the etching process
The Chemical Etching tutorial model focuses especially on mass transport and describes the surface reaction as a flux of the etchant into the surface, where it is consumed in the etching reaction. The 2D model simulates etching of a groove in a copper surface exposed to a CuCl2 solution. The solvent is assumed to be liquid water, using data for dynamic viscosity and density from the built-in Material Library in COMSOL Multiphysics. The mass transport of CuCl2 is described by coupling a Laminar Flow interface with a Transport of Diluted Species interface. By doing so, both convective and diffusive transport of the CuCl2 etchant is simulated. This is achieved by solving the following equations:
where u is obtained by solving the Navier-Stokes equations for laminar flow:
together with the continuity equation:
The surface reaction rate is coupled with a Deformed Geometry interface so that the reaction causes a change in the geometry. The connection is made by converting the reaction rate to a normal mesh velocity using the following equation:
where the ratio of the molar mass of Cu to its density converts the molar reaction rate into a recession velocity for the etched surface as it dissolves. The surface reaction rate Nsurface is first order:
The flux boundary condition for the etchant concentration at the surface is thus
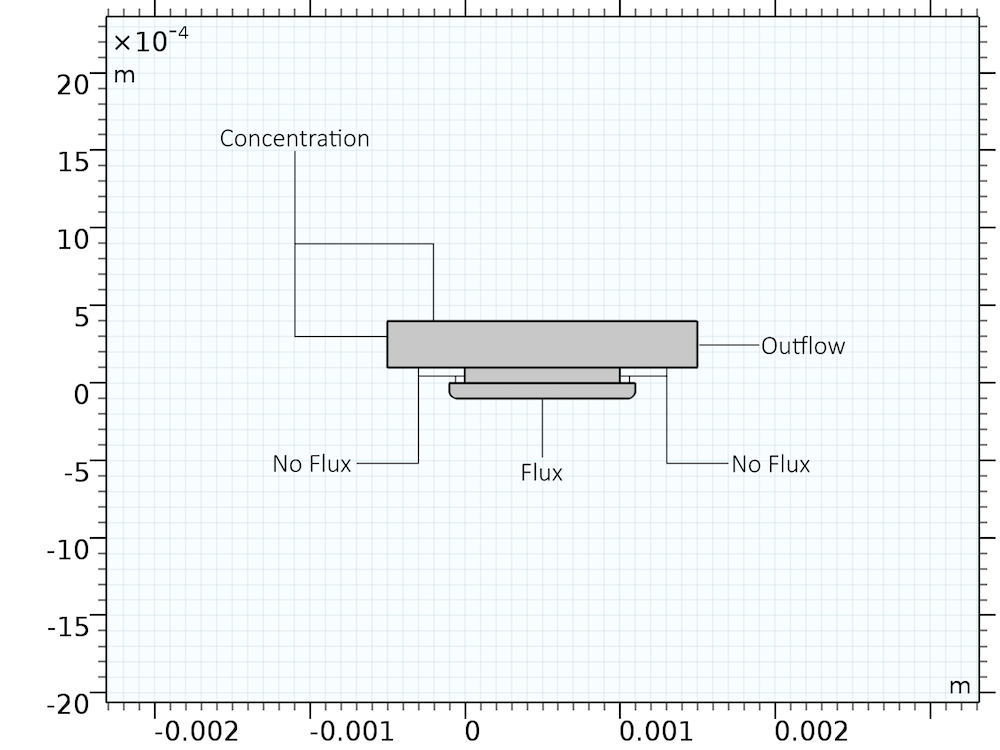
The model assumes a constant bulk concentration of etchant at the left and top edge of the geometry, corresponding to the inflow and bulk solution respectively. The etching process consumes the etchant in the curved groove, which indicates the part of the geometry that is not protected from etching. Due to the concentration gradient, there is a diffusive flux of etchant from the bulk to the etched surface, providing more etchant to the surface so that the etching process can continue.
The geometry and boundary conditions for the system are described in the following figure. Only the boundary conditions for the Transport of Diluted Species interface are shown. The corresponding boundary conditions for the Laminar Flow interface are no slip wall conditions on all boundaries except the left (constant concentration) and right (outflow) boundary. The bulk flow of the etchant solution is generated by setting a translational wall movement velocity of 1 mm/s on the upper boundary.

Boundary conditions (for the Transport of Diluted Species interface) and geometry used to describe the chemical etching process.
By combining these interfaces, the deformation of the surface that is being etched can be simulated over time. (All required parameters are found in the tutorial model file.) The key result is obviously the shape of the groove. The evolution of the shape, and the liquid concentration of CuCl2, is found in the figure below. The evolution is shown for a total etching time of 104 s: just under 3 hours.
The shape evolution of a surface undergoing chemical etching. The colors indicate the concentration of etchant, with blue indicating lower concentrations and red indicating higher concentrations.
Predicting the Etching Behavior
After defining a model for the physics and chemistry of the etching problem, we can proceed to improve the design of the system by changing its parameters. Some questions that can be investigated include:
- Does having an uneven initial groove matter?
- How can a more symmetric etch be achieved?
- How can the etching rate be increased?
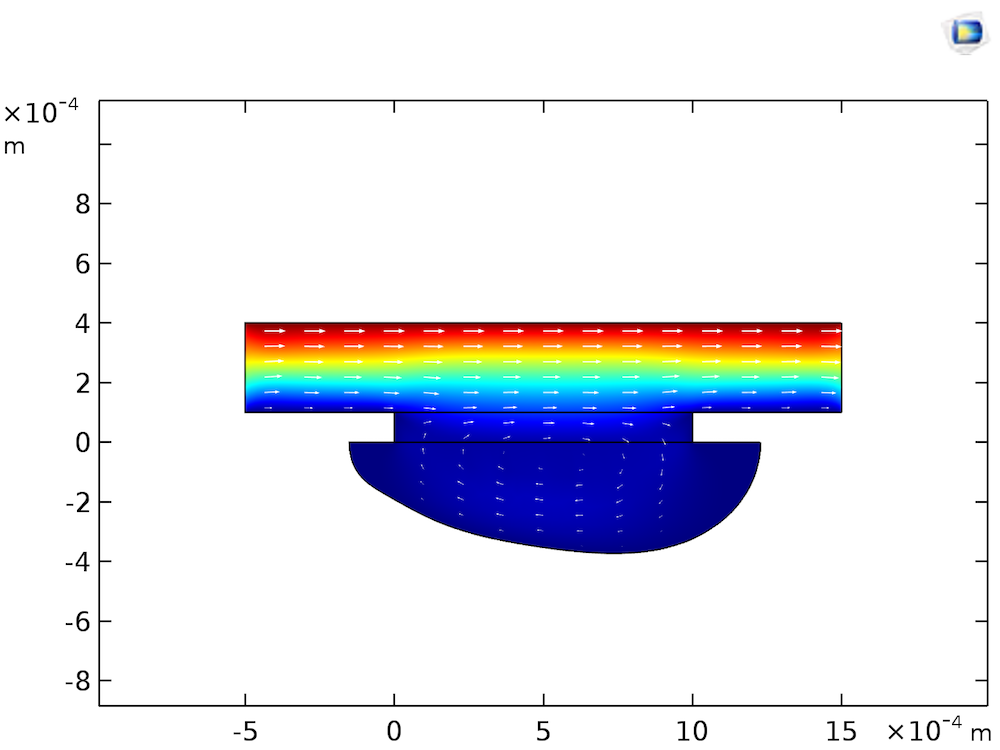
As an example, consider the effect of the fluid velocity at the upper boundary. This velocity describes the presence of a bulk laminar flow. Since the flow direction is toward the right edge of the cell, we obtain the flow profile shown in the figure below:

Flow velocity magnitude (color surface) and velocity field (arrows) at 104 s of etching.
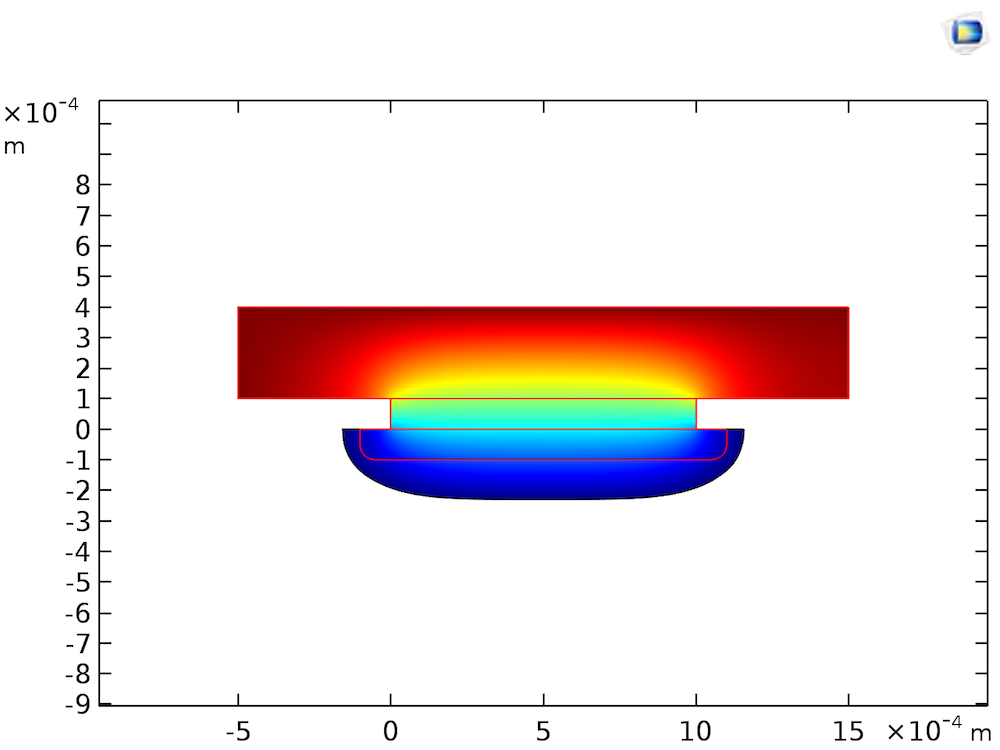
As the etching process is limited by the mass transfer of CuCl2, the flow profile will convect the etchant from left to right, causing a higher rate of etching toward the right edge of the groove than the left. So what would happen if the fluid were completely stagnant? Assuming that the fluid is stagnant means that we ignore natural convection, which will usually cause fluid motion in ambient conditions. Treating the species transport as diffusion-only is acceptable, since we are focusing on processes occurring on the below-mm scale, in the viscous boundary layer close to the Cu surface. The transport of CuCl2 in the stagnant layer would occur only by diffusion, resulting in a slower rate of etching, but a more even groove shape, as shown in the figure below.

The shape of the etched groove after 104 s of etching with a stagnant etchant bath. The surface colors indicate the concentration of etchant, with lower (blue) and higher (red) concentrations. The red lines indicate the original shape.
To increase the etching rate in a stagnant bath, a higher concentration of etchant concentration could be used instead. For an old master, the etching rate would presumably be of less importance than the evenness of the etch.
That fact that a stagnant bath provides for an even and controllable etch, based only on changing the etchant concentration, could perhaps explain some of the popularity of wet chemical etching for small-scale applications as disparate as the creation of artistic works and production of integrated circuit boards on PCBs.
Concluding Thoughts on Wet Chemical Etching
Wet chemical etching is an old process, with applications that range from art to the industrial production of integrated circuits. In this blog post, we’ve seen how to model wet chemical etching in COMSOL Multiphysics, as well as an example of how such a model can be used to understand and improve the etching process.


Comments (0)