
The RF Module minimizes the computational cost for certain axisymmetric resonant structures. For 2D axisymmetric structures excited by a circular port, 3D far-field functions are available for postprocessing. An effective far-field plot is more than a body of revolution of the 2D plot; it’s a more realistic 3D far-field representation obtained from a linear superposition of simulations with positive and negative azimuthal modes. Engineers can meet simulation objectives for these antenna models and scattered field analyses with minimal computational resources.
What Are Far-Field Functions?
Let’s begin by forming a distinction between far-field variables and far-field functions.
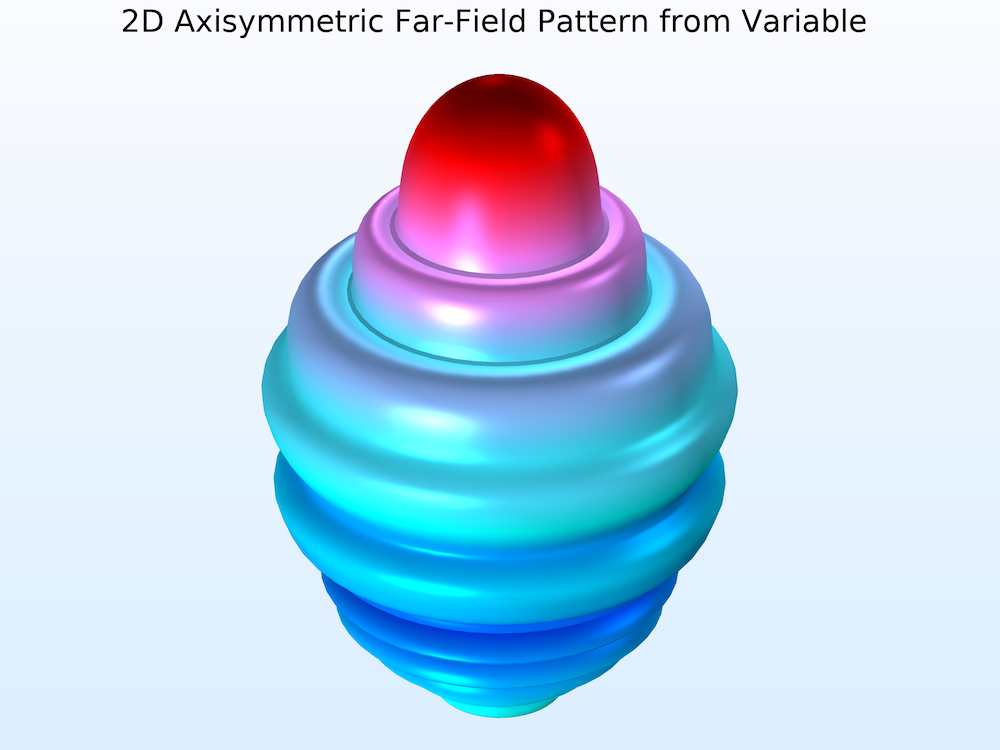
When we plot emw.normEfar, we visualize the far-field variables. The default plot generated in a 2D axisymmetric model is a simple body of revolution of the 2D far-field pattern along the axis of symmetry. This means that, like the geometry, the 3D far-field pattern is also perfectly axisymmetric. This plot is sufficient in providing a sense of the maximum gain and overall directivity of the structure. However, in reality, the 3D far-field is not axisymmetric. When excited by the dominant TE11 mode, which has a nonaxisymmetric mode field, we should also expect a nonaxisymmetric radiation pattern. This is where the far-field functions come into play.
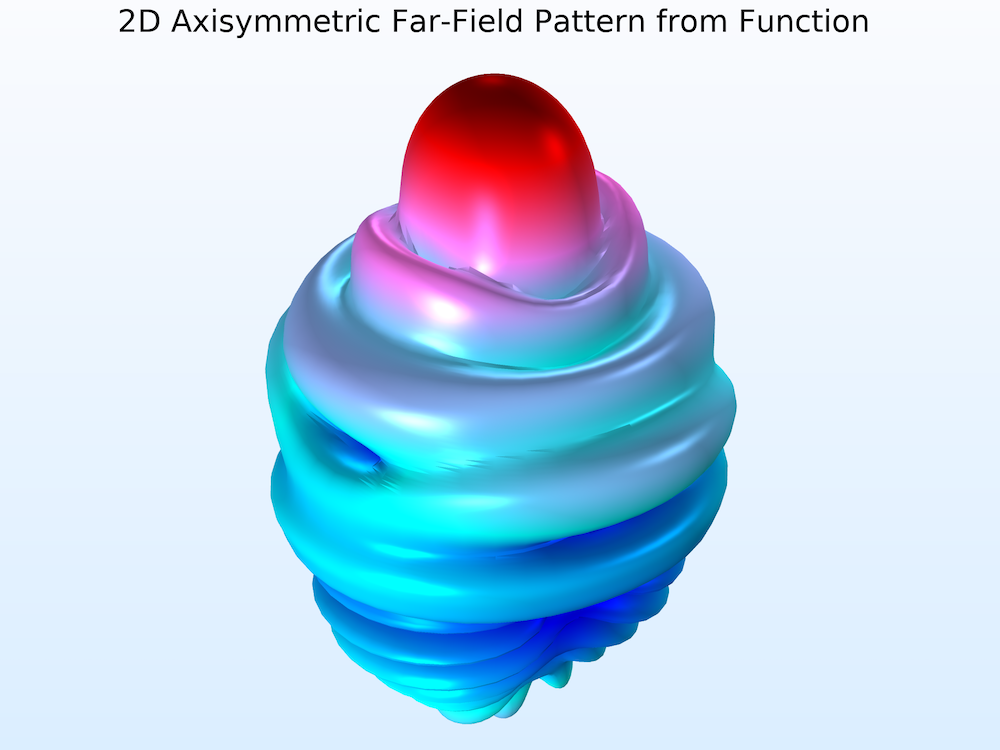
The 2D axisymmetric formulation in the RF Module, an add-on to the COMSOL Multiphysics® software, provides far-field functions for an effective (more realistic) 3D far-field plot. The far-field functions are evaluated as the averaged linear superposition of the positive and negative azimuthal modes (see the RF Module User’s Guide for more details on the formulation).
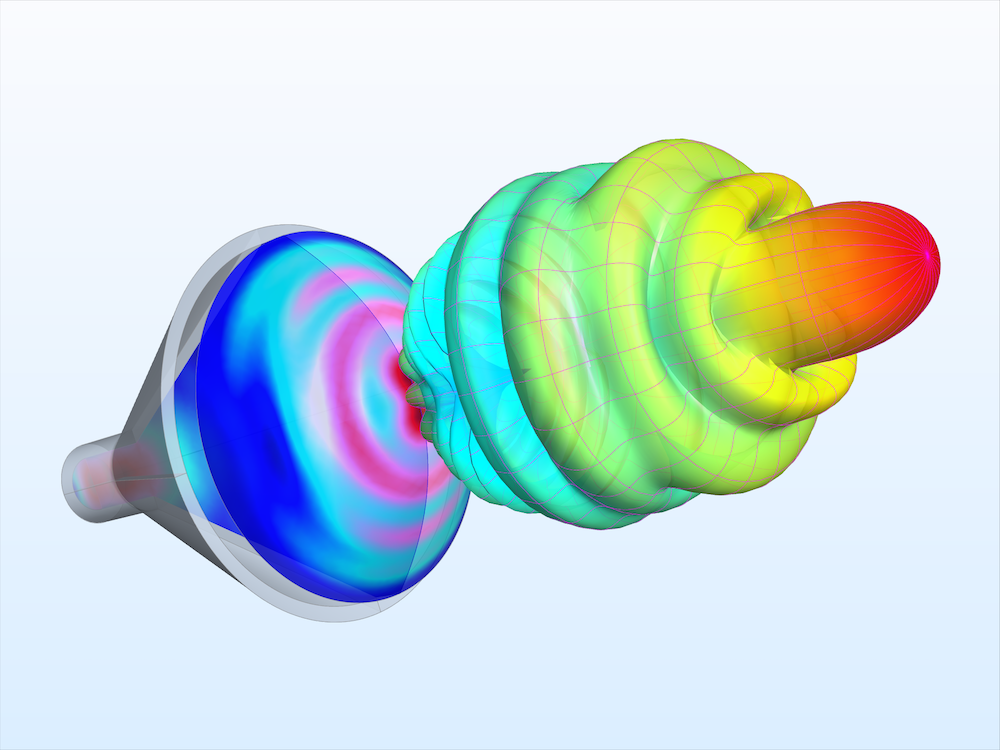
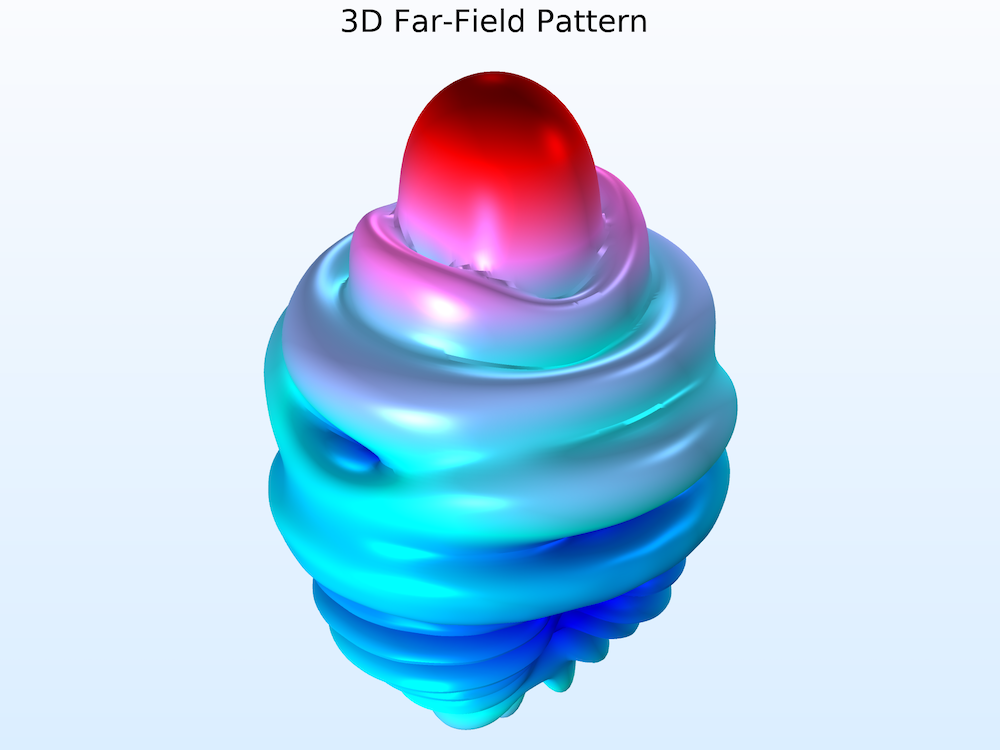
To illustrate just how powerful this feature is, consider the Conical Horn Lens Antenna model from the Application Gallery. This is a 2D axisymmetric model. In the past, running this model would produce a radiation pattern plot on the 2D axisymmetric cross section. This could also be visualized in 3D via a body of revolution about the axis. However, if we wanted to obtain the complete 3D far-field plot, we would need to run the full 3D model.
The Conical Horn Lens Antenna model in the Application Gallery is a 2D axisymmetric model.
The far-field plots shown here are visualized on the dB scale, with values ranging from -15.8 dB to 39.9 dB. The 3D far field is plotted for a 2D axisymmetric geometry using a far-field variable (left). The effective 3D far field is plotted for a 2D axisymmetric geometry using a far-field function. The 3D far-field pattern is plotted after solving on the full 3D geometry (right).
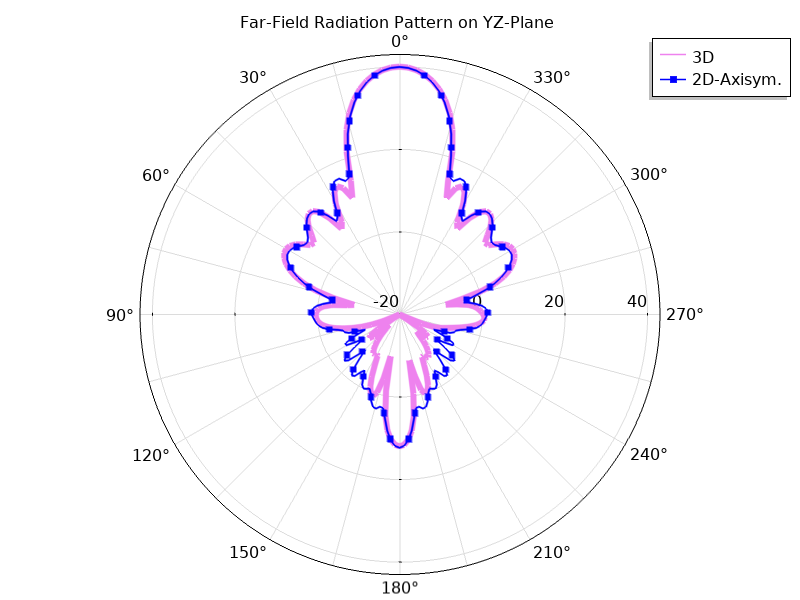
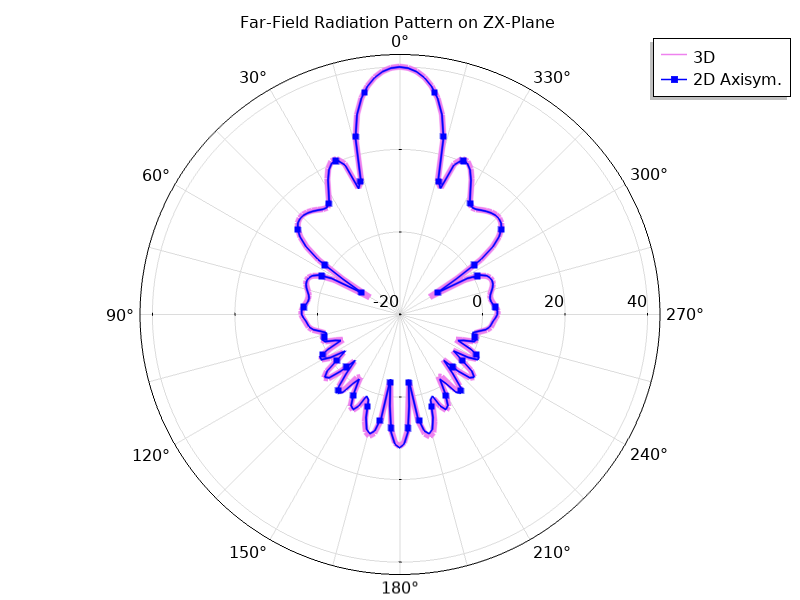
We see that the far-field function plot, available after solving just the 2D axisymmetric formulation, matches very closely to the plot obtained from solving the full 3D model. The difference is that the 3D model has close to 15 million degrees of freedom and may require over 100 GB of RAM to solve. This is quite computationally demanding when compared to the 2D axisymmetric model, which has less than 100 thousand degrees of freedom and 2-GB memory usage. Let’s take a closer look by plotting the far-field patterns for each case on the yz- and zx-planes. Notice that the maximum directivity at the antenna boresight is the same in both cases.
The RF Module’s far-field functions for 2D axisymmetric structures can give RF engineers the information they need at a fraction of the computational cost. Compared to the 3D model, this 2D axisymmetric simulation has less than 1/150 of the number of degrees of freedom and uses less than 1/50 of the RAM.
Far-field function (dB) plotted on the yz-plane (left) and the zx-plane (right). The dynamic range is from -20 to 43 dB for both plots.
Setting Up Ports and the Far-Field Calculation in 2D Axisymmetric Models
Let’s review some important considerations in the physics and Port settings. Currently, the 3D far-field norm functions are available for antenna models containing a circular excitation port. Note that for the functions to be generated, the Azimuthal mode number must be set to a positive number. The first mode index is entered in the settings for the Electromagnetic Waves, Frequency Domain interface, while the second mode index is entered in the settings for Port 1.
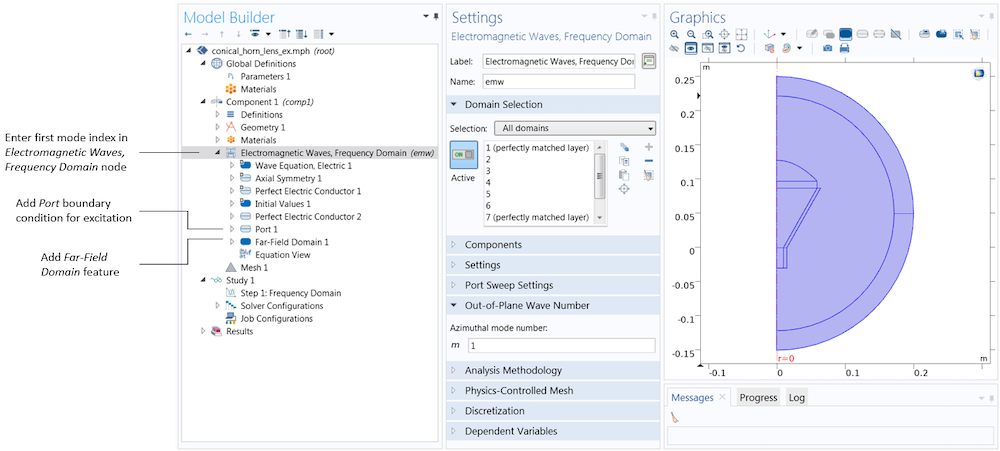
The Electromagnetic Waves, Frequency Domain (emw) interface’s settings contain a text field for the azimuthal mode number, m. After performing the superposition of two simulations with the same magnitude for the positive and negative azimuthal mode numbers, this corresponds to the first mode index of the mode field at the port boundary in a 3D model. The remaining port settings are entered in the Port 1 node. The Port 1 and Far-Field Domain 1 nodes can be added by right-clicking the Electromagnetic Waves, Frequency Domain node in the model tree.
In the settings for the Port feature, we also specify the port type (e.g., Circular) and the mode type (Transverse electric (TE) or Transverse magnetic (TM)). In the Conical Horn Antenna model, there is a single port, excited with the TE1 mode of a circular waveguide. The port lies on an interior boundary, and therefore the Activate slit condition on interior port check box must be selected. This is because, unlike ports on exterior boundaries, interior ports can launch waves in one of two directions. A red arrow appears at the port boundary to help you specify the direction of power flow. To switch the direction, we simply click the Toggle Power Flow Direction button. Once the ports are set up, we only need to add a Far-Field Domain feature for the built-in variables and functions to be generated automatically.
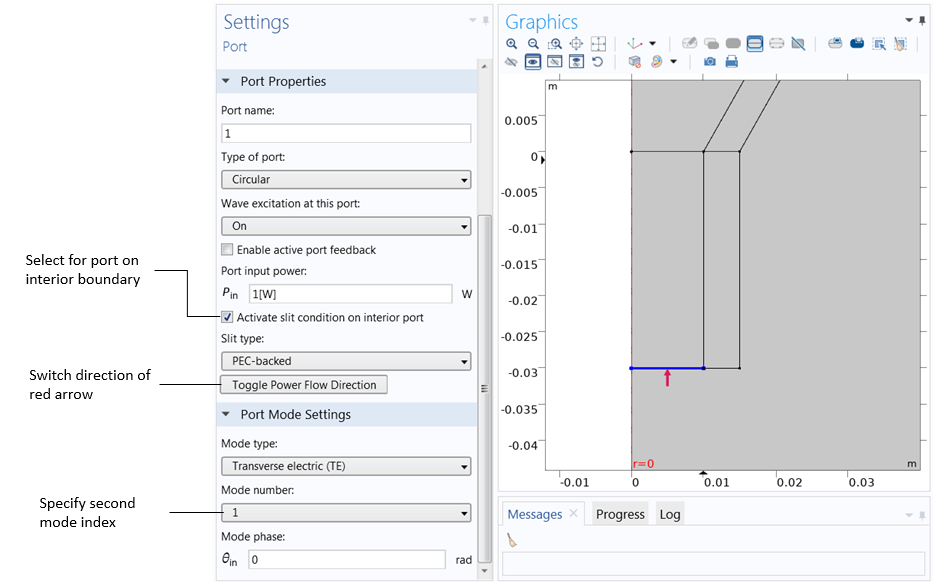
The port type, mode type, and second mode index are entered in the settings for Port 1. The Activate slit condition on interior port check box must be selected for interior ports. The red arrow in the Graphics window shows the power flow direction, which can be switched by clicking Toggle Power Flow Direction.
Plotting Far-Field Functions (2D and 3D) in Postprocessing
The radiation pattern generated by default plots the far-field norm variable; this is the axisymmetric body of revolution case, discussed previously. We can view the more complete 3D radiation pattern by plotting the far-field norm function. The far-field function expressions are found by clicking the Replace Expression button. Upon doing so, a window that lists the available expressions appears. The far-field functions (available under Definitions > Functions) are placed in a separate category from the far-field variables (available under Electromagnetic Waves, Frequency Domain > Far field) so that they are not confused. In addition, the far-field functions will have a unique name, which is generated based on the entries in the physics settings.
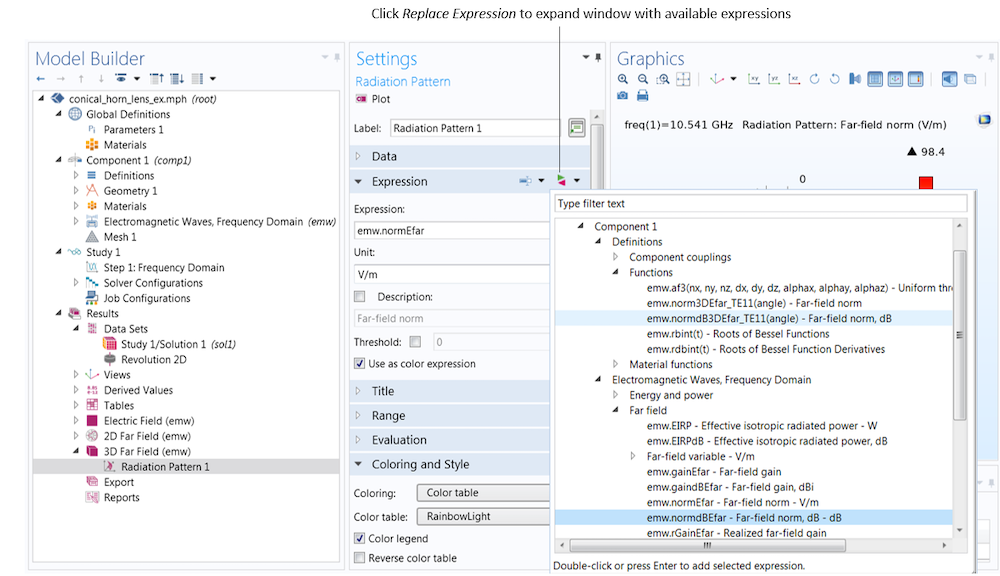
The far-field functions, which produce effective 3D far-field plots, are found under Component 1 > Definitions > Functions. The far-field variables, which produce an axisymmetric body of revolution, are found under Electromagnetic Waves, Frequency Domain > Far field.
| Settings | Expression | Description |
|---|---|---|
| Azimuthal mode number 1, circular port TE mode number 1 | normdB3DEfar_TE11 | 3D far-field norm, dB |
| Azimuthal mode number 2, circular port TM mode number 1 | norm3DEfar_TM21 | 3D far-field norm |
The function name includes the mode type and mode numbers. In our example, the plotted expression corresponds to the first entry in the table above. We plot the far-field norm function on the dB scale.
The far-field function contains an argument, which is given the name “angle” by default. We must expand the Evaluation section, and in the Azimuthal angle variable field, enter angle to match the function argument. Note that the name can be chosen freely as long as the function argument matches the azimuth angle variable specified in the Evaluation section.
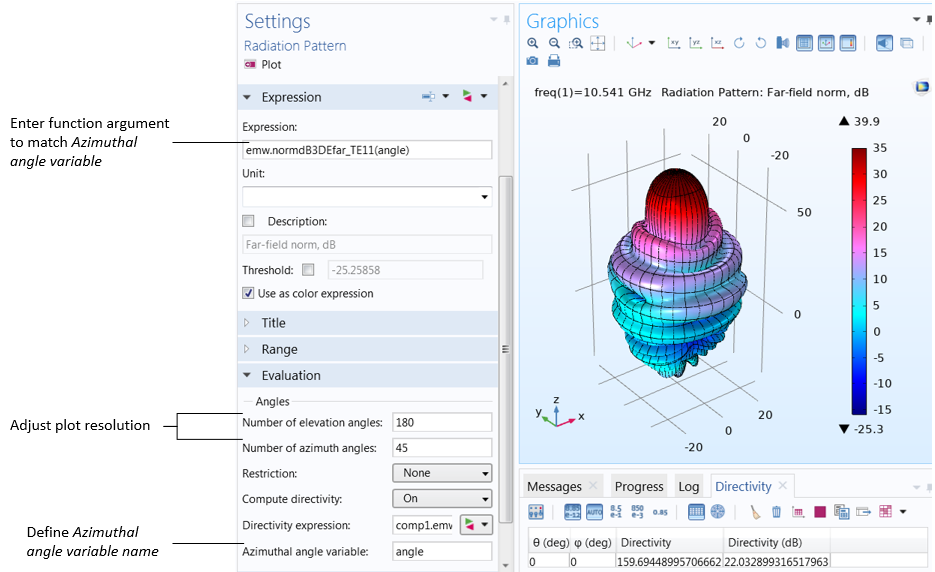
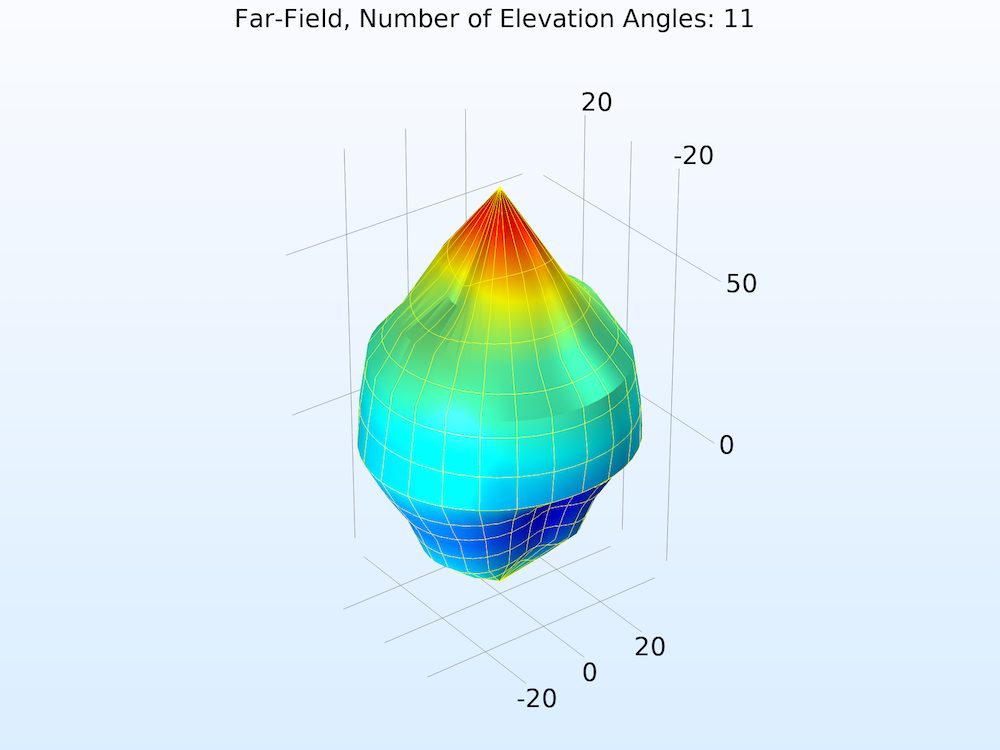
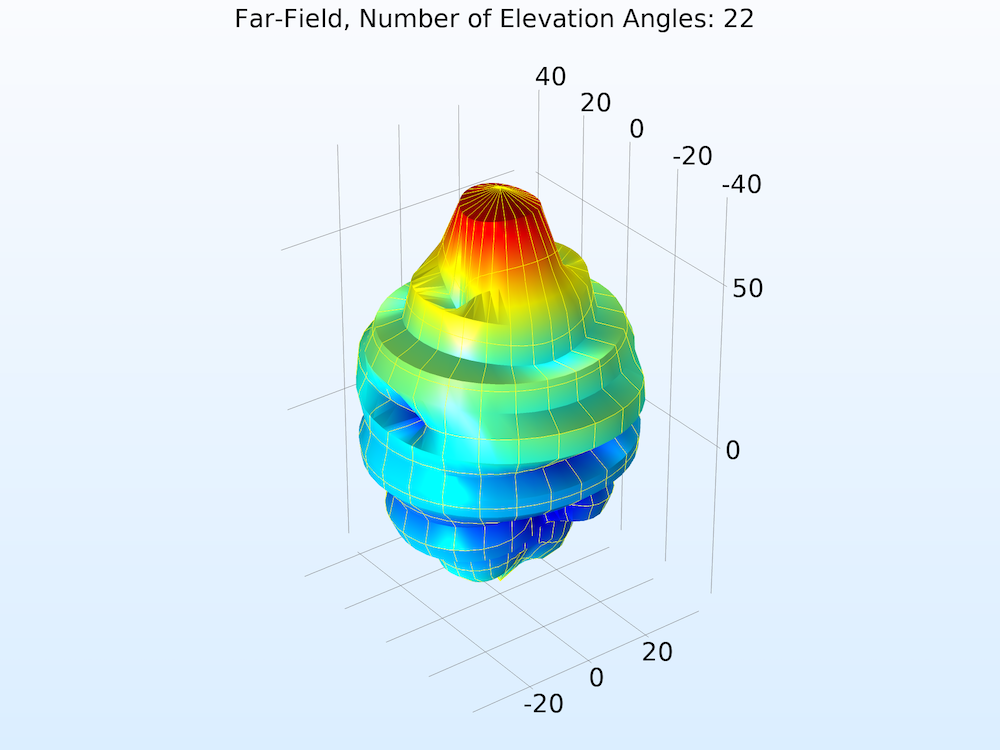
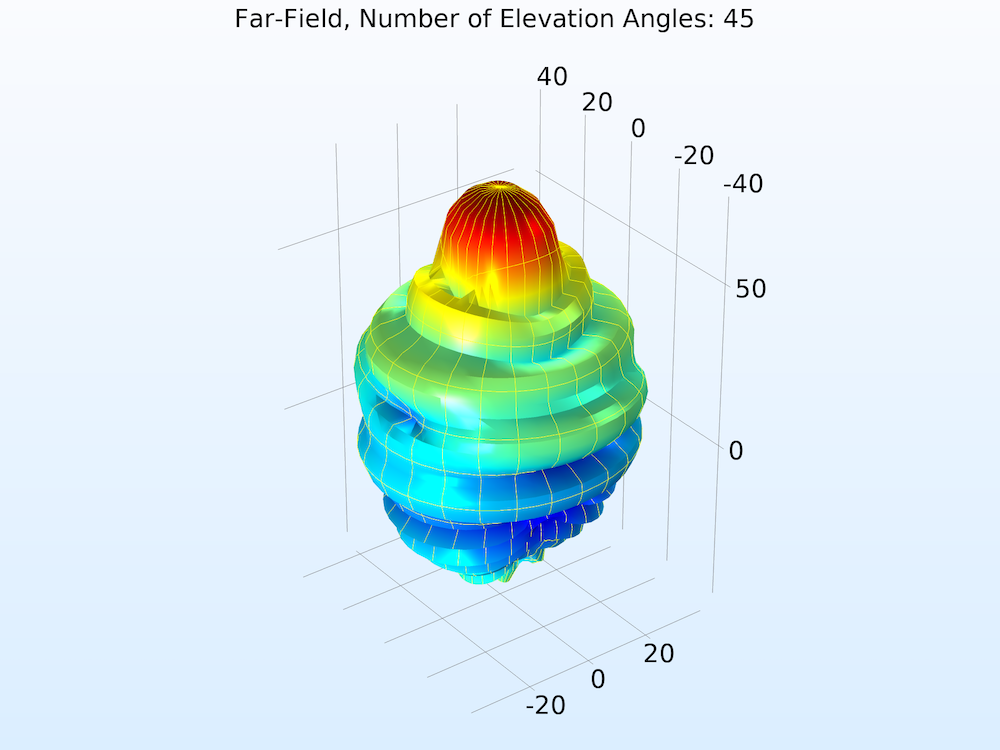
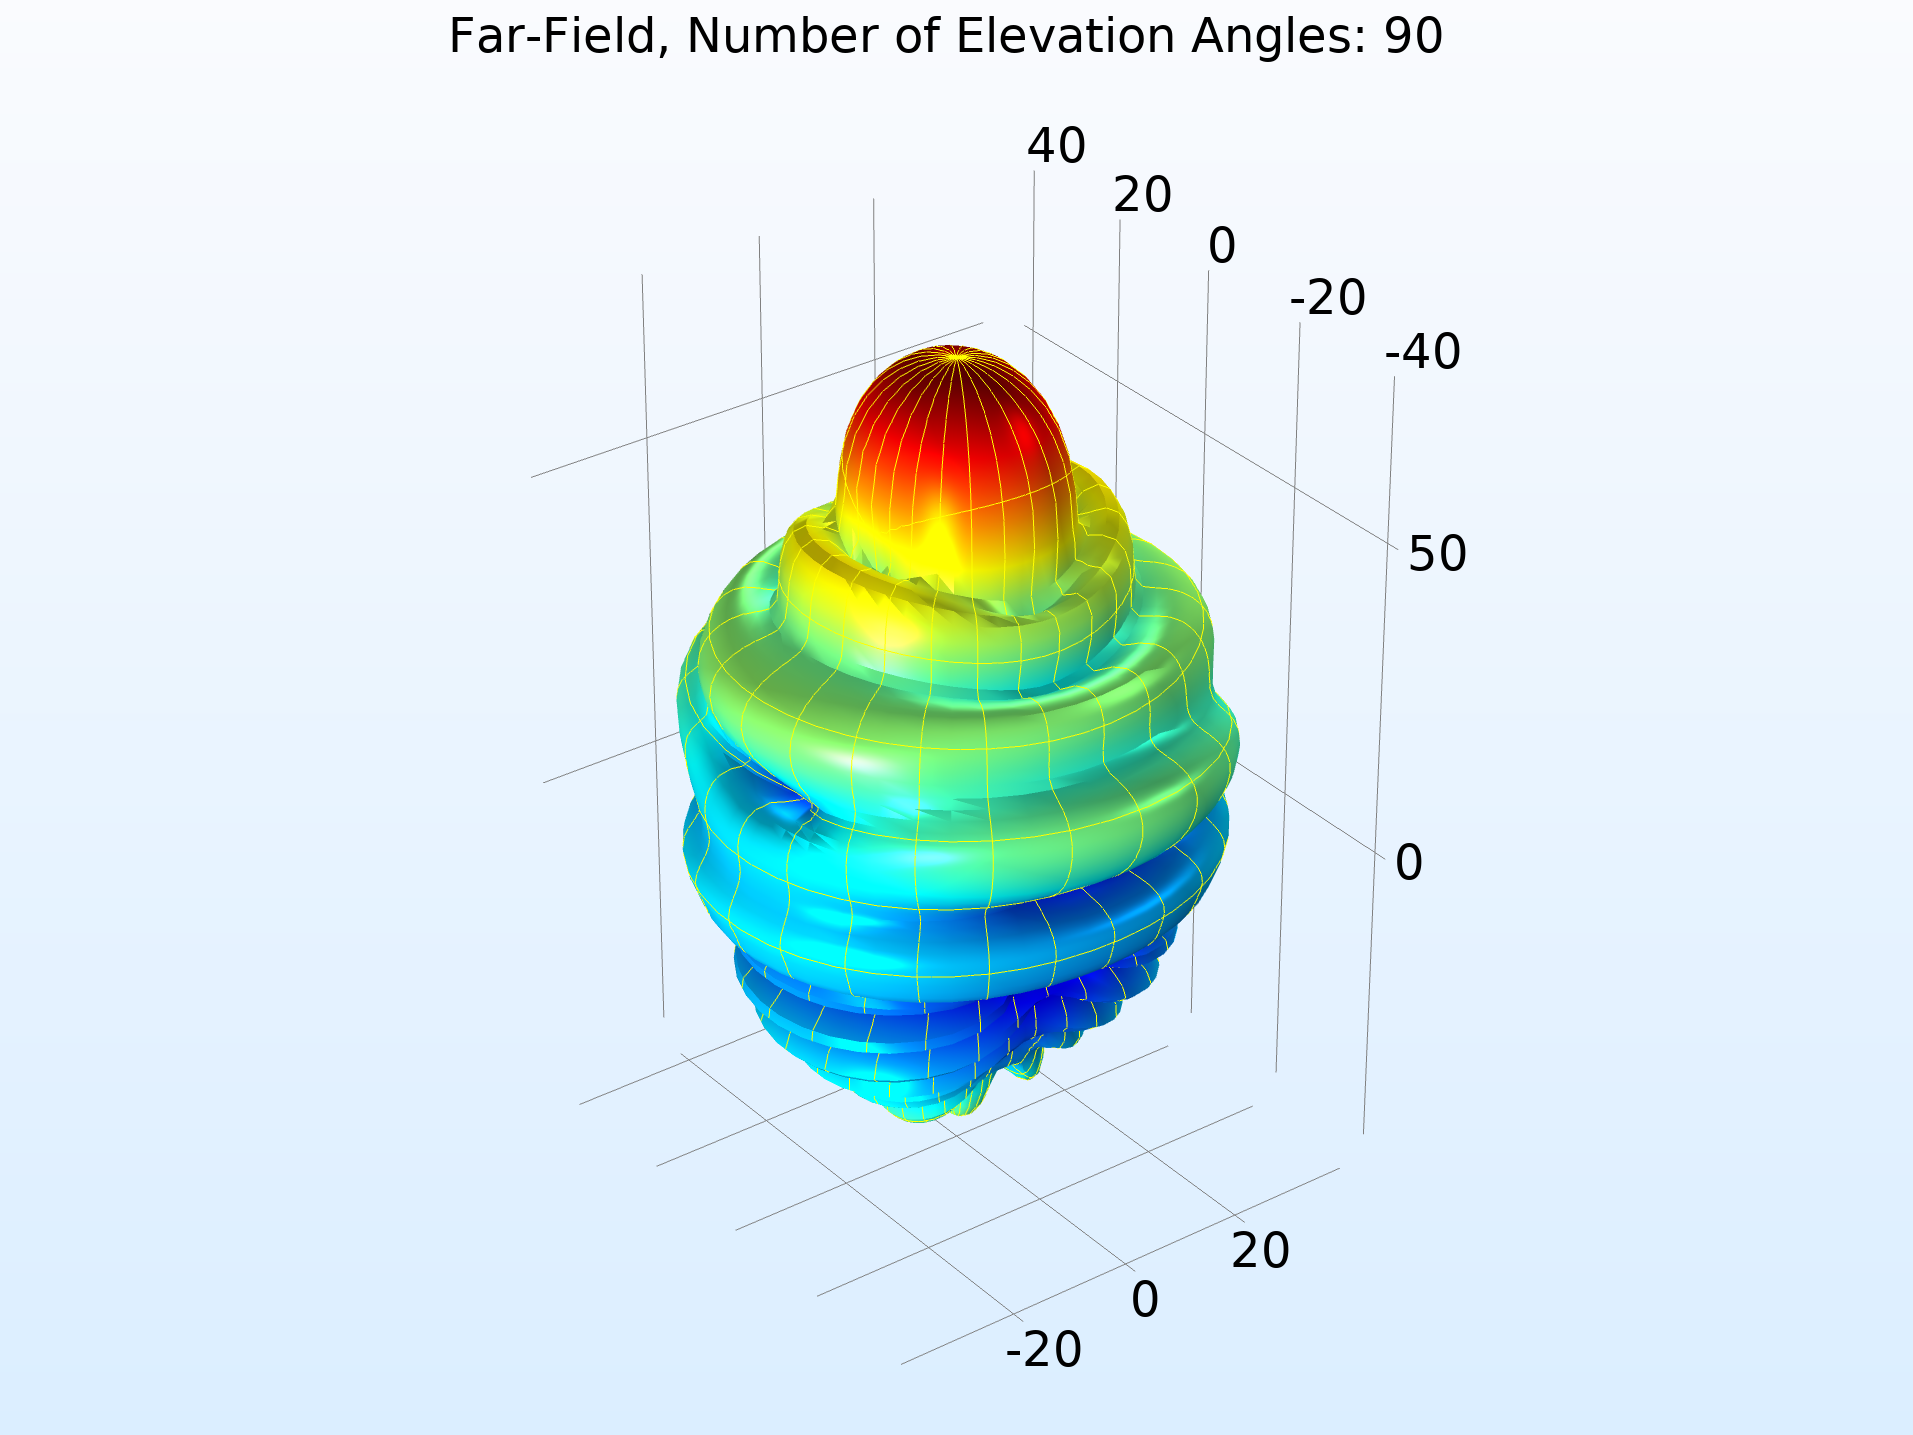
The function argument (“angle” by default) must match the Azimuthal angle variable, defined in the Evaluation section. Also in the Evaluation section, increase the number of elevation and azimuth angles to improve the resolution.
Far-field norm function plotted with increasing Number of elevation angles from left to right.
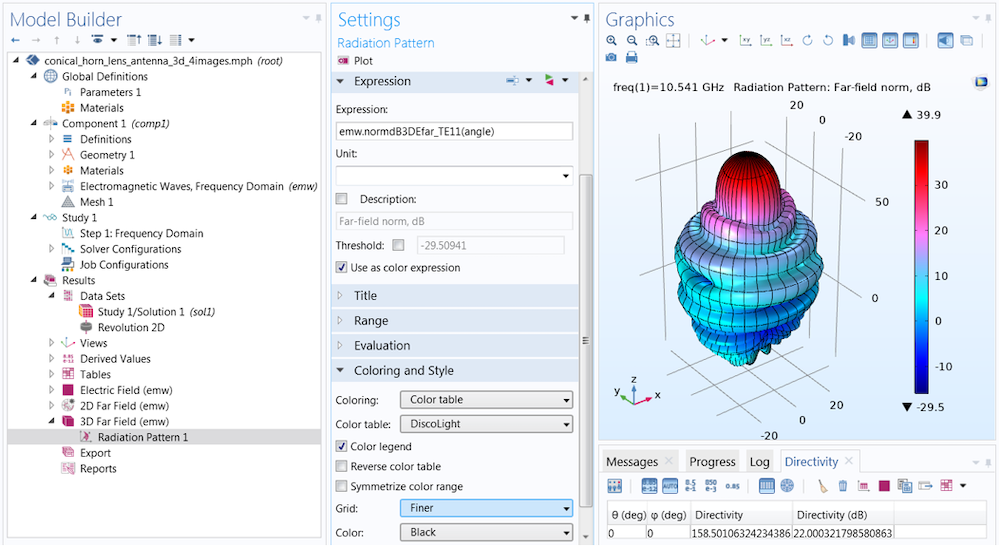
In the Coloring and Style section of the settings for Radiation Pattern, you can add gridlines to the far-field plot. Here, the Finer setting draws gridlines for every 10 degrees.
We have now covered 3D far-field function plots, but what if we want to plot on a 2D cross section? To do so, we can modify the 2D far-field plot, which is generated by default. This is a Polar Plot Group containing a Radiation Pattern plot; the default expression is the far-field norm variable. Just as in the previous case, we click the Replace Expression button to add the far-field function expression.
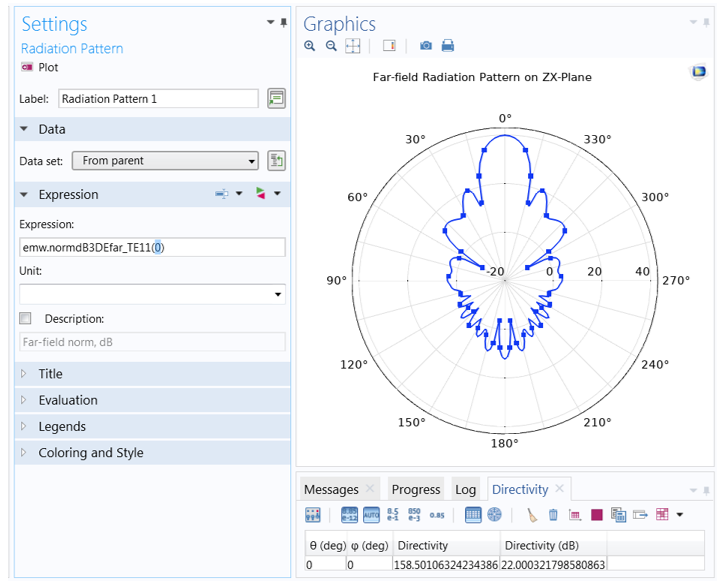
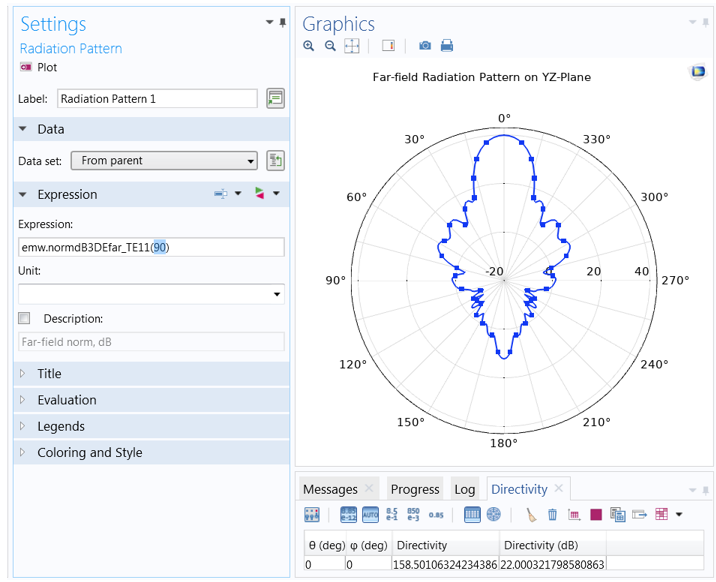
This time, we must set the function argument (azimuthal angle) to a fixed value. The value entered here is measured with respect to a cross-sectional plane, which is defined in the Evaluation section. While it is sometimes necessary to change the Normal and Reference direction vectors, in most cases, the plot orientation can be more easily adjusted in the Axis section of the Polar Plot Group settings.
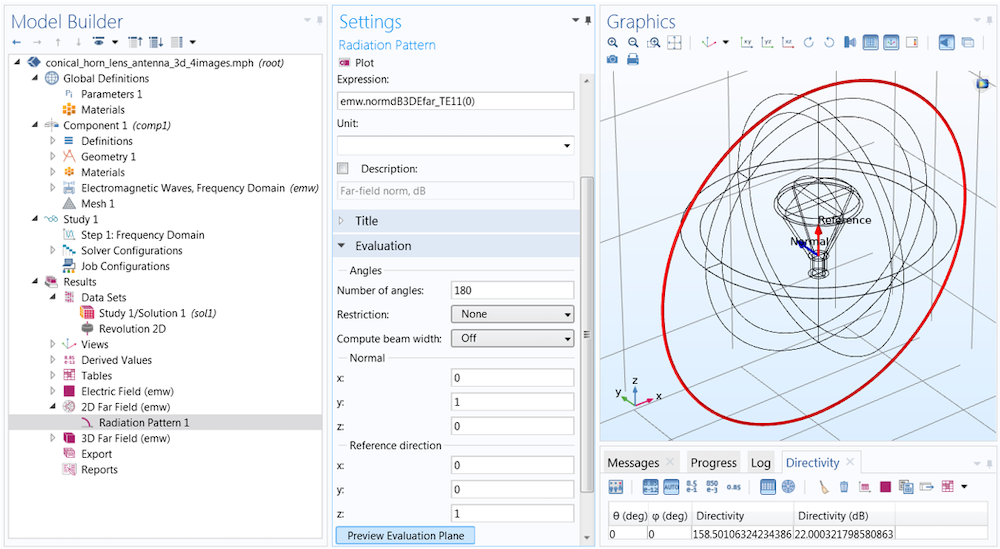
The function argument (fixed azimuth angle) is measured with respect to a plane defined in the Evaluation section. The plane is described in terms of a Normal and an orthogonal Reference direction vector, respectively (0,1,0) and (0,0,1) by default. You can click Preview Evaluation Plane to visualize the orientation of the plane produced by these settings.
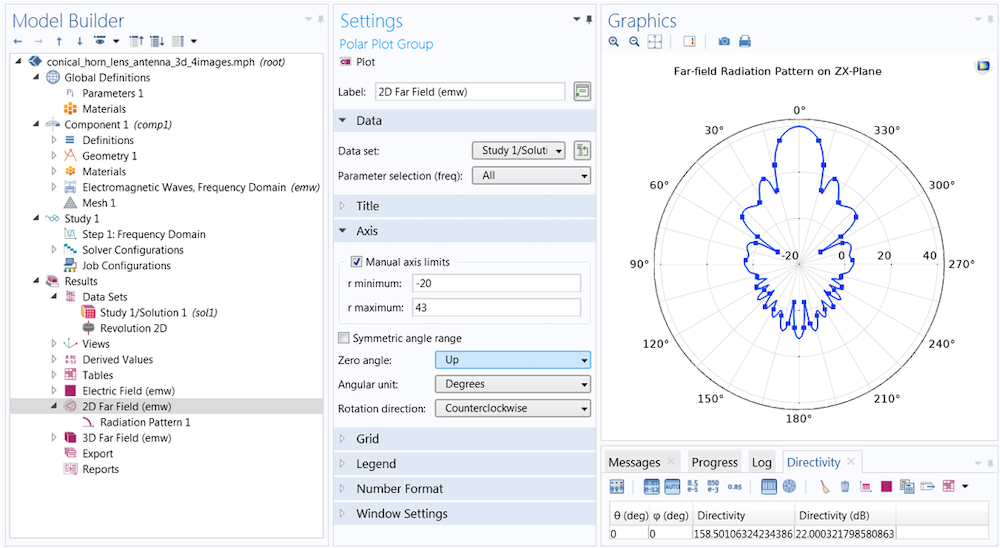
To change the orientation of the polar plot, first turn to the Polar Plot Group settings (rather than the Evaluation settings in the Radiation Pattern 1 node). Here, the Zero angle is set to face Up rather than (the default) to the right. You can also adjust the dynamic range by selecting the Manual axis limits check box. Here, the min and max are set to -20 and 43, respectively.
Each plot has the same settings for the reference plane defined in Evaluation. The difference between the two is the azimuth angle entry in the function argument. When the angle is set to 0 degrees, the plot plane corresponds to the evaluation (zx-) plane (left). When the angle is set to 90 degrees, the evaluation plane is rotated 90 degrees about the z-axis, and the plot lies on the yz-plane (right).
Concluding Thoughts on Producing Effective 3D Far-Field Plots
In this blog post, we have summarized how we can produce effective 3D far-field plots from 2D axisymmetric models. With this information, users of the RF Module can drastically reduce simulation requirements for axisymmetric structures excited by a circular port. By following a few simple steps, far-field functions are generated automatically and available for visualization in postprocessing. Access the Circular Horn Antenna model, showcased in this blog post, by clicking the button below. If you have any additional questions, contact COMSOL Support — we’re here to help.




Comments (1)
asghar mahmod
July 26, 2022Thanks dear Aline, This post is very interesting. How can i find the expression for the 3D far field ? for example (emw.gaindB3DEfar_TE11(0)) . My goal is a minor variation of the mentioned equation to calculate Co-polarization and Cross-polarizatio pattern.
Best regards