
In this blog post, we showcase a piezoelectric micropump model courtesy Riccardo Vietri, James Ransley, and Andrew Spann at Veryst Engineering, LLC. You will see how to combine piezoelectric materials with the effect of fluid-structure interaction, as well as how to use a simple velocity-dependent formula to capture the effect of one-way valves at the inlet and outlet boundaries. We also demonstrate the use of disconnected mesh between the solid and fluid domains.
What Is a Piezoelectric Micropump?
Piezoelectric micropumps are commonly used in the medical field thanks to their ability to precisely deliver very small amounts of fluids or gases. In the example model, the fluid chamber is covered by a flexible membrane driven by an annular piezoelectric actuator. Due to the symmetry of the physics, only half of the geometry is included. The figure below shows the membrane highlighted in yellow, with the annular actuator on top and the fluid volume below (other than the membrane, the chamber wall is not shown for clarity).
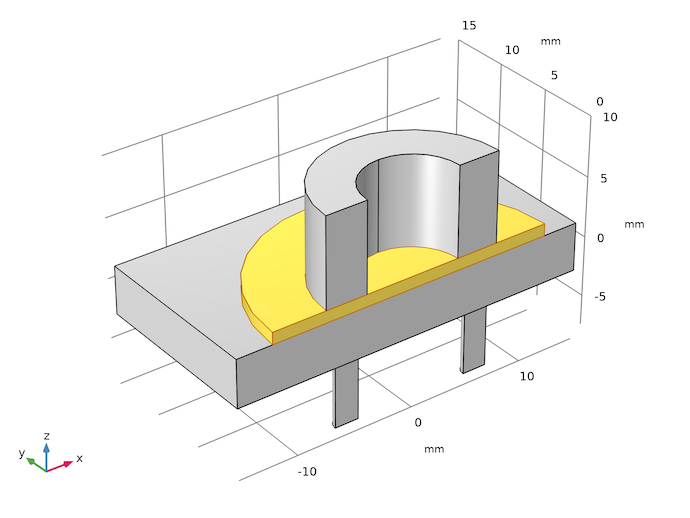
The geometry of the piezoelectric micropump model. The flexible membrane is highlighted.
The top surface of the piezoelectric and the circumference of the membrane are mechanically fixed. Thus, when the piezoelectric expands under an applied bias voltage, the membrane is pushed into the fluid chamber, forcing some fluid out. During the other half of the drive cycle, when the piezoelectric contracts, the membrane is pulled up, drawing some fluid into the expanding chamber. One-way valves are installed in the two pipes beneath the fluid chamber to direct the fluid to flow in through the pipe on the left and out through the pipe on the right.
Piezoelectric Stack
In a real micropump, a stacked piezoelectric actuator would be employed with many separate piezoelectric layers and electrical contacts. For the purpose of this model, we neglect the stiffness of the thin metal layers and model the actuator as a monolithic block of piezoelectric. For example, assuming the layer thickness of 100 µm, 75 layers, and an electric field of 0.2 V/µm, as shown in the parameter table below, we apply the equivalent potential difference of 1500 V across the entire piezoelectric. The actual voltage required in a real device would depend on the desired electric field and the thickness of each layer in the stacked actuator.
| t0 | 0.1[mm] | 1E-4 m | Piezoelectric layer thickness |
| n | 75 | 75 | Number of layers in actuator |
| E0 | 0.2[V/um] | 2E5 V/m | Electric field strength |
| V0 | E0*t0*n | 1500 V | Applied voltage |
The parameters used to illustrate the relationship between the layer thickness, number of layers, electric field strength, and the applied voltage for an equivalent monolithic piezoelectric used in the model.
One-Way Valves
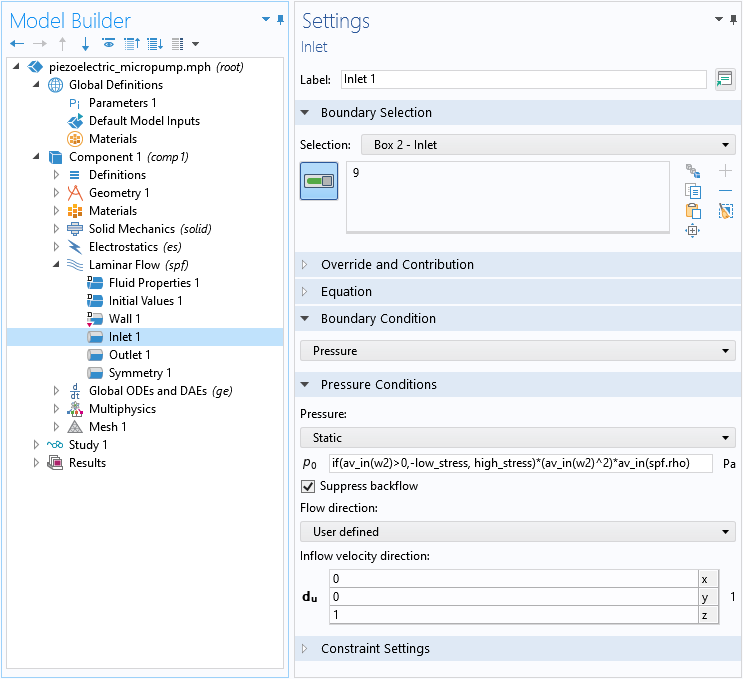
The inlet and outlet work by employing check valves to ensure a one-way flow. In the model, the valve is represented by a simple boundary condition based on K-factor piping losses, where the losses are high when flowing against the valve and low when flowing in the direction of operation. The back pressure resulting from the valve is represented by the following equation:
(1)
where u_{av} is the average velocity of the fluid normal to the boundary, \rho is the fluid density, and A is a dimensionless constant that changes magnitude depending on the sign of u_{av}.
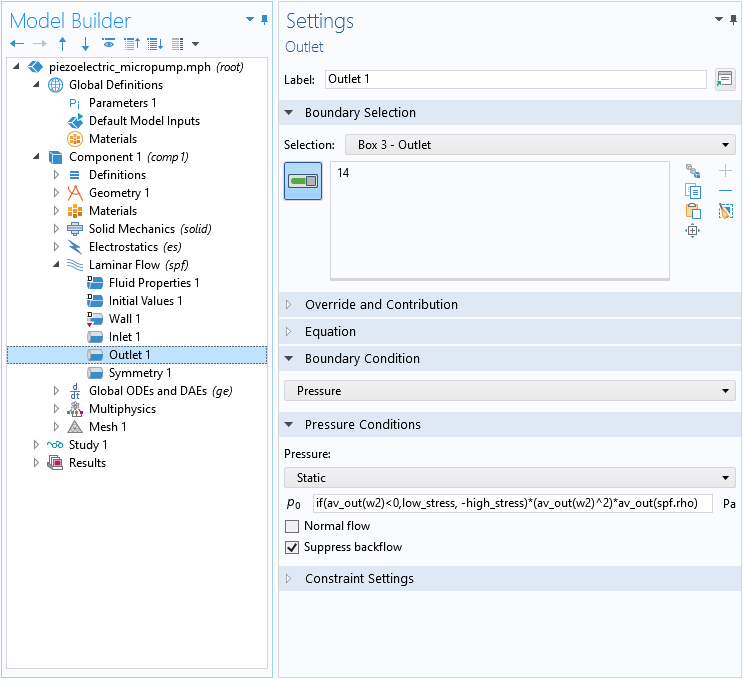
The back pressure is applied as a normal stress at the end of a short length of pipe. This ensures that the fluid flow in the chamber is realistic, despite the approximate boundary condition. This boundary condition can be employed to represent a simple fluid valve. The constants used for the outlet boundary are reversed with respect to those used in the inlet, representing a different orientation of a similar valve. This encourages flow through the pump in the desired direction. To represent a low resistance valve (such as a simple flapper valve), we set A to 5000 for the closed condition and 0.1 for the open condition. Careful tuning of these values and potential refinement of this model would be desirable in a real application.
In the model, the two values of A are specified as parameters, and switching between them is done by an if operator, as shown in the screenshots below.
| high_stress | 5e3 | 5000 | Boundary Stress (High) |
| low_stress | 1e-1 | 0.1 | Boundary Stress (Low) |
The parameters for the two values of A and the inlet and outlet boundary conditions implementing Eq. 1.
Geometry and Mesh
To demonstrate the flexibility of the COMSOL® software in treating disconnected mesh, we unify the solid and fluid domains separately, and then use Form Assembly in the final step in the geometry sequence, as shown in the screenshot below. Also note that the Create imprints check box is enabled to facilitate the creation of the boundary pair at the fluid-solid interface underneath the membrane.
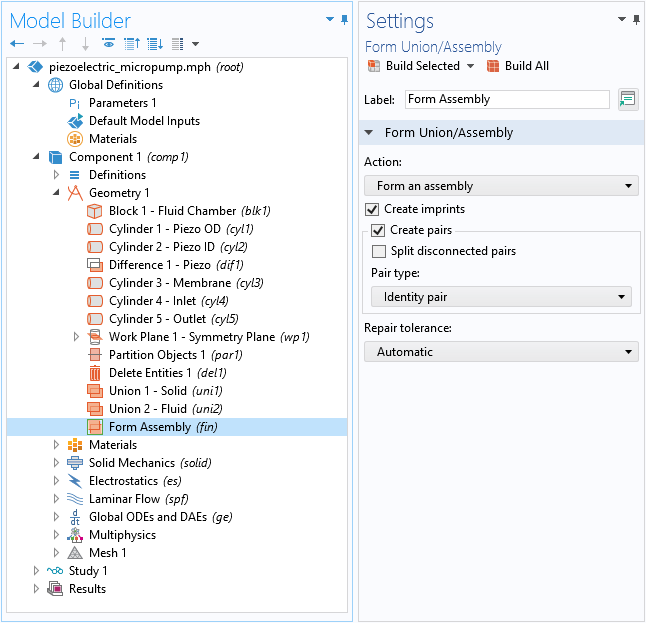
The solid and fluid domains are unified separately in the geometry sequence. Form Assembly is used with Create imprints enabled.
Now we have the flexibility to mesh the solid and fluid domains independently, as shown in the mesh plot below. Note that the mesh nodes on the solid side do not line up with those on the fluid side at the solid-fluid interface. The fluid chamber wall is highlighted where three layers of boundary mesh are used to resolve the flow patterns near the wall. To save computation time for the purposes of this example, a relatively coarse mesh is used.
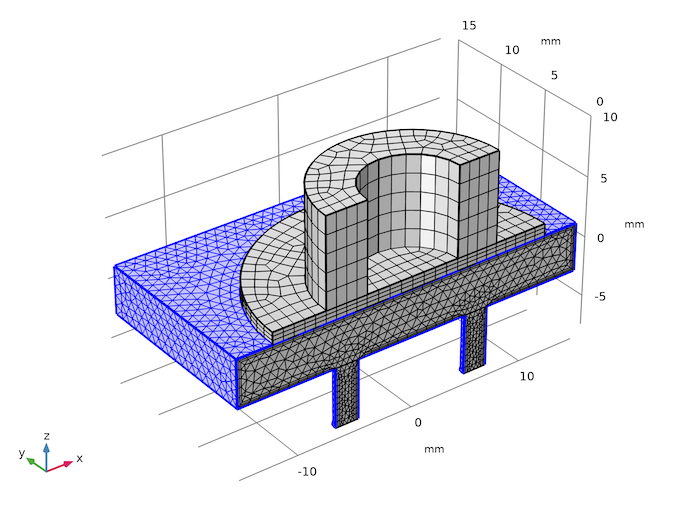
The meshes in the fluid and the solid domains are independent of each other.
Multiphysics Couplings
Both the piezoelectric effect and fluid-structure interaction are easily included using built-in multiphysics couplings. The screenshot below shows that the latter uses the pair version of the fluid-structure interaction feature, since the Form Assembly is used in the geometry sequence. The Create imprints option ensures the correct location of the autogenerated boundary pair, as shown by the pink highlight in the screenshot.
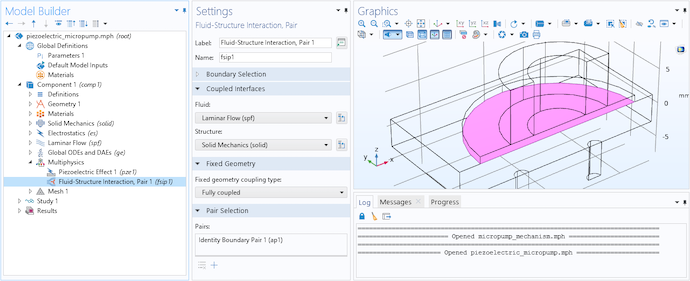
The Fluid-Structure Interaction, Pair coupling is used.
Simulation Results
The plot below shows the inlet and outlet flow rates and confirms the conservation of fluid volume within the device. The drive voltage is ramped up during the first 3/4 of the actuation period. Afterward, a consistent time-periodic flow is quickly established. The difference between the inlet and outlet flows matches the volume of fluid displaced by the membrane deflection due to the piezoelectric stroke, confirming volume conservation.
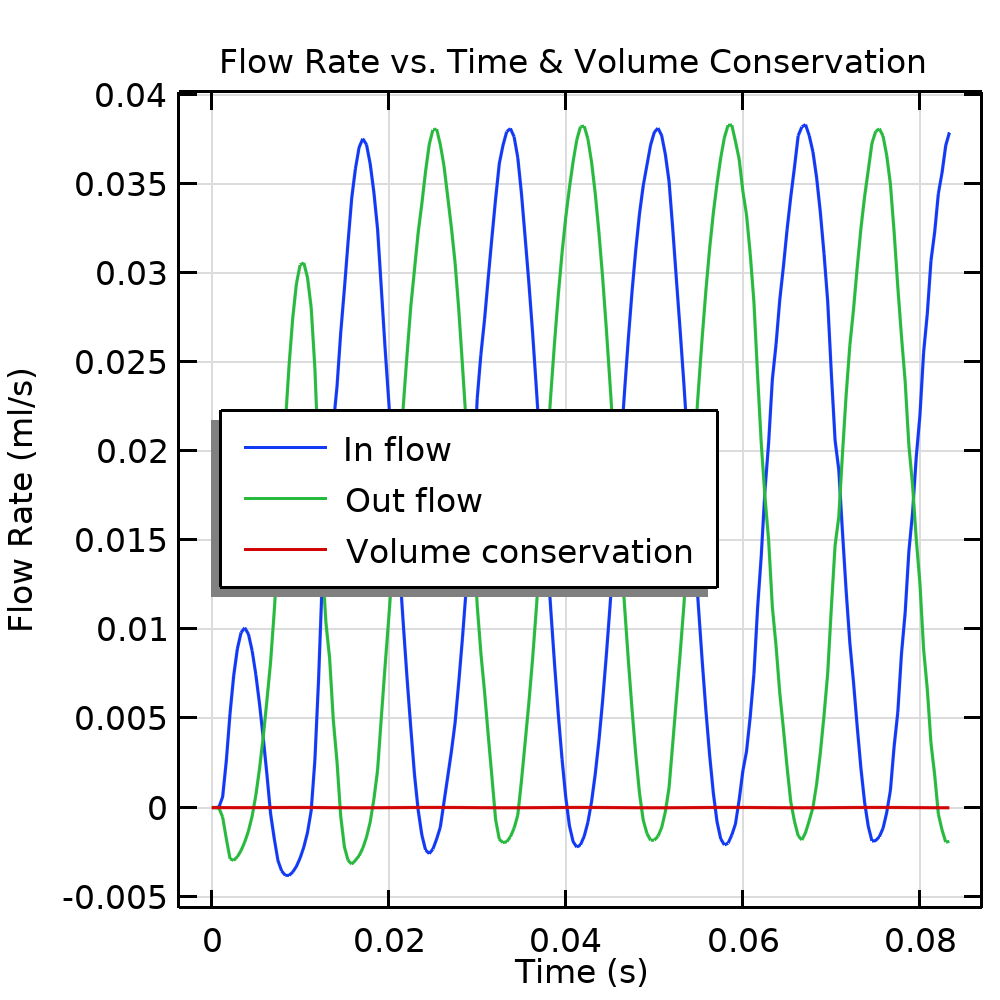
Flow rates and volume conservation.
The time-integrated flows into the inlet and out of the outlet are calculated using a global equation and are shown in the plot below. The net flow through the pump in 0.05 s is 1.44 µL, corresponding to 28.8 µL/s or 1.728 ml/min. This is typical for such a nonresonant design.
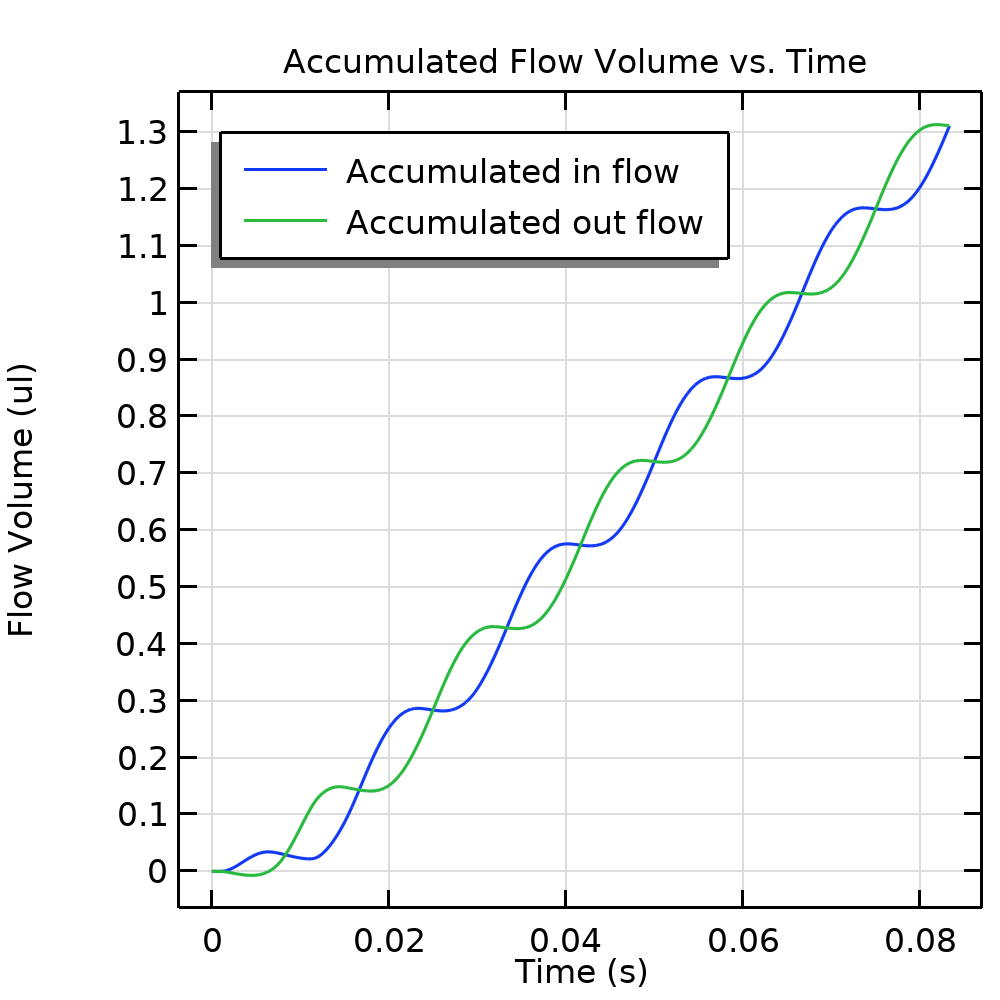
Net fluid flow through the inlet and the outlet over time, computed using a global ordinary differential equation.
To visualize the fluid flow pattern during each half of the stroke, we show two sets of graphs below, one for the velocity field (both fluid and solid), and the other for the fluid streamlines.
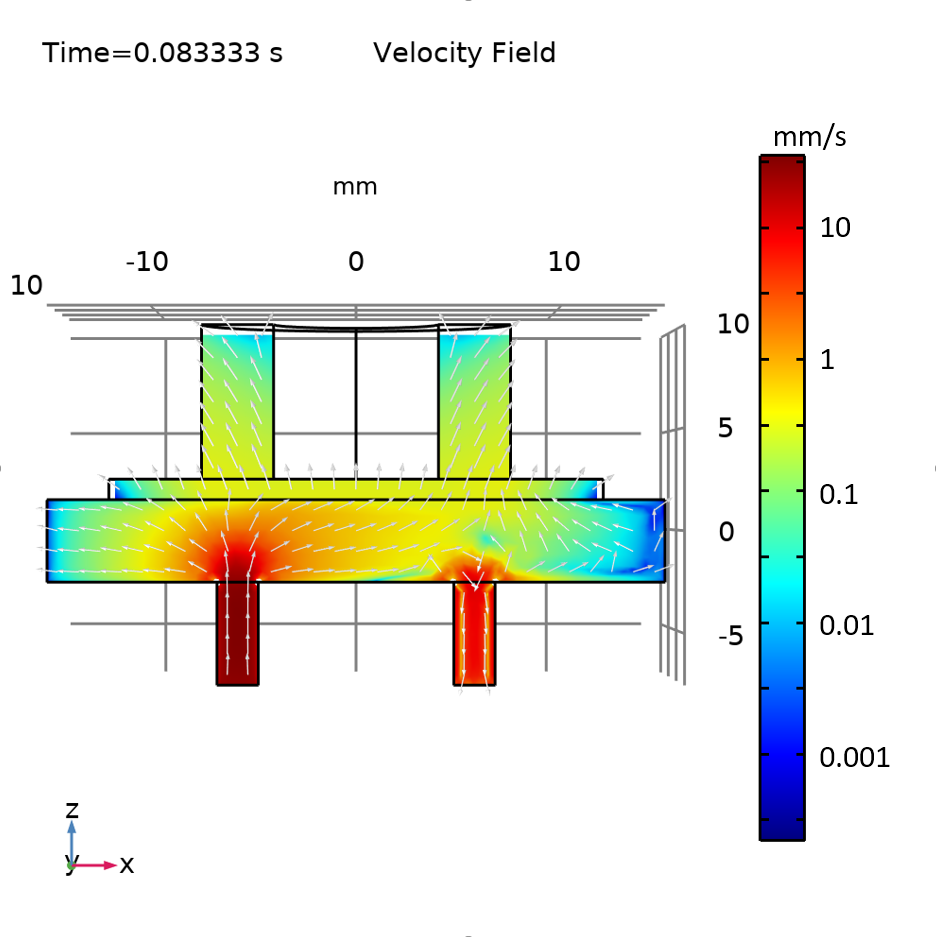
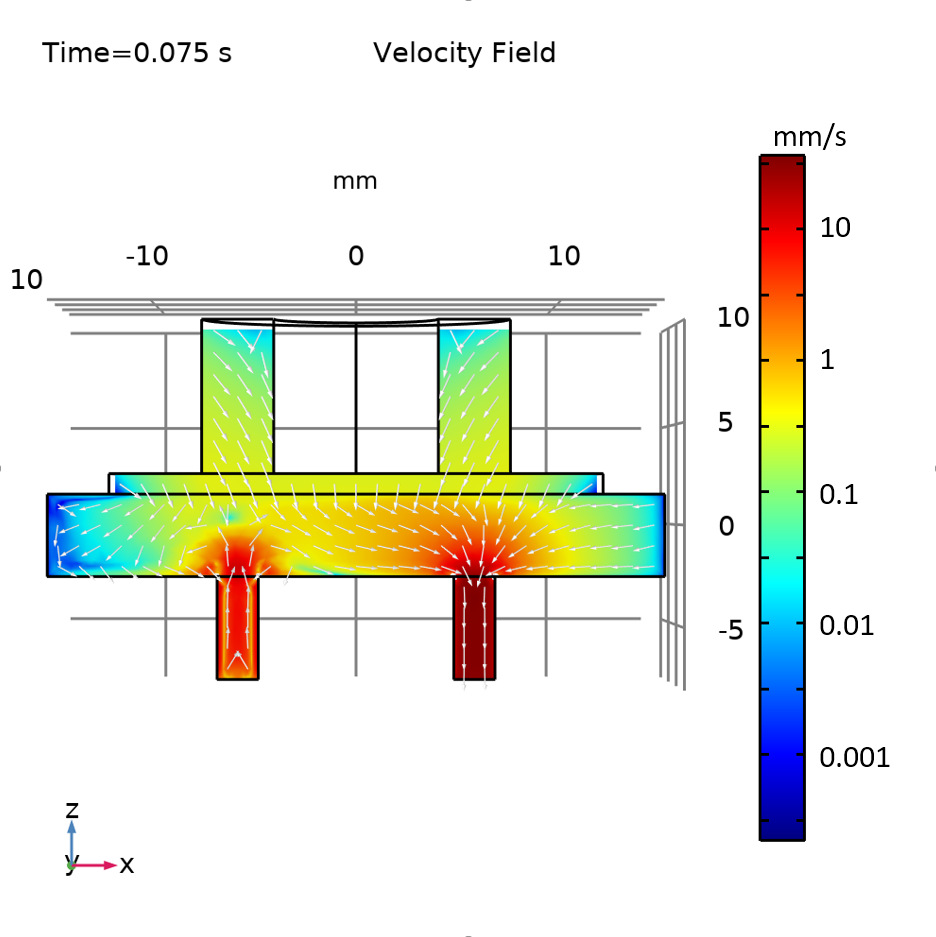
The velocity field for the flow direction in (left) and out (right) of the micropump.
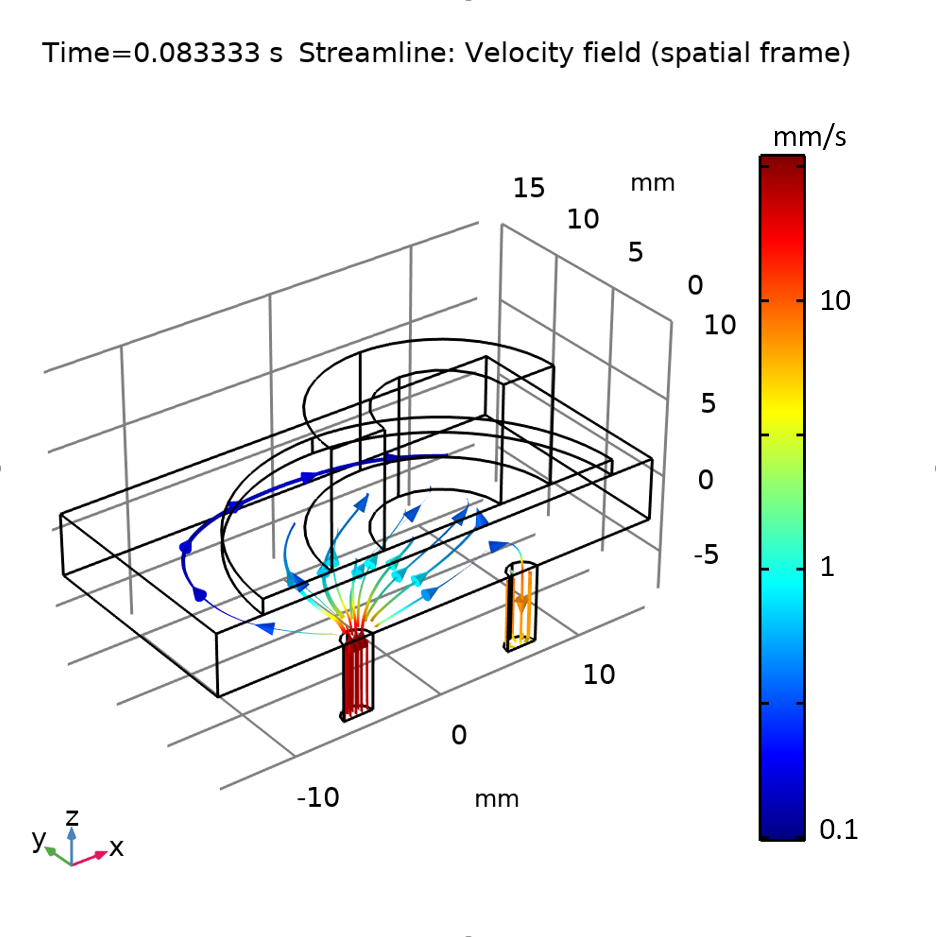
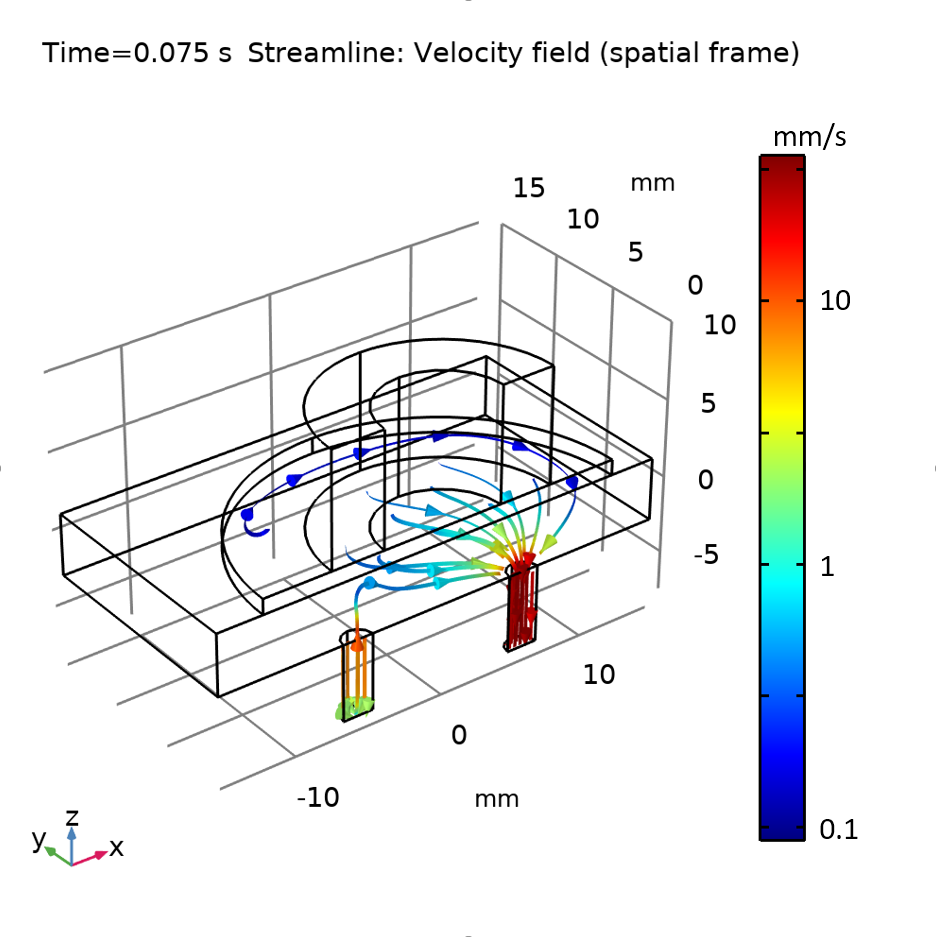
The fluid streamlines for the flow direction in (left) and out (right) of the micropump.
Concluding Remarks
We have demonstrated a piezoelectric micropump model in the MEMS Module, an add-on to COMSOL Multiphysics. To keep this post short, we have not discussed the use of selections to facilitate setting up the materials, physics, and mesh. We have also not described the global equation for calculating the accumulated flow volume and the global probes for monitoring flow rates during the solution process. All of these topics are discussed in detail in the PDF documentation accompanying the example. Have fun reading (and modeling)!
Try It Yourself
Get the MPH file and documentation for the Piezoelectric Micropump model by clicking the button below:




Comments (0)