
Bose–Einstein condensation is a quantum mechanical phenomenon where a macroscopic number of bosons, such as photons or helium-4, occupy the same quantum state, leading to effects such as superfluidity, superconductivity, and lasers — and most recently achieved in trapped dilute cold atoms. When such systems are subjected to a rotating perturbation instead of rotating as a whole, a vortex lattice is formed. Here, we introduce a model for simulating the fascinating process of vortex lattice formation, available as of version 5.6 of the COMSOL Multiphysics® software.
The Schrödinger Equation Physics Interface
The Schrödinger Equation physics interface is available in the Semiconductor Module, an add-on to COMSOL Multiphysics. In the simplest use cases, it describes the dynamics of a nonrelativistic particle under the influence of a potential energy landscape. (Ref. 1) Using the envelope function approximation, it can be used to model quantum-confined solid-state systems such as quantum wells, wires, and dots. (Ref. 2) By casting into the form of the Gross–Pitaevskii equation (Ref. 3 and 4), it can also be used to simulate a Bose-condensed system, as we show in this blog post.
The Vortex Lattice Formation Experiment
Madison, Chevy, Bretin, and Dalibard published their experimental work in 2001 (Ref. 5) showing a series of striking images (Fig. 3 in the paper) that vividly demonstrate the nucleation and formation of a vortex lattice in a trapped cloud of Bose–Einstein condensate atoms stirred by a rotating laser field. In the same figure, they also plotted the time evolution of the ellipticity |\tilde\alpha| (see Eq. (7) below), showing an initial oscillation followed by a collapse of |\tilde\alpha| to near zero when the system goes through a period of dynamical instability before settling down in the low-energy state of a vortex lattice.
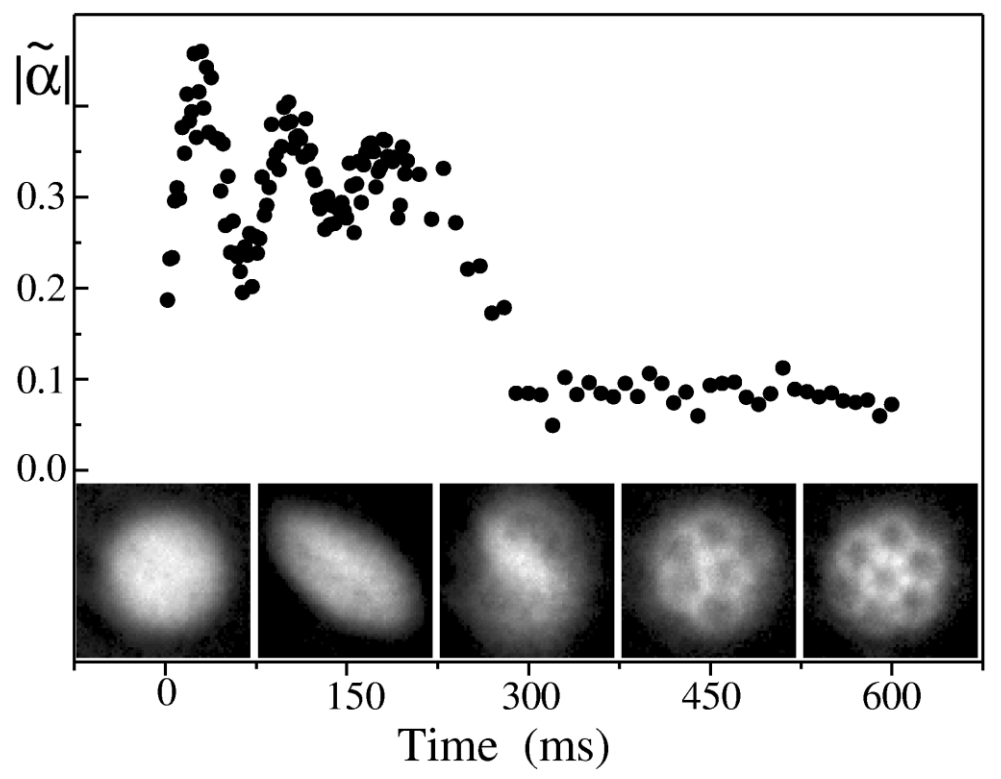
Fig. 3 from the experimental paper by Madison et al. (Ref. 5).
The main trapping potential is characterized by the transverse and longitudinal trapping frequencies \omega_t and \omega_z:
where m is the atomic mass.
The ratio of the trapping frequencies \lambda\equiv\omega_t/\omega_z is 9.2, as indicated in the figure caption of Fig. 3 in Ref. 1.
The optical potential from the rotating laser field can be approximated by
(2)
where the X and Y axes rotate at a frequency \Omega around the z-axis.
The total potential V_{trap}+V_{laser} is then characterized by the trapping frequencies \omega_{X,Y}^2\equiv\omega_t^2(1+\epsilon_{X,Y}) and \omega_z.
The laser field can be adjusted to produce different values of aspect ratio \epsilon, defined as
(3)
A characteristic frequency parameter \bar\omega is defined
(4)
as a reference for the rotating frequency \Omega: \Omega\equiv\tilde\Omega \bar\omega.
For example, Fig. 3 in Ref. 1 is produced with \tilde\Omega = 0.7. In addition, \bar\omega is also used to quantify the ellipticity |\tilde\alpha|, which will soon be detailed below. However, the experiment was performed with the aspect ratio \epsilon ramped up and down during the time evolution. Thus, the value of \bar\omega will also change up and down during the time evolution, if the definition (4) is used for any combination of \epsilon_X and \epsilon_Y.
To maintain a constant value of \bar\omega as a solid reference for the rotating frequency \Omega and the ellipticity |\tilde\alpha|, we use the constant values 0.03 and 0.09 for \epsilon_X and \epsilon_Y when evaluating \bar\omega in the model. The reference values of 0.03 and 0.09 are based on an earlier experimental paper by the same group as cited by Ref. 2.
Finally, the ellipticity |\tilde\alpha| is defined as follows. The density profile of the trapped condensate is well approximated by the Thomas–Fermi profile:
(5)
where \mu_{TF} is the chemical potential (within the Thomas–Fermi approximation), g=4\pi\hbar^2a/m is the coupling constant set by the scattering length a (=5.5 nm for 87Rb in the |F=2, mF=2> ground state).
The parameter \alpha is defined in terms of the transverse sizes (R_X and R_Y) of the density profile given by Eq. (5) above:
(6)
Then the ellipticity parameter \tilde\alpha is defined as
(7)
The Theory
In this model, we follow the theoretical approach of Tsubota et al. (Ref. 2) to simulate this spectacular time evolution process by solving the Gross–Pitaevskii equation in the rotating frame with phenomenological damping (Ref. 3):
(8)
where \gamma is the damping coefficient, \mu is a chemical potential parameter to be adjusted at all times to preserve the number of condensate atoms, and -\Omega L_z=i\hbar\Omega(x\partial_y-y\partial_x) is the centrifugal term in the rotating frame.
Choi et al. (Ref. 3) provided a formula to estimate the damping coefficient \gamma:
(9)
where K_1 is a modified Bessel function and we have assumed equilibrium between the condensate and its surrounding thermal atoms.
The Thomas–Fermi approximation provides good estimates of many important parameters, such as the damping coefficient \gamma. The peak density and size parameters in a cylindrically symmetric trap are summarized here:
(10)
\rho_0\equiv\frac{\mu_{TF}}{g} &= \frac{15N}{8\pi R_r^2 Rz} \\
R_r &= \left(\frac{15g \omega_z N}{4\pi m \bar\omega^3}\right)^{1/5}\\
R_z &= \left(\frac{15g \bar\omega^2 N}{4\pi m \omega_z^4}\right)^{1/5}
\end{align*}
where N is the number of atoms in the condensate.
Modeling the Vortex Lattice Formation
Model Parameters
The Gross–Pitaevskii equation (8) can be implemented straightforwardly using the Schrödinger Equation physics interface in the Semiconductor Module. When constructing the model, we have paid special attention to match the model parameters to the actual experimental conditions in Ref. 1, resulting in a good agreement of the simulated time evolution with the published data.
According to Bretin’s thesis, the stirring laser field was turned on instantaneously, after which the aspect ratio \epsilon was ramped up in 20 ms and then held constant for 300 ms. Therefore, in the model, we make the stirring laser field always on and make the aspect ratio \epsilon time dependent. To share the same formulas between time-dependent and stationary studies, we define a time parameter using the same name t as the built-in time parameter for time-dependent studies. The ramp duration of 20 ms and the off time of 300 ms are defined as parameters tau and t_off, respectively. Then we define a step function to ramp up and down the aspect ratio \epsilon, assuming the same ramp down time period of 20 ms. The formula for
epst=0.032*step1((t+tau)/tau)*(1-step1((t-t_off)/tau))
is set up such that the ramp up starts at -20 ms and finishes at time t = 0. The magnitude of \epsilon is set to 0.032, which is based on the text in both Ref. 1 and Bretin’s thesis.
It’s not clear from the paper how exactly the semimajor and semiminor axes of the laser field vary with the aspect ratio \epsilon. However, it seems reasonable to assume that the area of the ellipse remains constant during the ramp. Thus, we obtain the following formulas for the \epsilon_X and \epsilon_Y parameters for the optical potential from the stirring laser field:
epsX=(epst+sqrt(0.03*0.09+epst^2-0.03*0.09*epst^2))/(1-epst),
epsY=(-epst+sqrt(0.03*0.09+epst^2-0.03*0.09*epst^2))/(1+epst).
With these aspect ratio parameters ready, the trapping parameters are entered as described in the experiment section. The number of atoms in the condensate is chosen to be 1.5e5, which is consistent with the range of the experiment and best fits the number of vortices in the experiment. For estimating the damping coefficient \gamma, the temperature of 100 nK is used, based on Ref. 1.
Since we use a 2D model to approximate a 3D condensate, we take the Thomas–Fermi formula (10) to compute a reasonable out-of-plane thickness. Choosing the criteria for the out-of-plane thickness such that the peak density in the 2D model matches the Thomas–Fermi peak density in 3D, we obtain the following formula for the out-of-plane thickness L:
(11)
Initial Stationary Condition
First, the stationary state of the condensate is solved for using two studies in the same way as the related model example, Gross–Pitaevskii Equation for Bose–Einstein Condensation. This produces the initial condition for the subsequent transient study.
For the interaction energy term g|\psi|^2 in (8), the built-in variable schr.Pr is divided by the out-of-plane thickness L to give the particle density in 3D. (Note that the meaning of schr.Pr is different from the usual “probability density” in the sense of a regular Schrödinger equation. Here, the dependent variable \psi represents the Gross–Pitaevskii condensate order parameter and schr.Pr (\equiv |\psi|^2) represents the 2D atom density.) In the global equation for the normalization of the wave function N=\int|\psi|^2 in the stationary study, the total energy is scaled by the Thomas–Fermi chemical potential \mu_{TF} so that the global variable to be solved for is of the order of unity.
The figure below compares the resulting particle density profile on the X-axis with the one from the Thomas–Fermi approximation. They agree well, as expected.
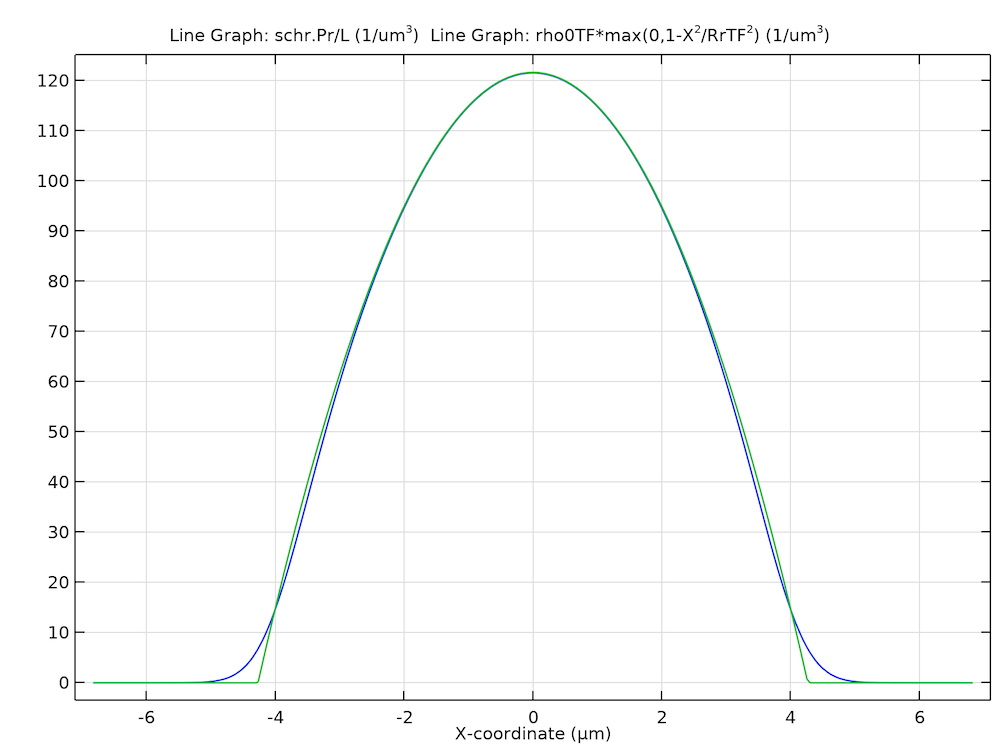
Computed stationary solution of the particle density profile on the X-axis (blue) and the one from the Thomas–Fermi approximation (green).
Rotating Frame, Dissipation, and Normalization
After the stationary solution is obtained, more physics features are added for the time-dependent study. In particular, two features available as of COMSOL Multiphysics version 5.6 are used. One is the Rotating Frame feature, as shown in the screenshot below.
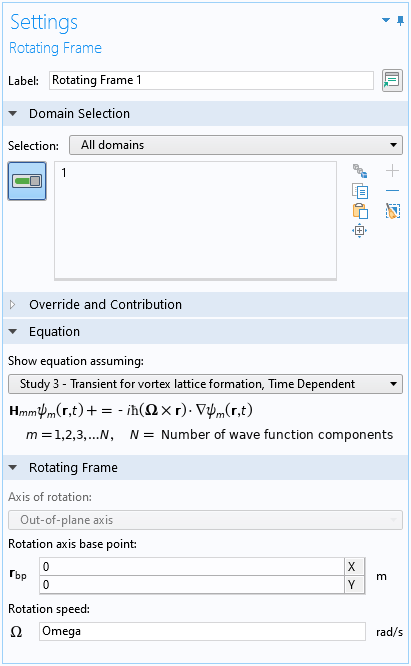
Settings window of the Rotating Frame feature.
For a 2D model such as this one, the axis of rotation is fixed in the out-of-plane direction. For 3D models, the user can choose the axis in arbitrary directions.
The other is the Dissipation feature for the phenomenological damping, which is crucial for the system to relax into the low-energy state of a vortex lattice. See the screenshot below.
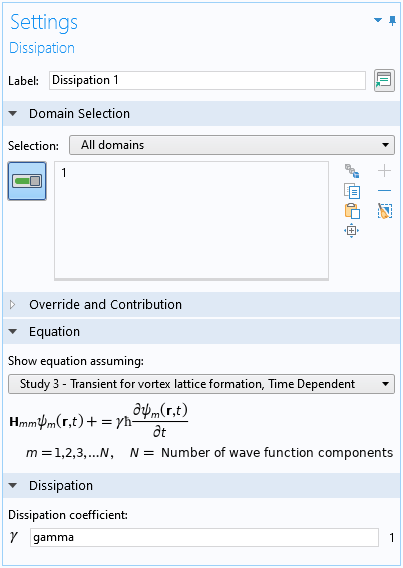
Settings window of the Dissipation feature.
Following Ref. 2 and similar to the stationary study, a global equation is used to maintain the number of atoms in the condensate by adjusting the chemical potential, and the global variable being solved for is scaled to the order of unity with the energy scale of the Thomas–Fermi chemical potential \mu_{TF}.
Dynamical Instability
The system goes through a period of dynamical instability before settling down to the low-energy vortex lattice state. The stochastic nature of this physical process leads to a significant variation in the simulated time history from run to run. The number of vortices in the resulting lattice may also vary. To improve numerical convergence, some adjustments to the solver settings are made. Since the initial condition is a physical solution from the stationary study, consistent initialization can be disabled. It often helps to exclude algebraic states from the error control. The automatic Newton method with a large number of iterations helps go through the unstable period when the nonlinearity is severe.
The animation below shows the computed particle density profile as a function of time. After an initial period of oscillation/rotation of the condensate, vortices start to form at the periphery. A period of dynamical instability follows with vortices moving randomly. (The animation is slowed down during this time period.) Eventually, the system settles down to the low-energy state of a vortex lattice. Enjoy the show!
Computed particle density profile as a function of time.
The graph below shows a few snapshots from the animation.
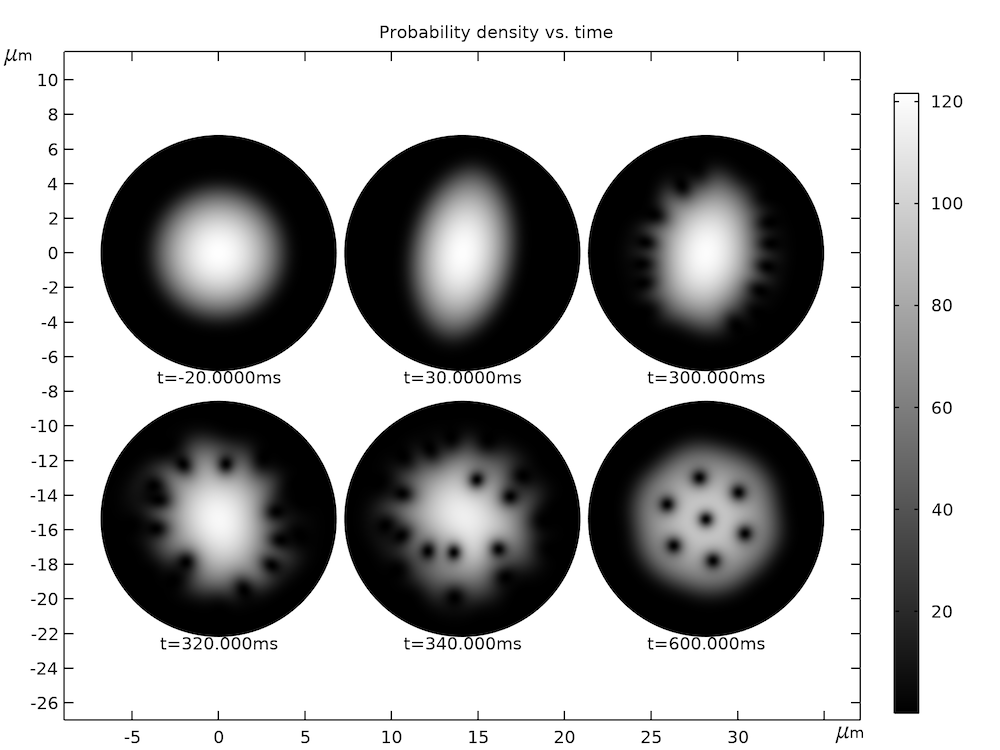
Computed particle density profile as a function of time.
Due to practical limitations on the optical imaging system in the experimental setup, it is not possible to obtain the images of the density profile as shown in the graph above while the atoms are still being trapped. Instead, in the experiment, the atoms are released from the trap and the cloud is allowed to freely expand for a duration of 25 ms to a size of about 300 um. The aspect ratio of the cloud also changes dramatically before and after the free expansion. An initial cigar shape becomes a final pancake shape, with the long and short dimensions swapped before and after the expansion. You should keep this in mind when comparing the simulated in-trap density profile with the published images of the after-expansion atom cloud.
Results Analysis
The time evolution process shown in the animation and graph above can be distilled to a single ellipticity parameter |\tilde\alpha|, which is obtained by fitting the particle density profile to a simple function to extract the major and minor axes of the ellipse R_X and R_Y and then applying Eq. (7). For the simulated in-trap density profiles shown in the graph above, the Thomas–Fermi approximation provides a good fit function. By fitting it to the density profile at each time point, we can compute the ellipticity parameter |\tilde\alpha| as a function of time. The graph below shows the result (blue dots). The time scales of the initial oscillation and the eventual collapse of |\tilde\alpha| agree well with the data shown in Fig. 3 of Ref. 1. The magnitude is slightly different, but this is understandable given the possible shape change before and after the free expansion as discussed above.
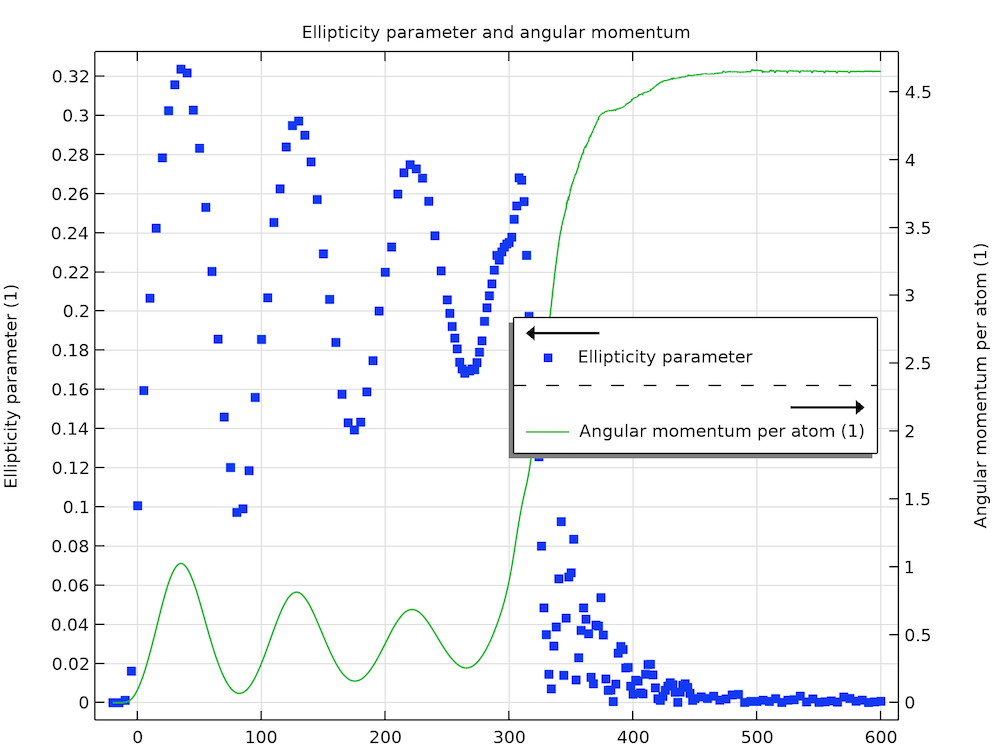
Ellipticity parameter and angular momentum per atom (unit of \hbar).
Another important parameter that characterizes the transition from an oscillating/rotating full cloud to a vortex lattice is the angular momentum, which is also plotted in the graph above (green curve). The general behavior of initial oscillation and eventual gaining of a certain angular momentum in proportion to the number of vortices is consistent with the simulation results by Tsubota et al. (Fig. 3 in Ref. 2). However, here the time scale of our result is much closer to the experimental data.
Optimization
The Optimization Module is used for fitting the particle density profile. To check the quality of the fit, we can plot the contours of the fit data (simulated density profile) and the contours of the fit function (Thomas–Fermi density profile) together and compare them, as shown in the graph below.
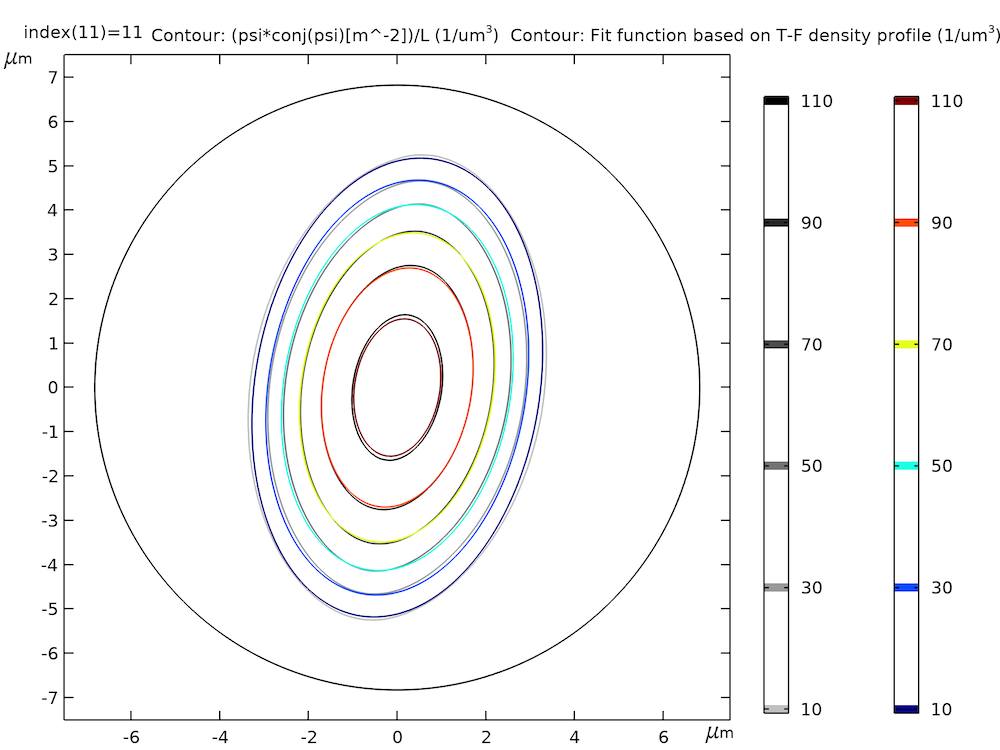
Fit data (simulated density profile, grayscale) and fit function (Thomas–Fermi density profile, color).
The setup of the optimization scheme starts with the definition of the fit parameters as shown in the screenshot below.

Fit parameters for the optimization scheme.
These are the first axis RXfit, the second axis RYfit, the tilt angle thetafit, and the peak density rho0fit for the fit density profile. Also defined are an index parameter index for solution reference and the fit value for the ellipticity parameter alphafit, as computed using the fit parameters and Eq. (7).
The fit function based on the Thomas–Fermi density profile is defined as a variable fit_fn. Then the difference between the computed data and the fit function is squared and averaged over the simulation domain to serve as the objective to be minimized by the optimization study. In order to prevent the magnitude of the objective from becoming too large for the optimizer to handle, we scale the difference by the Thomas–Fermi peak density (\rho_0 in Eq. (10)) so that the resulting objective is close to the order of unity. This is defined as the variable q0 in the screenshot below.

Fit density profile and objective to be minimized by the optimization study.
The objective q0 and the 4 fitting parameters are then used in the optimization study settings. Each of the fitting parameters is given an appropriate initial value, scale, and bounds using the value from the Thomas–Fermi approximation. See the screenshot below.
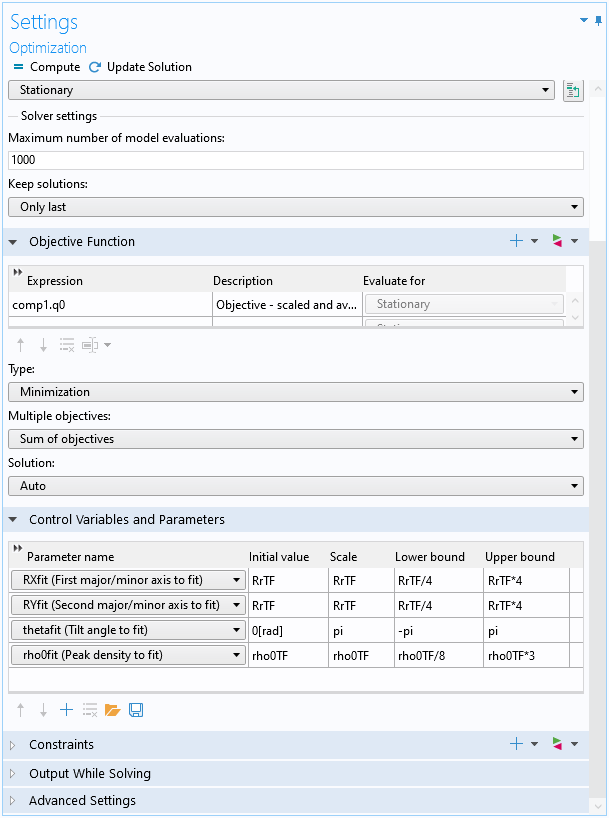
Optimization study settings.
The solution at each time point is picked out for fitting by first setting up a parametric sweep with the parameter index, and then in a dummy Stationary study step, the Values of variables not solved for section is set up to use the index parameter to select the time-dependent solution at each time step. See the screenshots below.
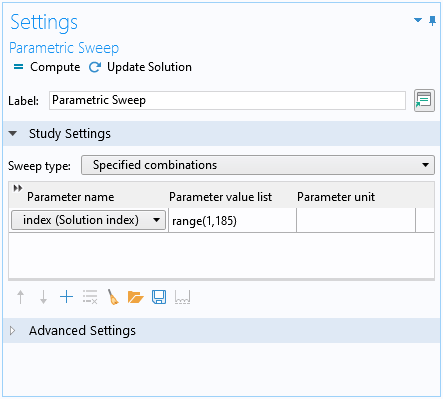
Parametric sweep with the parameter index.
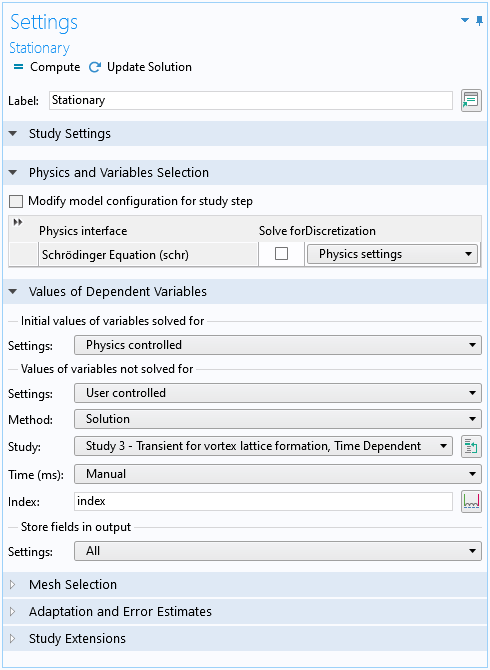
Dummy Stationary study step with the Values of variables not solved for section set up to use the index parameter to select the time-dependent solution at each time step.
Concluding Remarks
We have demonstrated the Schrödinger Equation physics interface with a model of the dynamical process of vortex lattice formation in a Bose–Einstein condensate formed by trapped cold atoms. We would love to hear about you how you use this physics interface for other interesting phenomena in the comments below!
Try It Yourself
Try modeling vortex lattice formation in a rotating Bose–Einstein condensate by clicking the button below, which will take you to the Application Gallery, where you can download the MPH file.
References
- L. I. Schiff, Quantum Mechanics, McGraw Hill, ed. 3, 1968.
- P. Harrison, Quantum Wells, Wires and Dots, Wiley, ed. 3, 2009.
- E.P. Gross, “Structure of a quantized vortex in boson systems”, Il Nuovo Cimento, vol. 20, no. 3, pp. 454–457, 1961.
- L.P. Pitaevskii, “Vortex lines in an imperfect Bose gas”, Sov. Phys. JETP, vol. 13, no. 2, pp 451–454, 1961.
- K. W. Madison, F. Chevy, V. Bretin, and J. Dalibard, “Stationary States of a Rotating Bose-Einstein Condensate: Routes to Vortex Nucleation”, Phys. Rev. Lett., 86, 4443, 2001.
- M. Tsubota, K. Kasamatsu, and M. Ueda, “Vortex lattice formation in a rotating Bose-Einstein condensate”, Phys. Rev., A 65, 023603 (2002).
- S. Choi, S. A. Morgan, and K. Burnett, “Phenomenological damping in trapped atomic Bose-Einstein condensates”, Phys. Rev., A 57, 4057, 1998.


Comments (2)
Giuseppe Longo
November 24, 2020A very good task
Chien Liu
November 24, 2020 COMSOL EmployeeThank you Giuseppe! Chien