
If you’re not an electrochemist, chances are you’ve never come across cyclic voltammetry. But look at any electrochemical journal, conference proceedings, or company website for manufacturers of electrochemical sensors. Somewhere near the front, you’ll see a distinctive “double-peaked” graph.
Why Perform Cyclic Voltammetry?
The “double-peaked” graph looks like this:
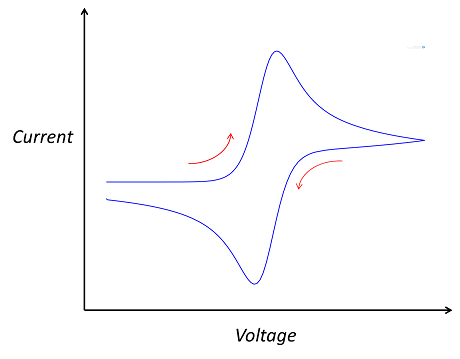
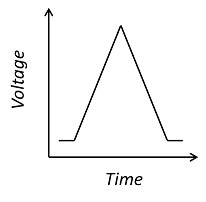
This is a cyclic voltammogram, in which the current (“ammetry”) is plotted against the voltage applied to an electrochemical cell. The voltage is swept up and down across a range of values to successively drive the opposite directions of an electrolysis reaction:
Cyclic voltammetry is a very widely used technique for the interrogation of physics and chemistry at the interface between an electrode and an electrolyte, such as a saline solution. Electroactive surfaces are common to all electrochemical devices, including common energy extraction devices like batteries and fuel cells, as well as electrochemical sensors, such as those used by diabetics to monitor blood glucose concentration. Furthermore, the chemistry of the electrode-electrolyte interface is still not fully understood and is an active field of academic research.
Voltammetry can be valuable for device verification and design because a single scan contains a great deal of information about the chemical and physical behavior of a system. Also, voltammetry can be the fundamental mode of operation for a sensor, since the measured current will be linearly dependent on the concentration of the analyte in a well-designed system. Chemical modification of electrode materials can make voltammetry specific to individual biological compounds or toxic gases in a mixture, and it is a cheap technique where advances such as screen-printed electrodes allow for “disposable electrochemistry”.
For design and research, the great virtue of voltammetry is the diversity of information that it provides. It illustrates the competition between the rate of electrolysis at the electrode surface and the rate of transport of the reacting chemical species to that surface by diffusion, and it can also yield valuable information of the mechanism and rates of chemical reactions in solution. By performing voltammetry at different scan rates, where the rate of change of the voltage in time is altered, we can observe different system timescales and so different physical phenomena.
Why Model Voltammetry?
For all its importance, voltammetry is a difficult technique to understand. All the real physical effects in the system are lumped into rather arcane current-voltage curves. Although experienced electroanalytical chemists may be able to intuitively “see” the chemistry in a voltammogram, it is essential to compare voltammetry to a theoretical prediction to get quantitative information from the experiments. Since electrochemical kinetics are frequently nonlinear and voltammetry is a transient problem, the theory is not admissible to analytical solutions, except in a few limiting cases, and so computer simulation is necessary.
Keeping the Model Simple
COMSOL’s new Electrochemistry Module includes an Electroanalysis interface tailored to modeling electroanalytical techniques like voltammetry. This interface assumes the presence of a large amount of supporting electrolyte; inert salt, such as potassium chloride, that is artificially added to the electrolyte in an electrochemical cell to increase its conductivity. Supporting electrolyte mitigates electric fields, which is advantageous because it simplifies both the experimental analysis and the underlying theory. We assume that only diffusion contributes to chemical species transport, because the solution is unstirred and the timescales are short enough that natural convection in the solution is not important. Under these conditions, the chemical species transport equations are linear and so much easier to solve.
Diffusion length scales over the typical duration of a voltammetry experiment are very short — often much less than 1 mm. For a traditional “macroelectrode”, shaped like a disk with a radius in excess of 1 mm, it is accurate to assume that diffusion is only significant in the direction normal to the electrode surface, and that the influence of the electrode edge can be neglected, so reactions and transport are uniform across the electrode surface. This makes voltammetric analysis a 1D time-dependent problem.
Setting up the Cyclic Voltammetry Model
To facilitate the definition of the transient applied voltage and its influence on the rate of the electrolysis reaction, the Electroanalysis interface contains a pre-built “Electrode Surface” feature that allows the potential window and scan rate of the voltammogram to be set directly. This feature also automatically implements the Butler-Volmer equation for the electrode kinetics, but, as for any feature in COMSOL Multiphysics, a user-defined expression for these kinetics can be substituted. The associated Cyclic Voltammetry study then automatically solves the corresponding time-dependent problem using suitable numerical methods to integrate the time-dependent diffusion equation. A range of scan rates can be studied in a single computation using the “Parametric Sweep” feature.
Looking at the Results
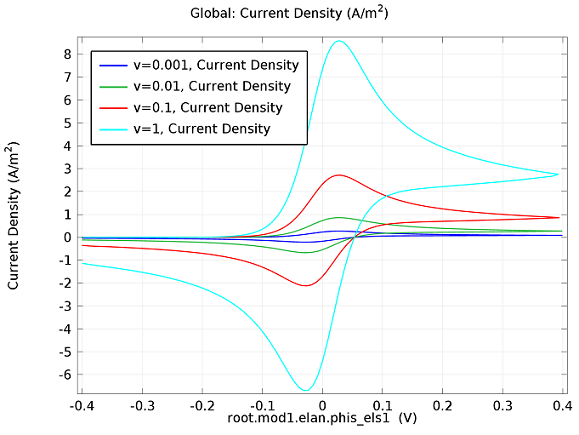
In the figure above we can see four predicted voltammograms recorded at four successive scan rates, from 1 mV/s to 1 V/s. These correspond to experimental durations from almost half-an-hour down to just over one second. The currents can be seen to increase with the scan rate, but the voltammograms have the same qualitative “double-peaked” appearance. The latter can be explained because, to begin with, the voltage is in a range where the forward reaction of the reactant is not driven, so there is negligible current. As the voltage is swept up, the reaction is accelerated, so the current increases. After some time, however, the reactant concentration is depleted by the reaction at the electrode surface. There is then a change of rate-determining process, so that the current becomes controlled by diffusion of the reactant to the surface, and thereby falls off again. A similar process occurs in reverse for the back reaction in which the product is reconverted to the original reactant as the voltage scans back to its starting point.
The increase in current density with scan rate occurs because a faster scan causes the diffusion layer to be established over a shorter distance. Because the concentration varies from bulk to zero over a narrower length, the diffusive flux is larger, hence so too is the current. The peak current should actually scale with the square-root of scan rate: checking this relation is a common verification method for experimental data to check that the measurement has not been corrupted by physical effects other than diffusion.
For sensor design we always want to maximize our current in order to maximize sensitivity, so this analysis can help in practical design of the electrochemical cell and chemical environment. Comparison of predicted and measured voltammograms enables determination of material properties and other system parameters that may be unknown, such as diffusion coefficients and reaction rates.
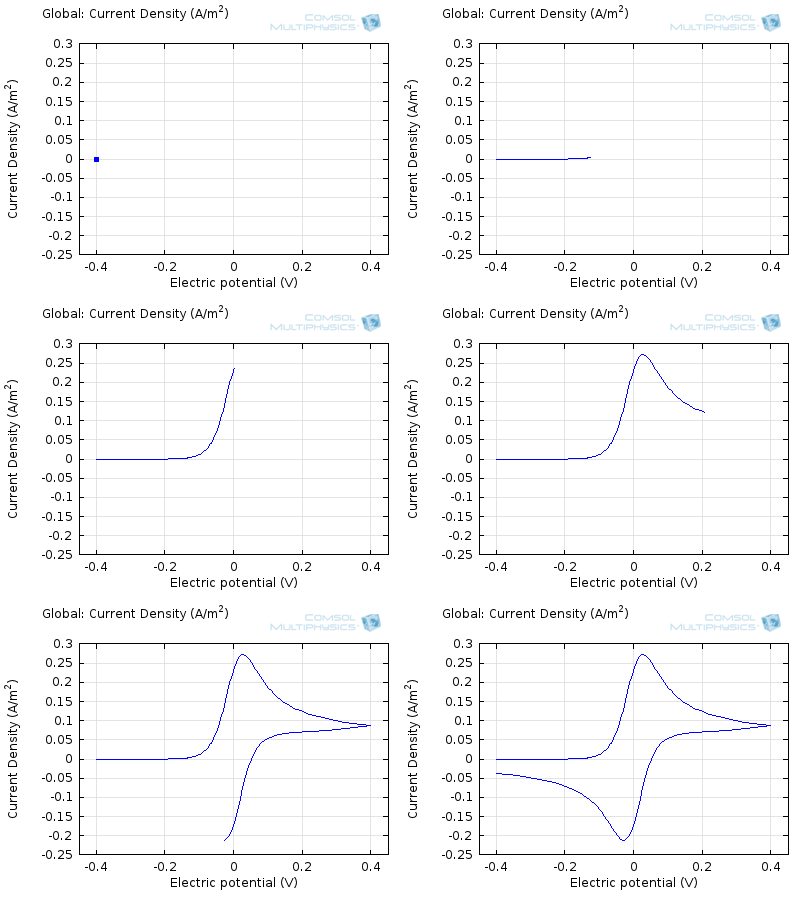
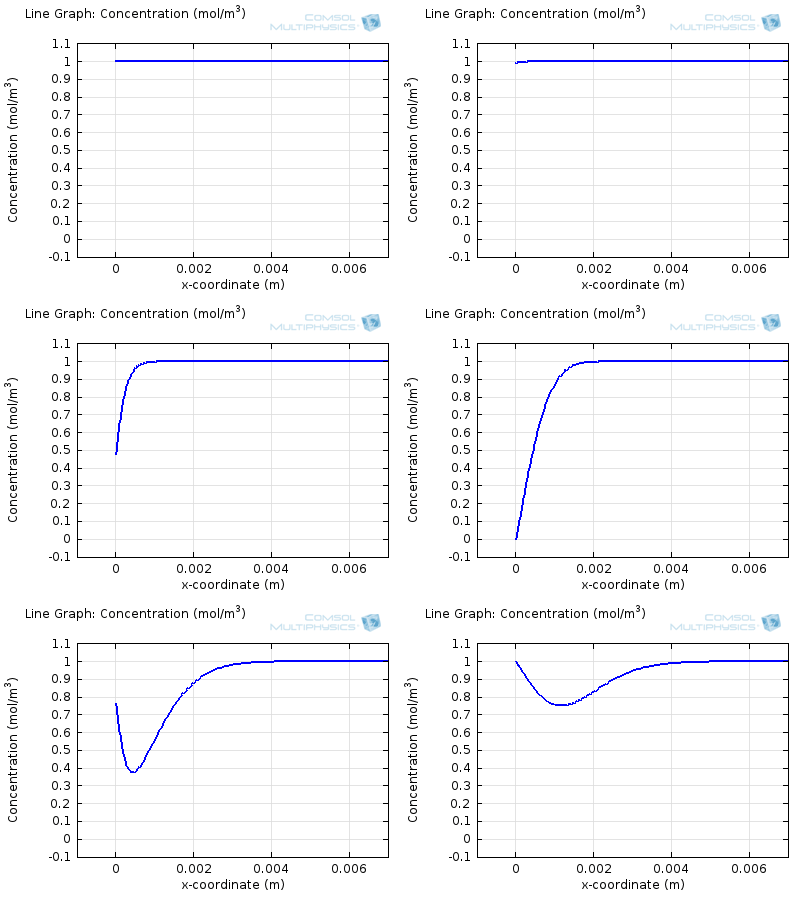
Try comparing the above animations to understand the relation between the current and the evolving concentration profile. Note how the concentration at the electrode surface (x = 0) is driven to zero as the current increases, then, once the surface concentration is zero, the concentration gradient relaxes under diffusion and the current relaxes as well. The concentration returns to its bulk value at the electrode surface as the current is inverted by the reverse reaction during the second part of the sweep.
Going Further
Since the Electroanalysis interface embeds electoanalytical modeling into the COMSOL Multiphysics environment, a powerful and flexible user interface for finite element methods, it is directly possible to extend the scope of this model. Follow-up chemical reactions of the electrochemically generated species can be included by adding a Reactions domain condition. A 2D or 3D model of the same process can be set up to study diffusion in a real system geometry. Multiple voltammetric cycles can be performed, or nonstandard voltage waveforms can be applied. Coupling to a fluid flow calculation with convection of the reacting species allows the investigation of hydrodynamic electrochemistry. We can also consider a range of related techniques like potential step chronoamperometry and electrochemical impedance spectroscopy via the same user interface.
Tip: Check out the Cyclic Voltammetry at an Electrode model in the Model Gallery.


Comments (9)
Valerio Lopez
June 20, 2013Did someone try to transpose this model, even with the same 1D approximations, to a 3D or 2D geometry?
Any convergence issues?
Tinto Alencherry
June 26, 2013Had any one tried creating cyclic voltammetry from equation based modelling. It would be so kind of you if some one could guide me in realizing cyclic voltammetry of electrodes through PDE based modelling.
Edmund Dickinson
June 28, 2013 COMSOL EmployeeValerio: We have tested the Electroanalysis interface and Cyclic Voltammetry study type with 2D and 3D examples. As for all models, you must make sure that the mesh is suitably fine in order to get an accurate result. You can see an example of this type of mesh refinement in the 2D example on Voltammetry at a Microdisk Electrode (http://www.comsol.com//model/voltammetry-at-a-microdisk-electrode-12877).
Tinto: In the past it was necessary to use equation-based modelling to describe voltammetry problems. Now, the new Electroanalysis physics interface means that the required equations are already implemented in COMSOL Multiphysics. As with any part of the software, you can still adapt the pre-defined equations with your own user-defined variables, or add extra terms to the equations we use.
Lasse Murtomäki
August 13, 2013Richard Compton from Oxford university has studied this: http://dx.doi.org/10.1016/j.jelechem.2009.10.017
Abstract
Electrochemical simulation via the solution of Fick’s Laws is a widely used technique to corroborate experimental results with well defined theory. This paper analyses use of ‘off-the-shelf’ finite element (FEM) software COMSOL Multiphysics™ in one, two and three-dimensional quantitative problems and under homogeneous and heterogeneous kinetic systems. Conclusions indicate that two-dimensional problems are within an order of magnitude of accuracy of finite difference simulations and analytical solutions, as long as the problem is well defined in the software and care is taken with regards to appropriate meshing and boundary conditions. Three-dimensional simulations relating to microdiscs result in steady-state current values not quantitatively compatible with experimental observations or analytical solutions.
Edmund Dickinson
August 13, 2013 COMSOL EmployeeLasse: I co-authored Prof Compton’s research paper which you cite, as well as this blog post. This paper was written in 2009 and its conclusions apply to version 3.5a of the COMSOL software. Since this time a wide range of improvements to automated physics settings and meshing have been introduced to COMSOL Multiphysics, enabling greater control and accuracy for electroanalytical modelling than was the case four years ago. I hope I have been able to describe some of these in the blog, and I would encourage your reappraisal of the COMSOL Multiphysics software in its contemporary version (v4.3b).
Christian Samanamu
November 10, 2013Good evening Dr. Dickinson
Our research group works in the area of electrocatalysts and we are interested in explore the help of COMSOL in understanding some of our electrode processes. I have sent an e-mail through the COMSOL contact web-page with some extra details.
Thanks for your attention.
Very best,
Christian
wang shuo
December 20, 2013Good evening Dr, Dickinson
I note that the concentration gradient relaxes under diffusion before the concentration reach zero, so does the current.
Edmund Dickinson
January 3, 2014 COMSOL EmployeeWang: this is because the CV and concentration profile images are two separate GIFs – depending on your browser, they may sometimes not synchronise. Try refreshing the page, or downloading the GIFs to view offline.
Bhaskara Sreenivas
September 18, 2021Could someone support me:
Background: We are working on neural electrodes (Case 1: Gold, Case 2: Platinum) to stimulate the brain surface. We are also aware that the current through the Gold or Platinum electrode is limited by reversible charge injection capacity.
1. We want to simulate it in COMSOL Multiphysics and see what is the maximum current that can be transferred from Gold (Case 1) or Platinum electrode (Case 2) using cyclic voltammetry analysis.
2. Also, want to see how a Gold or Platinum electrode degrades with respect to an increase in the current?
Thanks,
Sreenivas