
Stress corrosion is a type of degradation of a metal surface that is exposed to a corrosive environment and is subjected to mechanical stress, either residual or applied. This phenomenon can be difficult to predict and detect in underground pipelines, which could result in costly leaks and damage to the surrounding area. When modeling stress corrosion, a major challenge is coupling the mechanical and electrochemical interactions. Here, we look at how to overcome this challenge in the COMSOL Multiphysics® software.
Stress Corrosion in Underground Pipelines
Underground steel pipelines in the oil and gas industry are often subjected to complex stress/strain conditions. Tensile stress comes from various sources, such as internal pressure and soil movement. In addition, fabrication and welding could produce residual stresses, causing further strain on the structure.
The example presented in this blog post shows the effect of elastic and plastic deformation on the corrosion of a pipeline and is based on Ref. 1. The pipe is made of high-strength alloy steel with a small elliptical corrosion defect in the center. The pipe is surrounded by soil, which acts as an electrolyte medium.
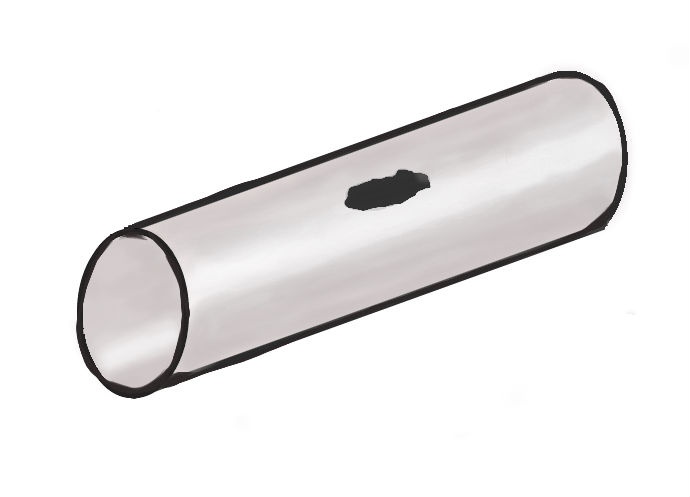
Illustration of an underground pipeline prone to corrosion due to stress.
Modeling Stress Corrosion in COMSOL Multiphysics®
The elastoplastic stress simulations are performed using a small-strain plasticity model and von Mises yielding criterion. The Solid Mechanics interface along with the user-defined isotropic hardening model are used here. The hardening function, σyhard, is defined as:
where σexp is the experimental stress-strain curve, εp is the plastic deformation, σe is the von Mises stress, E is the Young’s modulus, and σys is the yield strength of the steel.
The Secondary Current Distribution interface is used to model the iron dissolution (anodic) and hydrogen evolution (cathodic) reactions that occur at the corrosion defect surface of the pipeline. The rest of the pipeline surfaces are assumed to be electrochemically inactive.
An anodic Tafel expression and cathodic Tafel expression are used to model the iron dissolution and hydrogen evolution reactions, respectively, and are defined as:
where i0,a/c is the exchange current density, Aa/c is the Tafel slope, and ηa/c is the overpotential for the anodic and cathodic reactions, respectively.
The overpotential is defined as:
where φs is the electric potential; φl is the electrolyte potential; and Eeq,a/c is the equilibrium potential for the anodic and cathodic reactions, respectively.
The equilibrium potential for the anodic reaction accounts for both the elastic and plastic deformation and is defined as:
where Eeq0,a is the standard equilibrium potential for the anodic reaction, ΔPm is the excess pressure to elastic deformation, Vm is the molar volume of steel, z is the charge number for steel, F is the Faraday constant, T is the absolute temperature, R is the ideal gas constant, ν is an orientation-dependent factor, α is a coefficient, and N0 is the initial dislocation density.
The exchange current density for the cathodic reaction is defined in terms of the von Mises stress as:
where i0,c,ref is the reference exchange current density for the cathodic reaction in the absence of external stress/strain.
Analyzing the Simulation Results
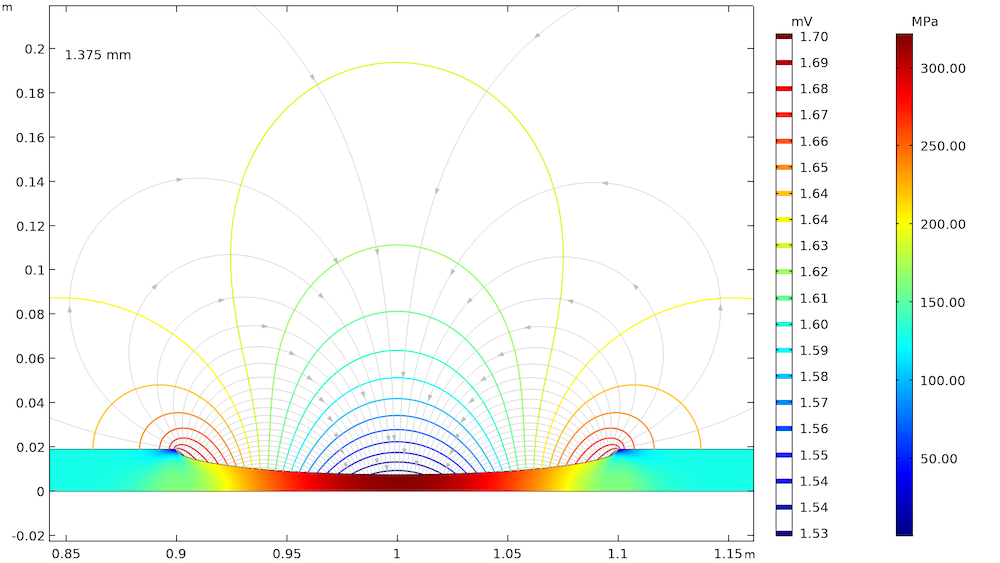
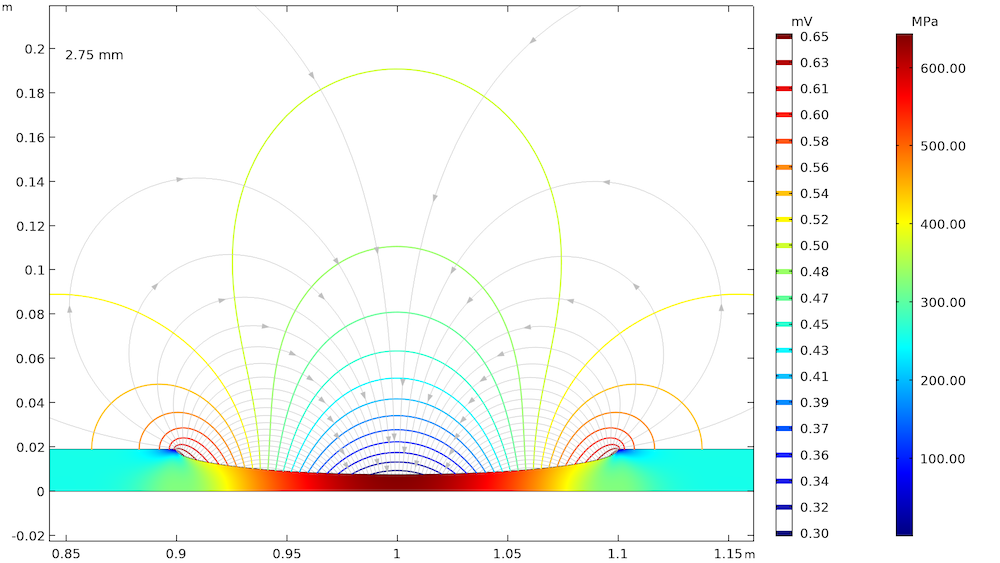
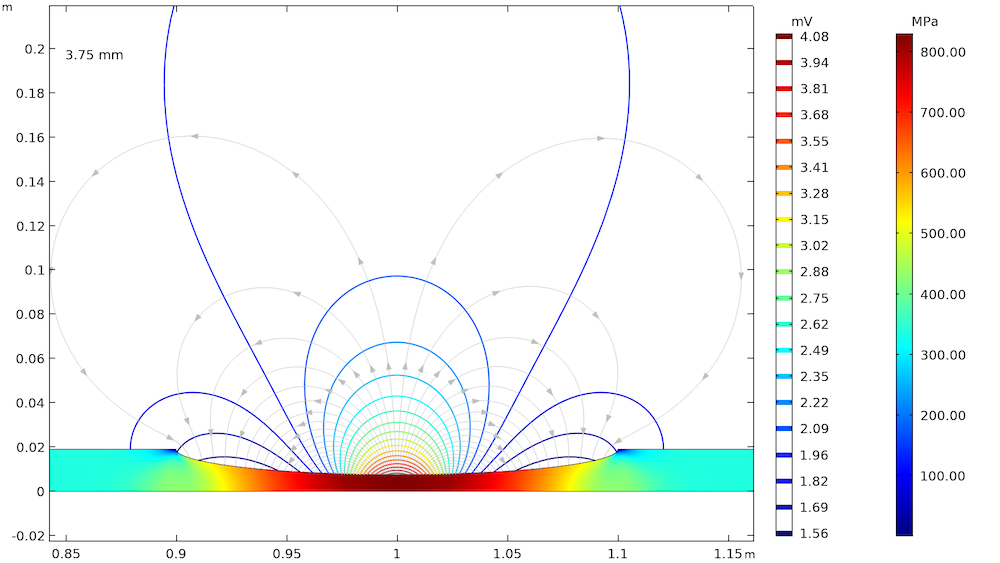
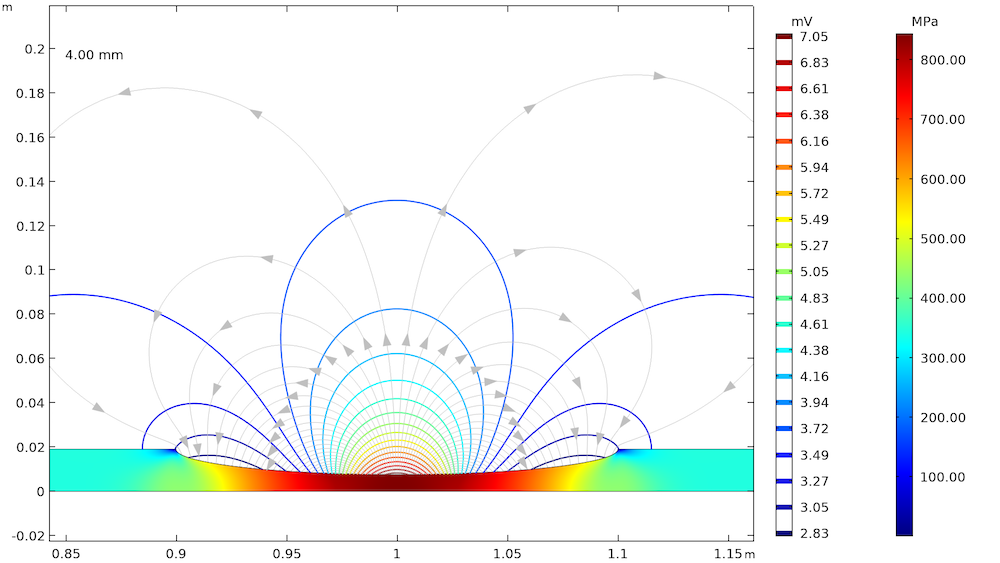
The effect of elastic and plastic deformations on corrosion is demonstrated by using different prescribed displacements: 1.375 mm, 2.75 mm, 3.75 mm, and 4 mm. The von Mises stresses in a solid steel pipe and the resulting potential distribution and current streamlines in the adjacent soil are shown below.
The von Mises stresses in a steel pipe as well as the potential distribution and current streamlines in the adjacent soil for the four prescribed displacements.
The von Mises stress increases with an increase in the prescribed displacement and it is found to be the maximum at the center of the corrosion defect. For the lower prescribed displacements of 1.375 mm and 2.75 mm, the entire corrosion defect is observed to be in the elastic deformation range (where the stress is lower than the yield strength of high-strength alloy steel, which is 806 MPa). For the prescribed displacements of 3.75 mm and 4 mm, it is observed that the local stress, particularly at the center of the corrosion defect, exceeds the yield strength of the alloy steel. The result is plastic deformation at the center of the defect, while the deformation in the other areas of the defect remains in the elastic range.
The potential distribution over the soil domain is plotted above in terms of isopotential lines for the potential difference between the local electrode potential and a base reference potential of -0.725 V measured versus the standard calomel electrode (SCE). The isopotential lines indicate a potential difference of 0.17 mV and 4.22 mV along the length of the corrosion defect for the prescribed displacements of 1.375 mm and 4 mm, respectively. The current streamlines shown in the above plots indicate the direction and distribution of the current density in the soil domains.
It can be seen that the current streamline direction is reversed for the higher prescribed displacements of 3.75 mm and 4 mm near the corrosion defect. The potential distribution and current streamlines over the soil domain indicate that the potential distribution is uniform (even near the corrosion defect) for the lower prescribed displacements of 1.375 mm and 2.75 mm. However, the potential distribution is nonuniform for the higher prescribed displacements of 3.75 mm and 4 mm, especially near the corrosion defect. To further demonstrate these results, the local electrode potential measured versus the SCE along the length of the corrosion defect for all prescribed displacements is shown below.
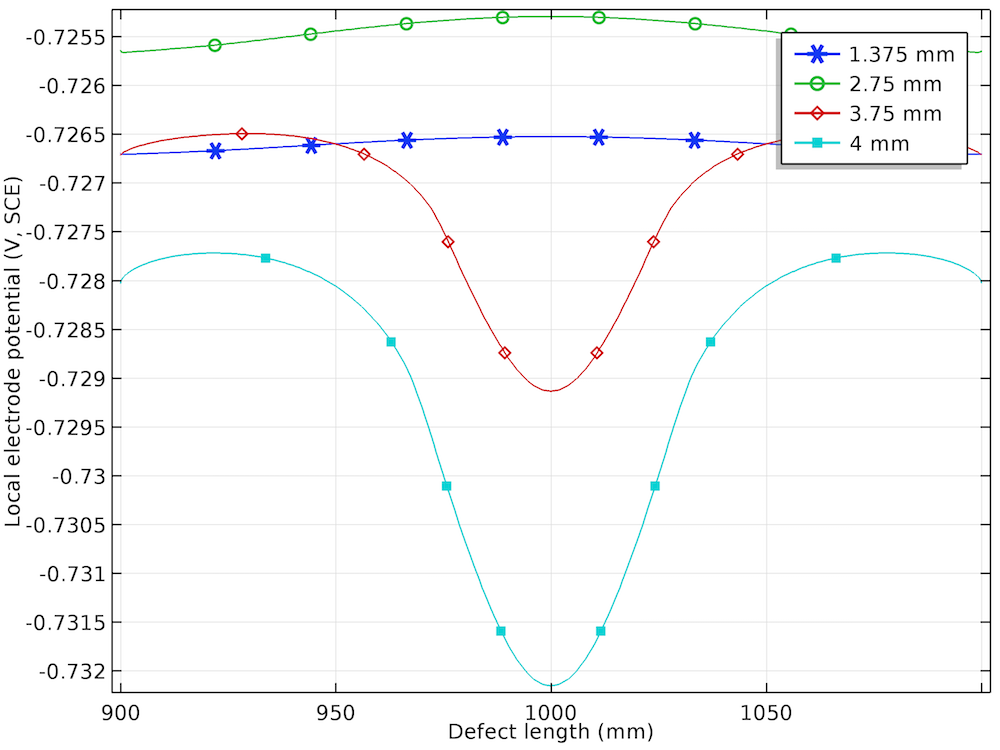
The local electrode potential distribution (measured versus SCE) at the corrosion defect for four displacements.
The plot of the local electrode potential (V, SCE) along the length of the corrosion defect confirms the uniform distribution for the lower prescribed displacements and nonuniform distribution for the higher prescribed displacements. The local electrode potential is found to be more negative at the center of the corrosion defect than at the sides of the corrosion defect for the prescribed displacements of 3.75 mm and 4 mm. This behavior is attributed to the more negative equilibrium potential of the anodic reaction in the plastic deformation range at the higher prescribed displacements.
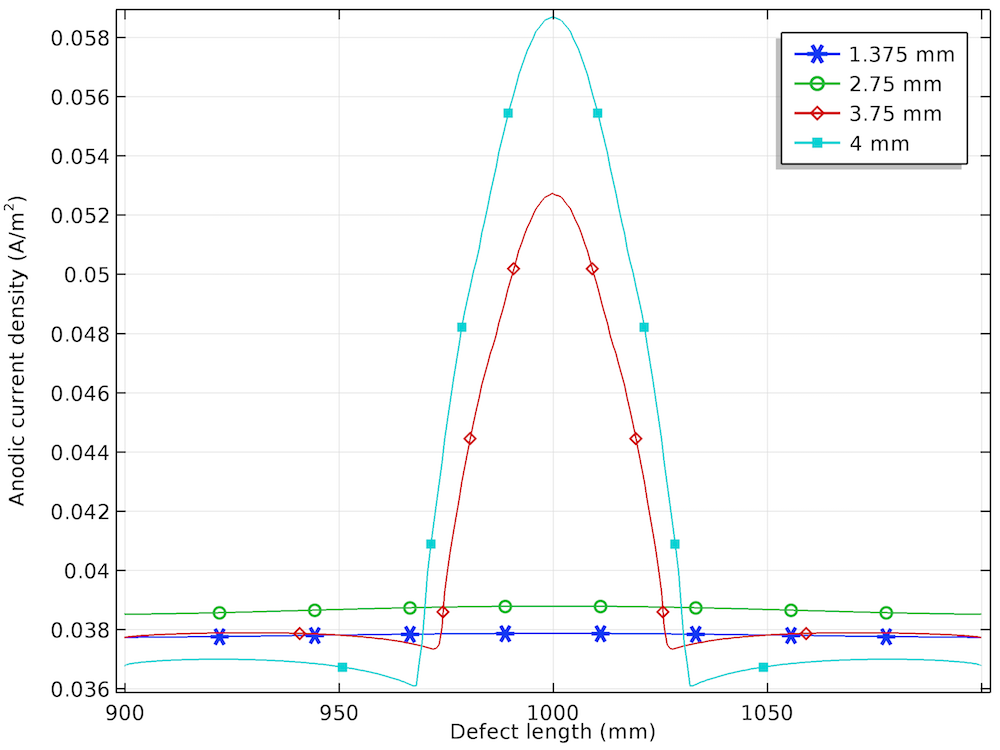
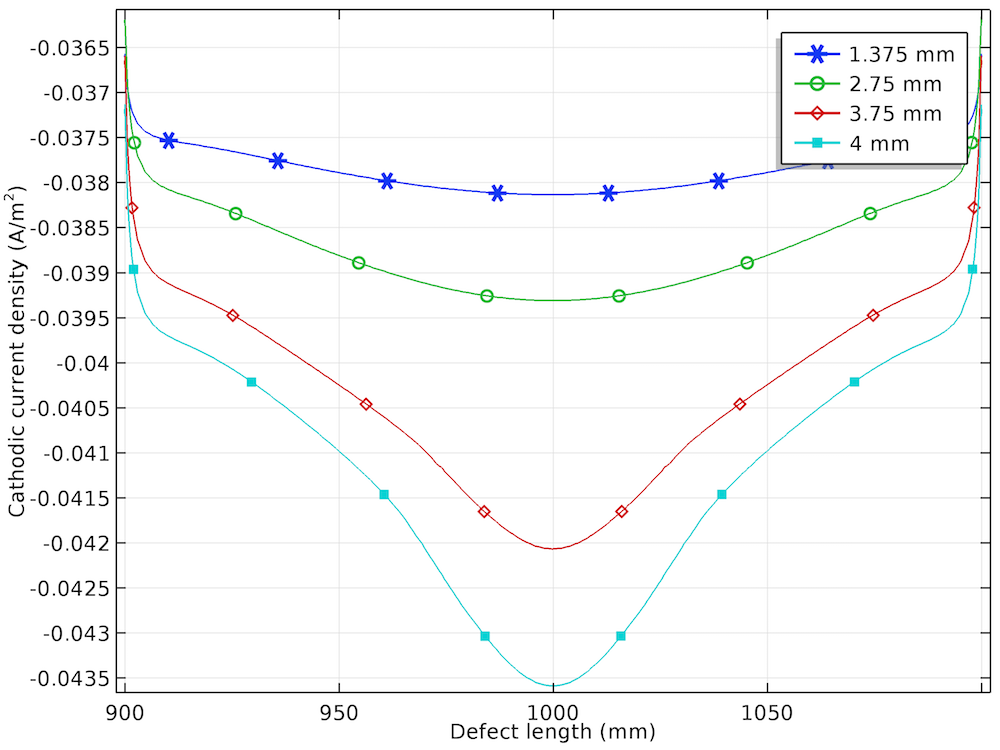
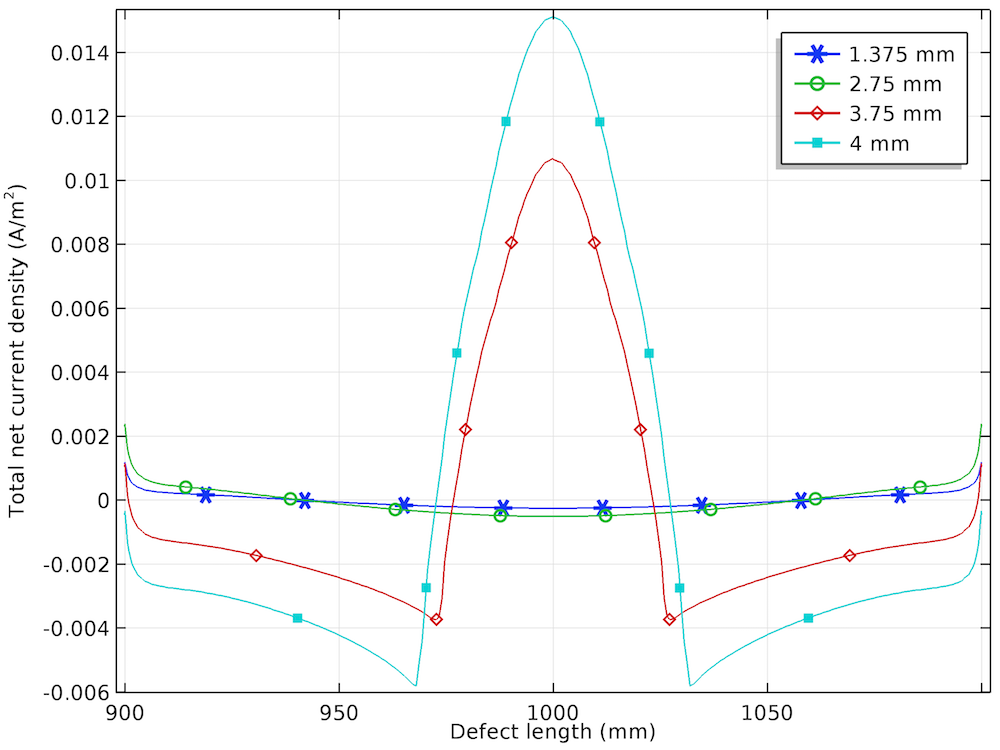
The anodic, cathodic, and total net current density distribution along the length of the corrosion defect is shown below for the different prescribed displacements.
The anodic (left), cathodic (center), and total net (right) current density distributions for the four displacements.
Similar to the local electrode potential distribution, the variation in anodic current density is found to be uniform for the lower prescribed displacements and nonuniform for the higher prescribed displacements. The increase in the anodic current density at the center of the corrosion defect for the prescribed displacements of 3.75 mm and 4 mm is attributed to the plastic deformation observed in that region.
The cathodic current density increases negatively with an increase in the prescribed displacement and is found to be the most negative at the center of the corrosion defect. The nonuniformity in the cathodic current density is also found to increase with an increase in the prescribed displacement.
The total net current density is the sum of the anodic and cathodic current density, and it is found to be close to 0 for the lower prescribed displacements of 1.375 mm and 2.75 mm. For the higher prescribed displacements of 3.75 mm and 4 mm, the total net current density is found to be anodic at the center of the corrosion defect and cathodic at both sides of the defect.
The results indicate that the higher prescribed displacements lead to plastic deformation in the steel pipe, which results in a more negative local electrode potential and a higher anodic current density, and hence faster pipeline corrosion. By performing simulations like this one, you can gain further insight into stress corrosion to predict the longevity of a structure and develop better corrosion protection methods.
Next Steps
Try modeling stress corrosion by clicking the button below. Once in the Application Gallery, you can log into your COMSOL Access account and download the MPH file as well as a tutorial for this model.
Learn more about corrosion in the following blog posts:
References
- L. Y. Xu and Y. F. Cheng, “Development of a finite element model for simulation and prediction of mechanoelectrochemical effect of pipeline corrosion,” Corrosion Science, vol. 73, pp. 150–160, 2013.




Comments (0)