
The greenhouse effect has made it necessary for scientists to develop combustion processes that minimize the accumulation of carbon dioxide in the atmosphere. Possible fuels in these processes include biomass and other biofuels, which recycle carbon within a short timescale. But there’s a downside: Combustion of these materials produces carbon and ash particles that must be removed from the exhaust. To improve particle filtration, researchers studied electrostatic filter designs using models that were validated by comparing them to experimental data.
How Does an Electrostatic Precipitator Work?
It’s all in the name: An electrostatic precipitator filters carbon particles out of exhaust via static electricity. The electric filter component charges and accelerates particles, which accumulate and collect on plates in the precipitator that can then be removed. This device can be attached to chimneys and clean flue exhaust, for instance.
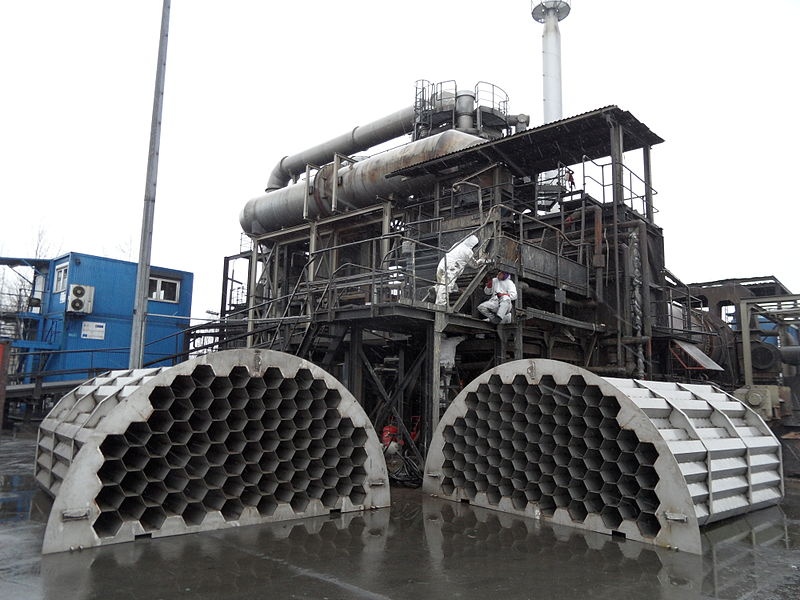
An electrostatic precipitator at an incineration plant in Poland. Image by LukaszKatlewa — Own work. Licensed under CC BY-SA 3.0, via Wikimedia Commons.
In a typical electrostatic precipitator, exhaust released through a flue goes through two electrodes, usually in the form of metal bars, plates, or wires inside a pipe or smokestack. One of the electrodes is charged with a high negative voltage, which is passed to the smoke particulates so that they gain a negative charge in turn. The second electrode, located further down the pipe, has a different voltage — usually grounded — which creates a strong electrical field between the two, thus leading to an acceleration of the negatively charged particles. Consequently, the particles are attracted by the grounded electrode and collected there until removal and disposal.
Seeking a way to improve and further develop the charging mechanism of an electrostatic precipitator, specifically the air ionization process in the electric filter, researchers Donato Rubinetti and Josef Wüest from the Institute of Biomass and Resource Efficiency at the University of Applied Sciences and Arts Northwestern Switzerland in Windisch, Switzerland, collaborated with emission-reduction company OekoSolve. They presented their findings at the COMSOL Conference 2017 Rotterdam.
Numerical Modeling of an Electric Filter in COMSOL Multiphysics®
The research team built an electrostatic precipitator model with the COMSOL Multiphysics® software and the add-on CFD Module. The model involves the interdependent phenomena of fluid mechanics, particle dynamics, and electrostatics. The model uses the Electrostatics interface, a fluid flow interface, PDE interfaces, and the Particle Tracing for Fluid Flow interface.
In a previous paper from the COMSOL Conference 2015, the group explained how they developed the electrostatics model. They initially determined the forces on the particles (Coulomb force vs. drag force) as well as where to place the electrode to optimize the capture and charging of particles.
In the paper from the COMSOL Conference 2017, the researchers discussed their test case based on that model. The physical and numerical modeling practices are identical to the previous paper, except for the geometry. To obtain the acceleration that triggers the removal of particles, they were able to achieve a broad range of space charge density across the geometry of the filter. This distribution was modeled using Poisson’s equation and the transport equation for electric charge.
Modeling an Electrostatic Filter in 2D
As represented below in both 3D and 2D, point number 5 is the electrode where the particles are negatively charged and numbers 1 through 4 are the positively charged rings that the particles are drawn to as the exhaust travels through the cylinder.
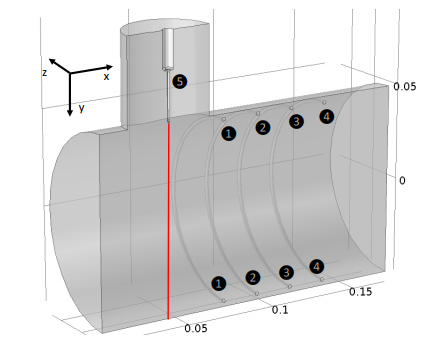
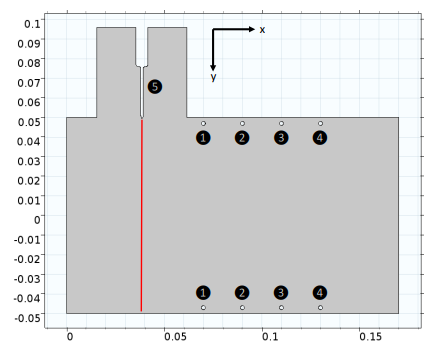
3D (left) and 2D (right) representations of the electric filter model. Images courtesy Rubinetti, Wüest, and OekoSolve AG and taken from their COMSOL Conference 2017 Rotterdam paper.
By setting up a numerical model, the researchers were able to analyze the electrical field strength for each axis. They performed 2D and 3D simulations, comparing the distributions of the electric field.
Because the 3D simulation amounted to a total of 1.6 million mesh elements and the 2D simulation approximately 300,000 mesh elements, the team wanted to find out if the 2D model would be sufficient in further studies for quicker computations. They confirmed that the 2D model is suitable for a qualitative understanding of the process and realistic enough to produce accurate results.
Setting Up the Experimental Test Rig Validation Model
After confirming the suitability of the 2D model for their experiments, the research team set up an experimental validation model. They verified this model using experimental data obtained from a test rig.
In the schematic below, the experimental setup for the test rig is shown, with electrode P3 and measurement ring units M1 through M4, with C as the current starting from the top. The emitting electrode was given a variable electric potential from -2 kV to -30 kV. Due to the ionization and acceleration of the plasma layer, the electrical current can be observed and measured on the ground rings.
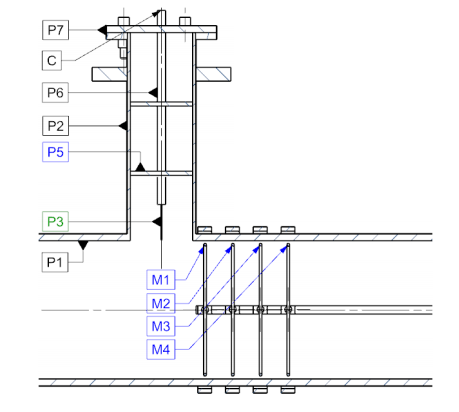
Laboratory test rig schematic. Image courtesy Rubinetti, Wüest, and OekoSolve AG and taken from their COMSOL Conference 2017 Rotterdam paper.
Comparing the Results
Let’s take a look at the 2D electrical field strength results in the numerical model. In the image below on the left, the electric field lines indicate that there is a decrease in intensity from ring 1 to ring 4. The electrical field strength is depicted as blue in color because the current is so strong near the electrode before being pulled through the rings.
In the image on the right, we can see a close-up view of the electrode. Even in the close-up, the electrical field strength dissipates quickly, as the strongest area (red) is a thin line. These results demonstrate the feasibility of running 2D simulations, because they accurately show the electrical field strength at the most important part of the process close to the electrode.
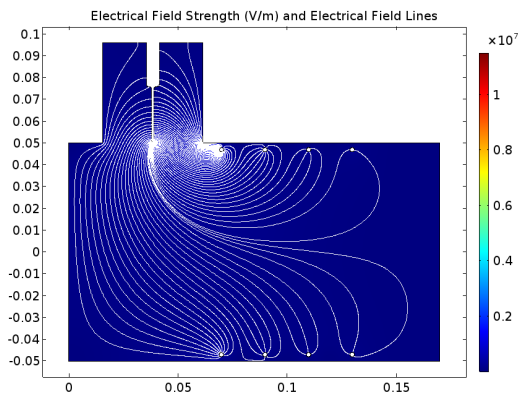
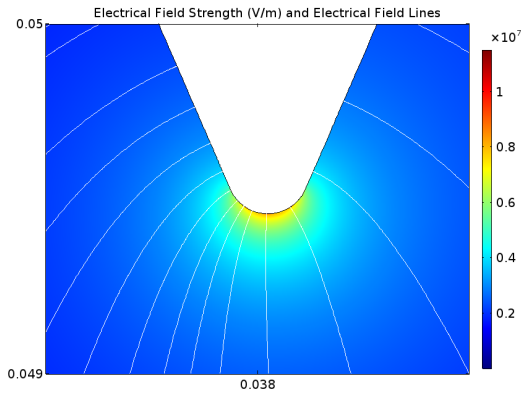
Electrical field strength and field lines (left) and a close-up view near the electrode (right). Images courtesy Rubinetti, Wüest, and OekoSolve AG and taken from their COMSOL Conference 2017 Rotterdam paper.
While 2D simulation is effective for observing field strength, the researchers could only compare the measured electrical current to a certain extent because of a dimensional mismatch. The research team dedimensionalized the results to get a closer look.
As shown below, in the overview of all measurements (M1–M4) and simulations (S1–S4), the discrepancy between the results can be explained by the dimensional mismatch, as well as some other factors from the test rig setup. However, we can see in the simulation and measurements that the first ring differs significantly from the fellow rings that are closer to each other — meaning it’s still possible to predict the behavior of the physics when reduced to a 2D arrangement.
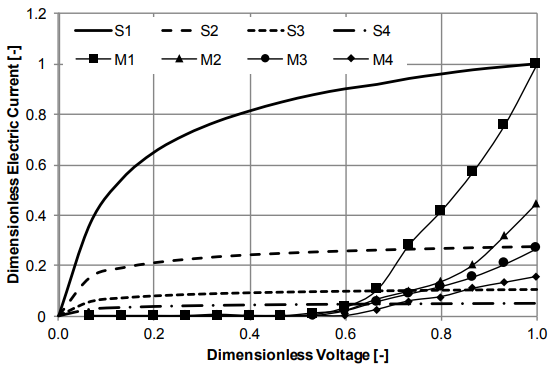
Comparison of the simulation and measurements. Image courtesy Rubinetti, Wüest, and OekoSolve AG and taken from their COMSOL Conference 2017 Rotterdam paper.
Since the COMSOL Conference 2017 Rotterdam, the researchers have resolved the mismatch and added the dimensions back into the model. They’ve also focused more intensely on the electric aspect of the simulation, especially on how the ionization processes change with temperatures up to 1000 K. Having built an axisymmetric test rig in order to get a quantitative agreement between the experiments and the model, they also built a 2D axisymmetric model.
The new test rig helped them test the behavior of the electrode by:
- Placing the electrode in line with the cylinder axis
- Changing the voltage of the electrode up to 30 kV
- Measuring the current on the rings
As we can see below, the experiments now match the simulation results much more closely:
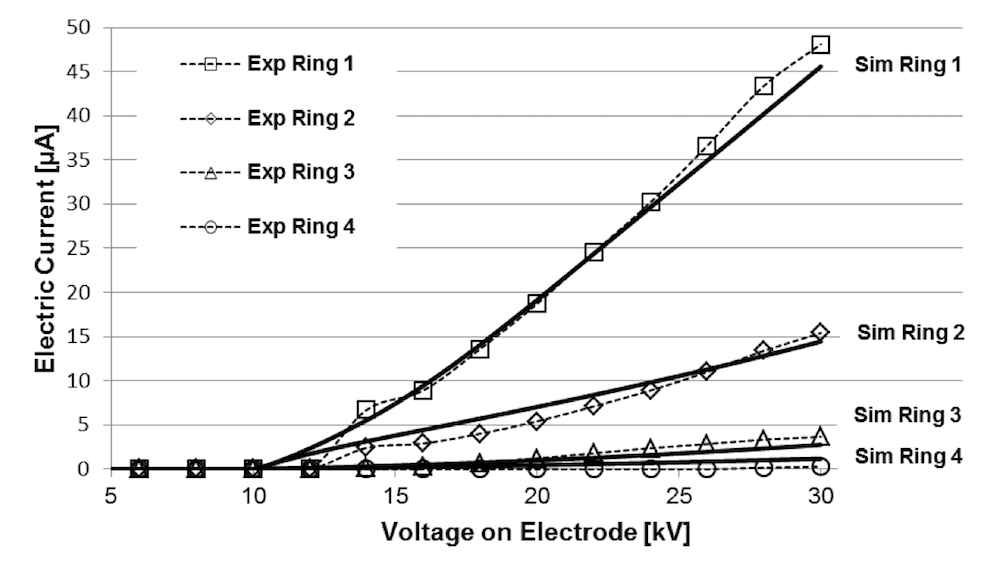
Comparison of the new validation model and measurements. Image courtesy Donato Rubinetti.
The team was able to validate the model results and modeling approach, since, as shown in the animation below, the current only started to flow above approximately 12 kV.
An animation of the updated validation model results. Animation courtesy Donato Rubinetti.
What’s Next?
From the test case to the industry-relevant model, the research team proved that multiphysics modeling can help accelerate further research and development of particle control technologies. As demonstrated, 2D cases are sufficiently accurate for insights into space change distribution within a domain.
Could further simulations provide more groundbreaking insights? In their paper, the team focused on the type of electric field that is given by the potential difference between electrodes. While the current model does not account for the influence of particles on the electric field, a second approach may account for this impact. Established by a “cloud” of charged particles, the new approach could account for a more dynamic field, moving through all parts of the pellet burner until the particles are deposited on the collector.
Usually, the experiments only allow researchers to see the particles that are already deposited. Given more time and computational resources, Rubinetti says that a 3D simulation for the complete pellet burner system could help visualize the particle cloud clearer than ever before: They’d be able to see the actual path and interactions of the charged particles.
Long-term, Rubinetti says he wants to “further develop the electrostatic precipitator modeling approach to understand the influence of external convection on ionization processes, as well as include temperature dependencies for the particle-charging processes and fluid properties such as density and viscosity.” Based on the researchers’ promising results, they continue to see opportunities for improvement, setting goals to optimize particle control technology designs.
Further Resources
- Check out the paper from the COMSOL Conference 2017 Rotterdam: “Innovation of Combustion Particle Control Technologies Assisted by Numerical Modeling“
- Try out the Electrostatic Precipitator tutorial model
- Read more about electrostatics modeling: How to Create Electrostatics Models with Wires, Surfaces, and Solids


Comments (0)