
Previously in our Phase Space Distributions in Beam Physics series, we introduced probability distribution functions (PDFs) and various ways to sample from them in the COMSOL Multiphysics® software. Such knowledge of PDFs is necessary to understand how ion and electron beams propagate within real-world systems. In this installment, we’ll discuss the concepts of phase space and emittance as they apply to the release of ions or electrons in beams.
Ion and Electron Beams
A beam of ions or electrons is a group of particles with about the same kinetic energy that move in about the same direction. The total kinetic energy of each particle is usually much greater than the particle’s thermal energy at ordinary temperatures, giving the beam a good degree of directionality.
We’ll begin by examining a charged particle beam in 2D. Let the positive z-axis denote the direction of beam propagation (the axial direction) and the x-axis denote the direction perpendicular to the direction of propagation (the transverse direction). If this convention seems strange at first, remember that we’ll eventually discuss beams in 3D, and then it will be convenient to indicate the two transverse directions by x and y.
As mentioned earlier, a beam is characterized by a group of particles that have nearly the same direction and energy — emphasis on the word “nearly”! No real-world beam will have perfectly uniform velocities for all particles. In fact, almost all of the interesting mathematics involved in beam release and propagation relates to the small variations in position and velocity among the beam particles.
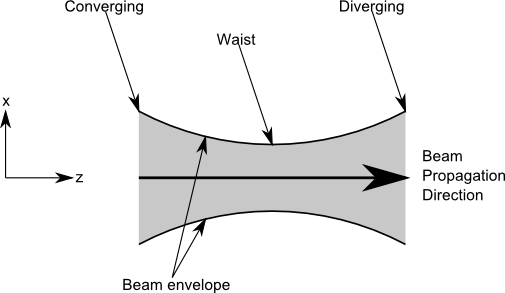
We can characterize the shape of a beam by the beam envelope, which indicates the outermost extents of the beam particles and gives us an idea of the beam’s shape. If the beam has a sharp cutoff — that is, the number density of particles in the beam abruptly decreases to zero at a well-defined location — the beam envelope may simply be a curve or surface that encompasses all of the particle trajectories. Very often, though, the density of beam particles decreases gradually out to a very large distance, so that there’s no clear border where the beam ends and the surrounding empty space begins. In that case, a beam envelope can be defined as the curve or surface that contains a sufficiently high percentage of the beam particles; 95% is quite common. A beam is converging if its envelope becomes smaller as the beam propagates forward; diverging if the beam envelope becomes larger; and at a waist if the beam has just finished converging and is about to start diverging. This is illustrated below.
Comparing Laminar and Nonlaminar Beams
The next plot shows some representative particle trajectories in a simple 2D beam. For now, space charge effects and external forces are neglected. Coordinate axis labels are shown to indicate the axial and transverse directions. We’ll treat this as an ideal sheet beam — that is, the beam extends infinitely in the out-of-plane (y) direction. The lines indicate the paths of beam electrons, with arrows indicating their velocities. The color expression along each line is the change in the x-coordinate, or transverse position, of an electron, also called its transverse displacement.

Note that the origin has been chosen so that the x-coordinates are measured from the center of the beam. It’s typically convenient to measure transverse particle positions from a point along the center line or nominal trajectory. The rate of change of the transverse position is the transverse velocity vx.
In the previous image and the following ones, the transverse displacement and velocity are rather exaggerated so they are easier to see. In practice, they are usually extremely small compared to the displacement and velocity along the beam axis.
The beam shown above is called a laminar beam because it has the following properties:
- There’s a one-to-one correspondence between transverse position and velocity. At any transverse position, the beam particles are not crossing paths. The one exception is for converging beams, where all particles will cross at exactly the same point.
- The transverse position and velocity are linearly proportional.
The latter of these properties is important because it prevents the initial property from being violated later on. See the following diagram of a converging beam in which the transverse position and velocity have a quadratic relationship instead of a linear one. Even though no trajectories are crossing initially (at z = 0), they cross at a later point. At any one of these intersection points, there are multiple transverse velocity values possible for a single transverse position, and thus the first property is violated.

In contrast, for a laminar beam, the particles never cross, unless the beam is converging so that all trajectories cross at a single point, as shown below.

In practice, there is usually a distribution of transverse velocity values at any transverse position. Particle trajectories are constantly crossing each other. Thus, real-world beams are nonlaminar, and the laminar beam discussed earlier is just an idealization. A more realistic transverse velocity distribution for a nonlaminar beam is illustrated below.

To better understand the difference between laminar and nonlaminar beams, let’s look at their phase space distributions. Phase space distributions can take on many forms, but here we’ll examine the particles as points in a 2D space in which the axes are transverse position and velocity. (We could alternatively use position and momentum as the two axes. This changes the distribution’s dimensions but doesn’t fundamentally change its shape.) Plotting these phase space distributions in COMSOL Multiphysics is easy using the Phase Portrait plot type.
First, let’s examine the phase portrait for a laminar beam. The following plot is taken at a releasing boundary, at the time t = 0.
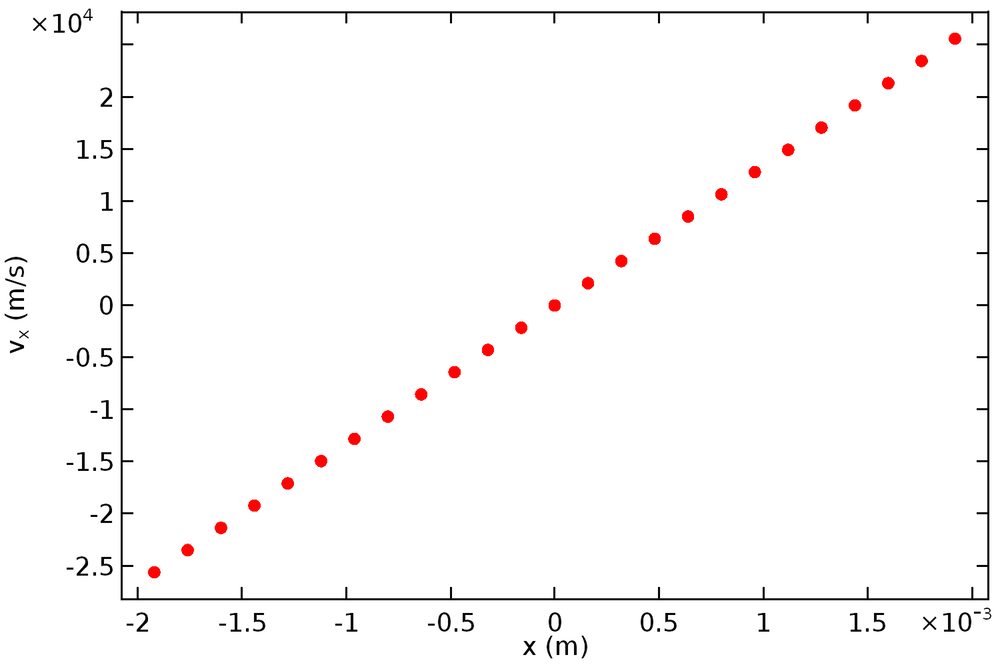
As expected, the points form a straight line that passes through the origin. (Remember that, by definition, the transverse position and velocity in a laminar beam have a linear relationship.) The next plot is a phase portrait for the nonlaminar beam.
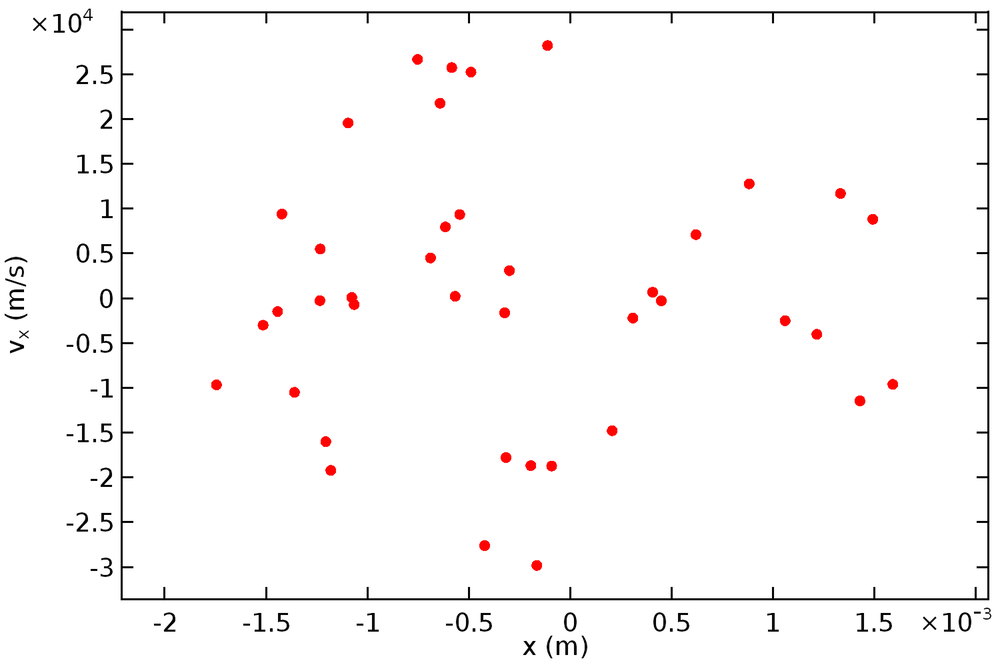
The points no longer lie in a line but instead form a vaguely shaped cloud in phase space centered about the origin. The points seem randomly placed and there isn’t any obvious relationship between their positions. To get a clearer idea of the phase space distribution, let’s consider the same beam but with a much larger sample size of 1000 particles.
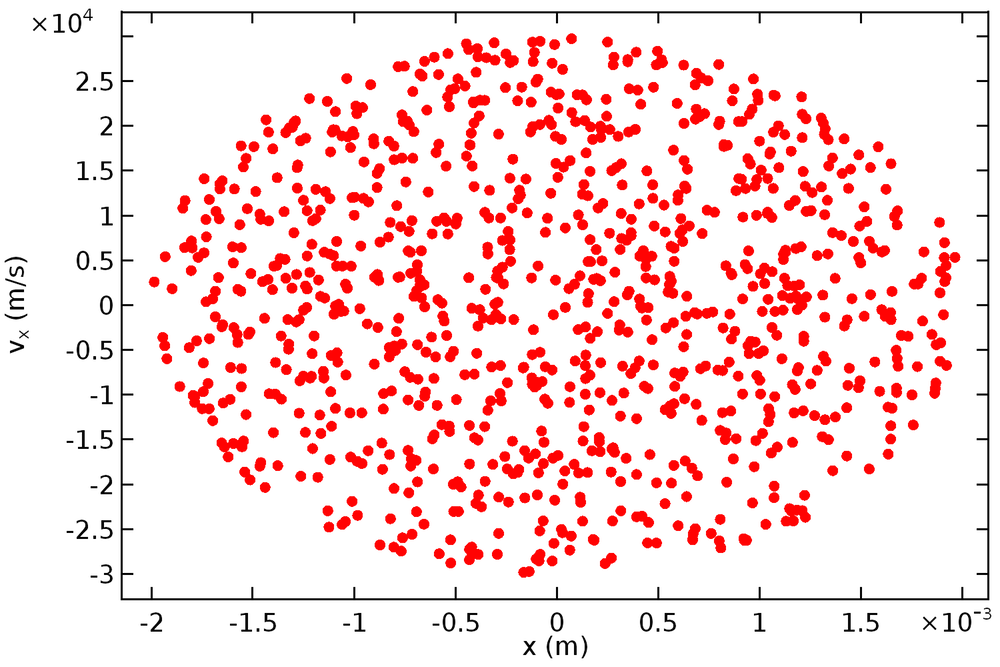
Now it has become much clearer; the particles form a phase space ellipse. Because the ellipse is thickest at the center, particles positioned closer to the beam axis have a larger velocity spread as compared to particles near the beam envelope’s edge. Such ellipse-shaped distributions are extremely common in beam physics, although the proportions and orientation of the ellipse and the exact placement of particles relative to it can vary. As was the case when describing the beam envelope, the phase space ellipse may either have a sharp cutoff or gradual decrease in number density. In the latter case, an ellipse can be defined so that it encloses some arbitrary fraction of the beam particles, say 95%.
In practice, most charged particle beams are paraxial, meaning that the transverse velocity components are very small relative to the longitudinal velocity. In the paraxial limit, we can describe each particle by its transverse position x and inclination angle x' = v_x/v_z. (It’s fair to call this quantity an angle because sin(x') \approx x' in the paraxial limit.) The distribution of x and x’ values of particles in the beam is the trace space distribution, and the ellipse that encompasses this distribution is the trace space ellipse.
Evolution of Phase Space Ellipses
The ellipse shown in the previous image was approximately symmetric about the x-axis and vx-axis. However, this isn’t always the case; as the beam propagates, the ellipse changes shape even in the absence of any forces, simply because the expressions along the two axes are related to each other. Particles with positive transverse velocity (vx > 0) will move to the right (the +x direction) in phase space because, by definition, dx/dt=v_x. Similarly, particles with negative transverse velocity will move to the left. The following animation shows the evolution of a phase space ellipse over time for a drifting beam without space charge effects.
When the ellipse has reflection symmetry about the x-axis and vx-axis, we say that it’s upright. An upright phase space ellipse corresponds to a waist along the beam trajectory.
Introduction to Beam Emittance
In beam physics, it’s often more convenient to work in trace space (the x-x’ plane) than the x-vx or x-px plane. This is partly because the inclination angle x’ is much more useful for visualizing the shape of the beam than the transverse velocity or momentum. A trace space ellipse (an ellipse drawn in the x-x’ plane to encompass the particles in trace space) has the general form
where the parameters γ, β, and α, called the Twiss parameters or Courant-Snyder parameters, are not all independent but are instead related by the Courant-Snyder condition,
(1)
The quantity \gamma \beta -\alpha^2 is also called the Courant-Snyder invariant.
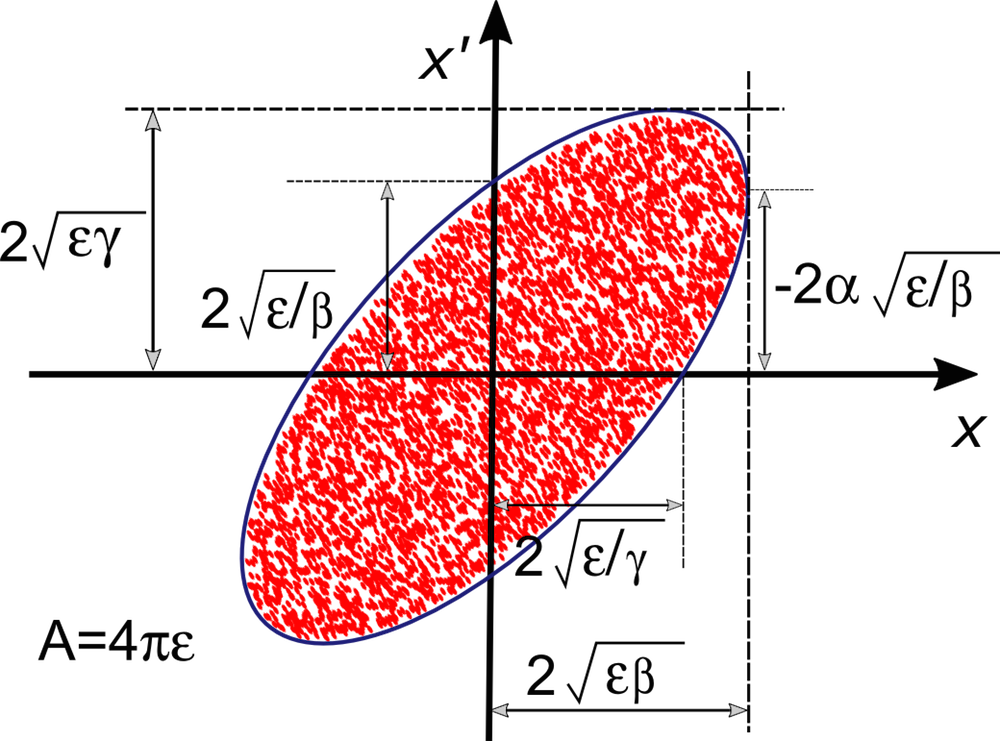
Altogether, the parameters γ, β, α, and ε describe the shape, size, and orientation of the trace space ellipse as follows:
- γ is most often written in terms of the other parameters using Eq. (1). It describes the proportions of the beam. As γ increases with ε held constant, the beam occupies a smaller region of space (narrower range of x values) but a wider velocity spread (wider range of x’ values).
- α describes the tilt of the trace space ellipse. For an upright ellipse, this corresponds to a beam waist, α = 0. The beam is converging if α > 0 and diverging if α < 0.
- β, also called the amplitude function or betatron function, describes the proportions of the beam. As β increases with ε held constant, the beam occupies a larger region of space (wider range of x values) but a narrower velocity spread (smaller range of x’ values).
- ε describes the size of the trace space ellipse. It’s also called the emittance. Since we’re talking about the transverse position and momentum, we can be more specific by calling this the transverse emittance.
Although beam emittance describes the size of the ellipse, there are several different conventions as to how the emittance and ellipse area are actually related. By one convention, the emittance is the product of the lengths of the semimajor and semiminor axes of the ellipse, with the result that A = 4πε. This is illustrated in the following diagram, which further shows how the Twiss parameters are related to the ellipse proportions and orientation.
It’s also extremely common to multiply the reported emittance by 4, so that A = πε. In some resources, the division by π is also omitted, so that A = ε. When entering or reading the reported beam emittance, it’s extremely important to keep track of which convention is used.
Statistical Interpretations of Emittance
So far, we’ve seen that the beam emittance is an indication of the phase space area covered by the beam. However, in addition to this geometric interpretation, it’s possible to define a statistical interpretation in which the emittance is described in terms of averages over the ensemble of particles.
The root-mean-square emittance (or RMS emittance) can be defined as
(2)
\left\langle\left{(x' -\textless x' \textgreater)}^2\right>
– \left\langle\left{(x- \textless x \textgreater )\left(x' -\textless x' \textgreater )\right>^2}
where the angle brackets represent arithmetic means, i.e.,
As in the geometrical definition of emittance, it’s extremely common to multiply the expression for RMS emittance by 4:
(3)
4\sqrt{\left\langle\left(x -\textless x \textgreater )^2\right>
\left\langle\left(x' -\textless x' \textgreater )^2\right>
– \left\langle\left(x- \textless x \textgreater )
\left(x'-\textless x' \textgreater )\right>^2}
In COMSOL Multiphysics, we take extra precautions to ensure that the definition of the emittance is made clear by referring to Eq. (2) as the 1-rms emittance and Eq. (3) as the 4-rms emittance. If the trace space ellipse is positioned so that its center lies at the origin of the x-x’ plane, then \textless x \textgreater = \textless x' \textgreater = 0 and Eq. (2) can be simplified to
where subscripts have been used to indicate more clearly that this is the 1-rms emittance. Similarly, it’s possible to write statistical definitions of the Twiss parameters (again using the simplifying assumption \textless x\textgreater = \textless x'\textgreater = 0):
\gamma &= \frac{\textless x'^2 \textgreater}{\varepsilon_{1,\textrm{rms}}} \\
\beta &= \frac{\textless x^2\textgreater }{\varepsilon_{1,\textrm{rms}}} \\
\alpha &= -\,\frac{\textless xx'\textgreater}{\varepsilon_{1,\textrm{rms}}}
\end{aligned}
From the statistical definitions of the Twiss parameters, it’s much clearer that α is positive when most of the particles lie in the 2nd and 4th quadrants of trace space, which means that the beam is converging.
The advantage of the statistical interpretation of beam emittance is that it removes the ambiguity of drawing an ellipse around an arbitrary phase space distribution to find its area. A disadvantage is that if there is no obvious cutoff distance, then a small number of particles a great distance away from the beam center can considerably skew the emittance and Twiss parameters. Sometimes these particles, such as those found at the end of Gaussian “tails”, are intentionally excluded from the statistical definition of beam emittance.
Interpretations of Beam Emittance
A lower value of the beam emittance is associated with some combination of the following beam properties:
- Smaller beam size (reduced range of x values)
- Smaller velocity spread (reduced range of x’ values)
It’s typically desirable to reduce beam emittance whenever possible. However, most processes tend to either keep the emittance constant or increase it. Several techniques for beam cooling, or emittance reduction, are available, but delving too deeply into beam cooling methods is beyond the scope of this series.
Why are we so concerned with reducing beam emittance? Among other reasons, we must remember that fundamental research in particle physics has driven the development of particle accelerators to a large degree, especially in extremely high-energy applications. To make particles undergo collisions at extremely high energy, it’s often necessary to make two beams of particles intersect each other, rather than having one beam interact with a stationary target. However, the collision cross section for two intersecting beams is much smaller than the collision cross section for a single beam interacting with a stationary target.
A technical aim of modern accelerators is therefore to fit as many energetic particles into a narrow space as possible to maximize the collision probability. Higher emittance either means that the particles are spread over a large area or that there are big differences among the particle velocities that will cause them to occupy a large area later on. Either one of these outcomes is detrimental to the frequency of collisions between the intersecting beams.
Extending to the 3D Environment
So far, we’ve explored what particle beams are, how to distinguish between laminar and nonlaminar beams, and how the phase space distribution in a nonlaminar beam is tied to the concept of transverse beam emittance. We’ve learned that real-world beams typically occupy some finite-sized area in phase space or trace space, and that the emittance is a figure-of-merit that is usually proportional in some way to the phase space area. Furthermore, we’ve seen two different ways to interpret beam emittance: geometrically, as in a phase space area, or statistically, in terms of the averages over beam particles and their inclination angles.
We have, however, only discussed ideal sheet beams in 2D. When extending to 3D, we’ll have to consider emittance in two orthogonal transverse directions. Real-world beams also have some distribution of velocity in the axial direction, which gives rise to the longitudinal emittance.
Next, we’ll look at phase space distributions in particle beams in 3D for the first time and learn how to sample from phase space distributions to reproduce some of the phase space ellipses we’ve seen thus far.
Other Posts in This Series
- Sampling Random Numbers from Probability Distribution Functions (Part 1)
- Sampling from Phase Space Distributions in 3D Charged Particle Beams (Part 3)
References
- Humphries, Stanley. Charged Particle Beams. Courier Corporation, 2013.
- Davidson, Ronald C., and Hong Qin. Physics of intense charged particle beams in high energy accelerators. Imperial college press, 2001.


Comments (1)
Edward Principe
April 18, 2019Is this comsol model available for download and study??