
It’s 1996, and myself and a group of ~20 other second graders huddle under our desks in our elementary school classroom in Southern California. People regularly hold these “earthquake drills” around the world, especially places located on Earth’s fault lines, in case disaster strikes. Another way to prepare? Analyzing the structural stability of buildings subject to these havoc-wreaking seismic events.
The “Shaky Ground” of Earthquake Analysis
Earthquakes are classified according to magnitude. This factor is determined by how large the source of the quake is — not its intensity, which varies from place to place. The magnitude of an earthquake is unpredictable and spans a wide range. You might not even notice a small event, but a major earthquake causes mass fatalities, damage that takes decades to repair, and even permanent changes to an area’s topology.
Fun fact: The media erroneously classifies earthquakes by the “Richter scale”, named after seismologist Charles Richter. Most experts use the more up-to-date and widely accepted Moment Magnitude scale instead.

San Francisco after the 1906 earthquake. George R. Lawrence took this photograph by attaching his camera to a kite. Image in the public domain, via Wikimedia Commons.
Earthquake mechanics is difficult to analyze because it’s impossible to know the time history of the anticipated excitation. Think about it: Meteorologists don’t track the path of an earthquake for weeks leading up to its culmination or give it a name like they would with a hurricane. Earth’s lithosphere doesn’t expel seismic waves in warning like an active volcano sputters lava.
Making the study of earthquakes even more challenging is their short duration. You can’t base this type of analysis on the statistical properties of an input signal, like you could with a random response analysis, for instance.
Is there anything we can do to prepare for an earthquake besides practice hiding under our desks?
Luckily, yes.
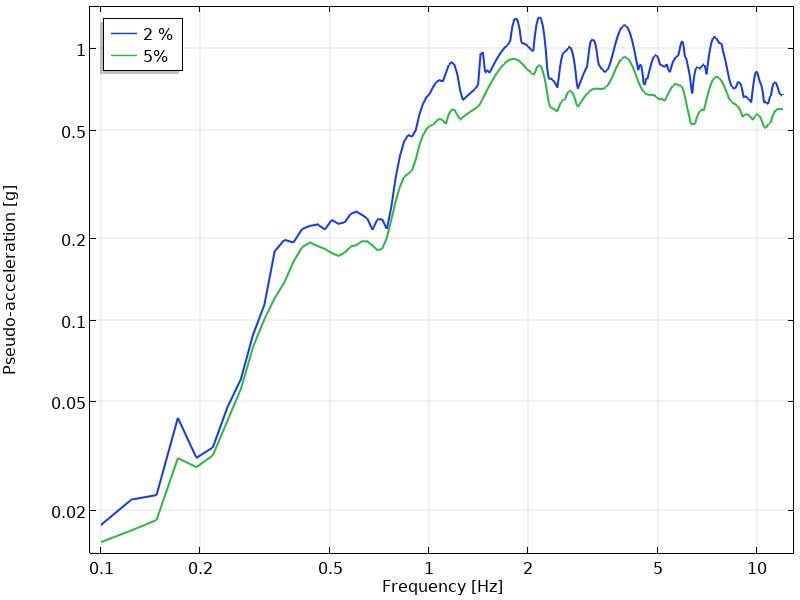
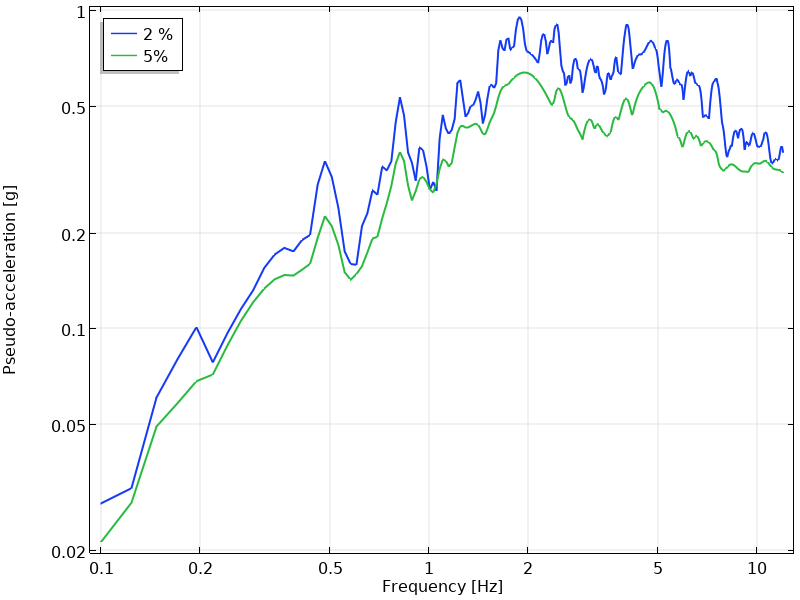
Response spectrum analysis estimates the peak responses of short and nondeterministic transient dynamic events, like earthquakes. This capability enables structural engineers and seismologists to predict the maximum displacement, stress, and other quantities in a building or other structure during an earthquake.
Response spectra for the north–south (left) and east–west (right) directions of the El Centro earthquake, which took place in Southern California in 1940. Such spectra form the input for a response spectrum analysis.
Essentially, response spectrum analysis enables you to determine how a building would be affected by a worst-case scenario. If you instead were to use a time-domain analysis, you could only cover one of all of the possible earthquakes in a single study.
Simulation Analysis of Earthquake Mechanics
In the COMSOL Multiphysics® software and add-on Structural Mechanics Module, you can perform a shock response spectrum analysis of a building being subjected to an earthquake.
The Structural Mechanics Module contains specialized functionality for shock response spectrum analysis, including methods for:
- Modal combination
- SRSS
- CQC (der Kiureghian)
- Ten percent
- Absolute sum
- Grouping
- Double sum (Rosenblueth)
- Spatial combination
- SRSS
- CQC3
- 100-40-40
- SRSS3
There are even options for separating periodic and rigid modes, or adding a static correction for missing mass.
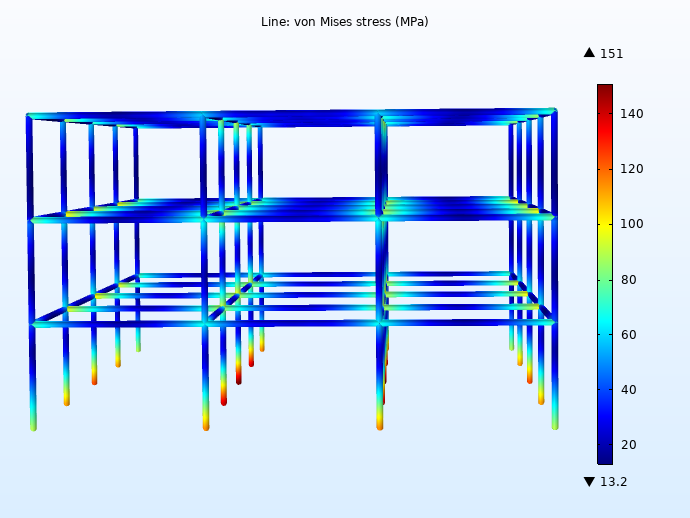
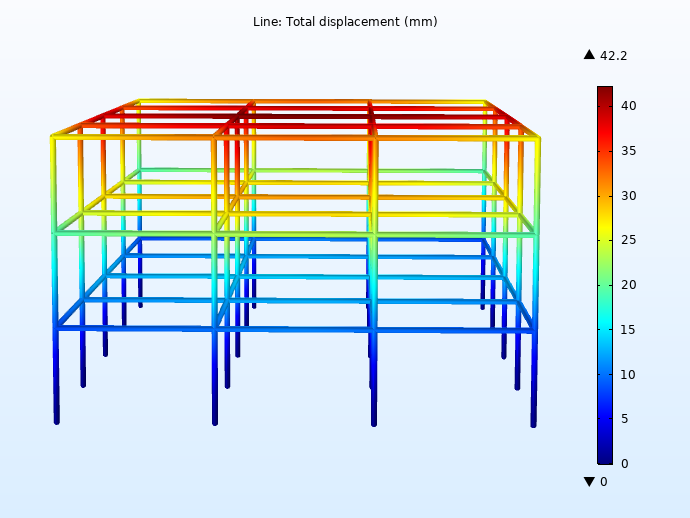
The von Mises stress (left) and total displacement (right) of a structure when analyzed using the CQC modal combination method and SRSS spatial combination method.
To predict the effect that an earthquake has on a structure, the COMSOL® software first performs an eigenfrequency study, computing the eigenmodes of the structure and factors such as the modal mass as a function of eigenfrequency.
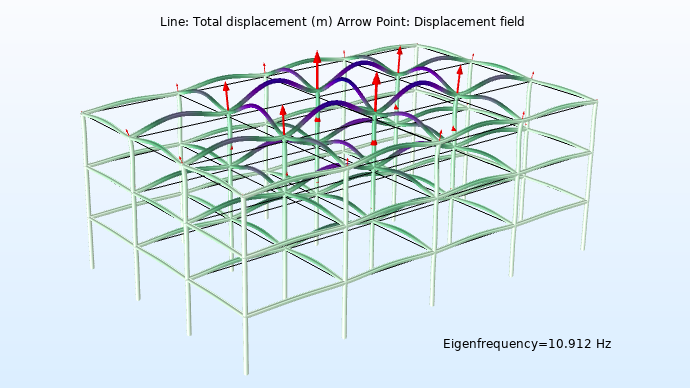
An eigenmode that would be susceptible to an excitation in the vertical direction.
Once the eigenfrequencies are computed, the corresponding values from the given shock response spectra are multiplied with the modal participation factors. This result determines the peak displacement of each of the modes when excited in a given direction.
It’s important to make the distinction that if you simply add up all of the peak values, it suggests that all of the modes hit their peak value simultaneously — quite the earthquake! Response spectrum analysis instead combines the modes in different ways to predict the total peak response, giving you a more accurate (and less alarming) prediction.
Try It Yourself: Studying Shock Response Using COMSOL Multiphysics®
To try performing a shock response analysis yourself, click the button below to download the Earthquake Analysis of a Building tutorial model:
Further Reading
- Learn how to perform structural analyses using shock response spectra
- Get a comprehensive guide to response spectrum analysis and mode superposition
- Read more about the updated functionality for structural analyses in COMSOL®




Comments (2)
Enrico Borellini
August 19, 2021Hi.
If I plot the axial stress on the column, all pillar are in traction (not in compression). Why ? Is there a problem into the model ?
Brianne Christopher
August 19, 2021 COMSOL EmployeeHi Enrico,
Please reach out to support@comsol.com for assistance.
Thank you!
Brianne