
Shape optimization can be used to improve designs in many different physics areas. In this blog post, we will focus on shape optimization in wave optics. We will go over the shape optimization features in the COMSOL Multiphysics® software and show what you can expect to achieve when these features are used for wave optics applications.
This is the first blog post in a two-part series on shape optimization in electromagnetics. The second post will focus on the shape optimization of RF applications. Read Part 2 here.
Parameter Optimization vs. Shape Optimization
Shape optimization is compatible with gradient-based optimization because the geometry change is achieved by deforming the mesh. This can come at the cost of lower element qualities, which can limit how much the geometry can change, particularly in 3D. Parameter optimization is not compatible with gradient-based optimization, as the geometry change is achieved by remeshing, as illustrated below.
Parameter optimization involves remeshing, whereas shape optimization deforms the mesh.
In principle, parameter optimization is a more versatile technology than shape optimization, but, in practice, the incompatibility with gradient-based optimization makes the method slow. This limits the number of optimization variables, and thus the design freedom. One could solve the examples presented in this blog post series using parameter optimization. COMSOL® does support this, but, despite the fact that the examples are relatively simple, the computational cost of the method is prohibitively high. There is therefore a wide range of problems for which shape optimization is better suited than parameter optimization.
COMSOL Multiphysics includes a set of built-in features that simplify the setup of shape optimization problems. The Polynomial Shell and Free Shape Shell features are made specifically for shells, typically in the context of structural mechanics. Most problems, however, are defined on domains (rather than shells) — the Polynomial Boundary and Free Shape Boundary features can be used to optimize boundaries adjacent to these domains. As the names suggest, you can choose between regularization in terms of a polynomial or a free partial differential equation (PDE)-based approach. The Transformation feature limits shape changes to translation, scaling, and/or rotation. This feature can be used on domains and boundaries. The features will tend to change the curvature of boundaries and angles at points, but it’s possible to maintain straight lines by using a first-order polynomial or a Transformation feature. Finally, the Symmetry/Roller feature can restrict edges to planar surfaces, or points to straight lines in 2D, as shown below.
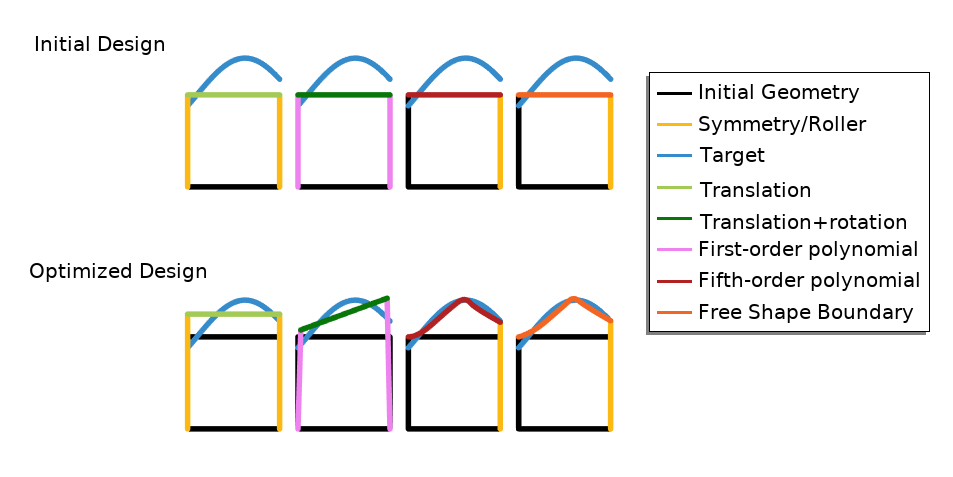
Four different types of shape optimization are illustrated for the problem of changing the upper boundary of a square so that it approximates our target boundary (blue). To optimize the initial design of the first figure, a Transformation feature is combined with the Symmetry/Roller feature to allow movement in the y direction. The second figure shows a transformation where rotation is also enabled, and this requires the use of first-order polynomials rather than the Symmetry/Roller feature. The last two examples show the polynomial and free shape approach, respectively, but there is little difference between the two. Note, however, that there is no feature associated with the left boundary in those examples, and therefore the upper-left points are fixed.
The Transformation feature is associated with less design freedom than the other features, but this is an advantage in terms of converting the optimized design into a CAD geometry. This blog series will focus on shape optimization in 2D, but all of the features can be used in 3D. In the following sections, you will see two examples from wave optics.
Example 1: Filtering
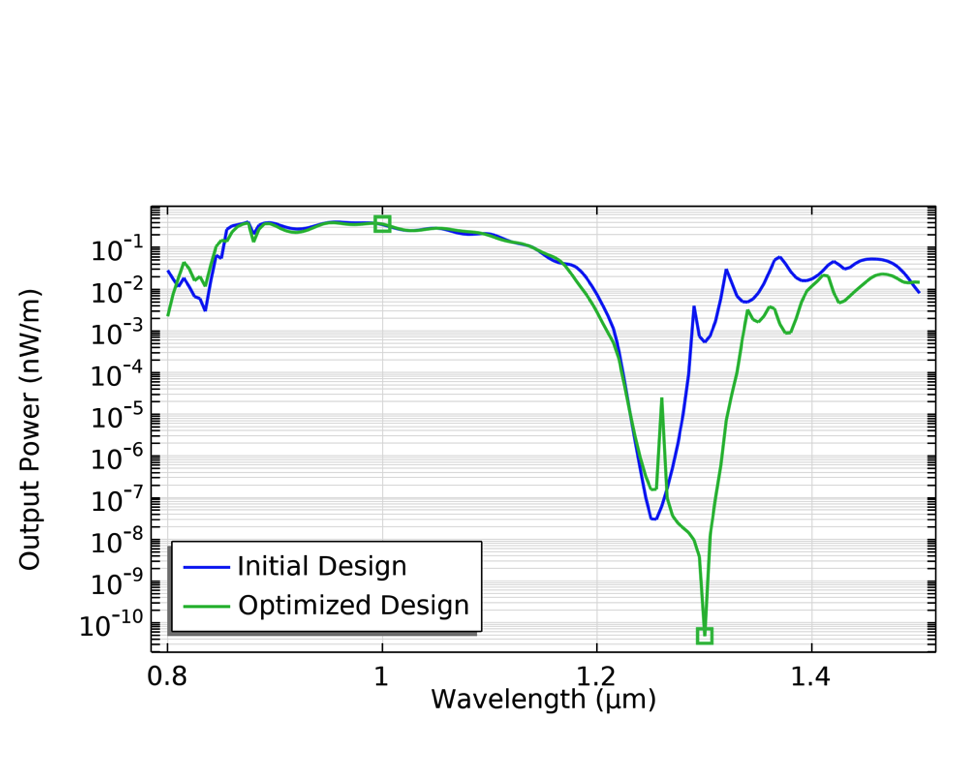
The first example considers the design of a photonic crystal with a bend. The crystal consists of pillars made from GaAs, and the Transformation feature is used so that the position of the pillars can change. The objective is to achieve high transmission for one wavelength (1 µm), while achieving a low transmission for the other wavelength (1.3 µm). Thus, the following expression will be maximized:
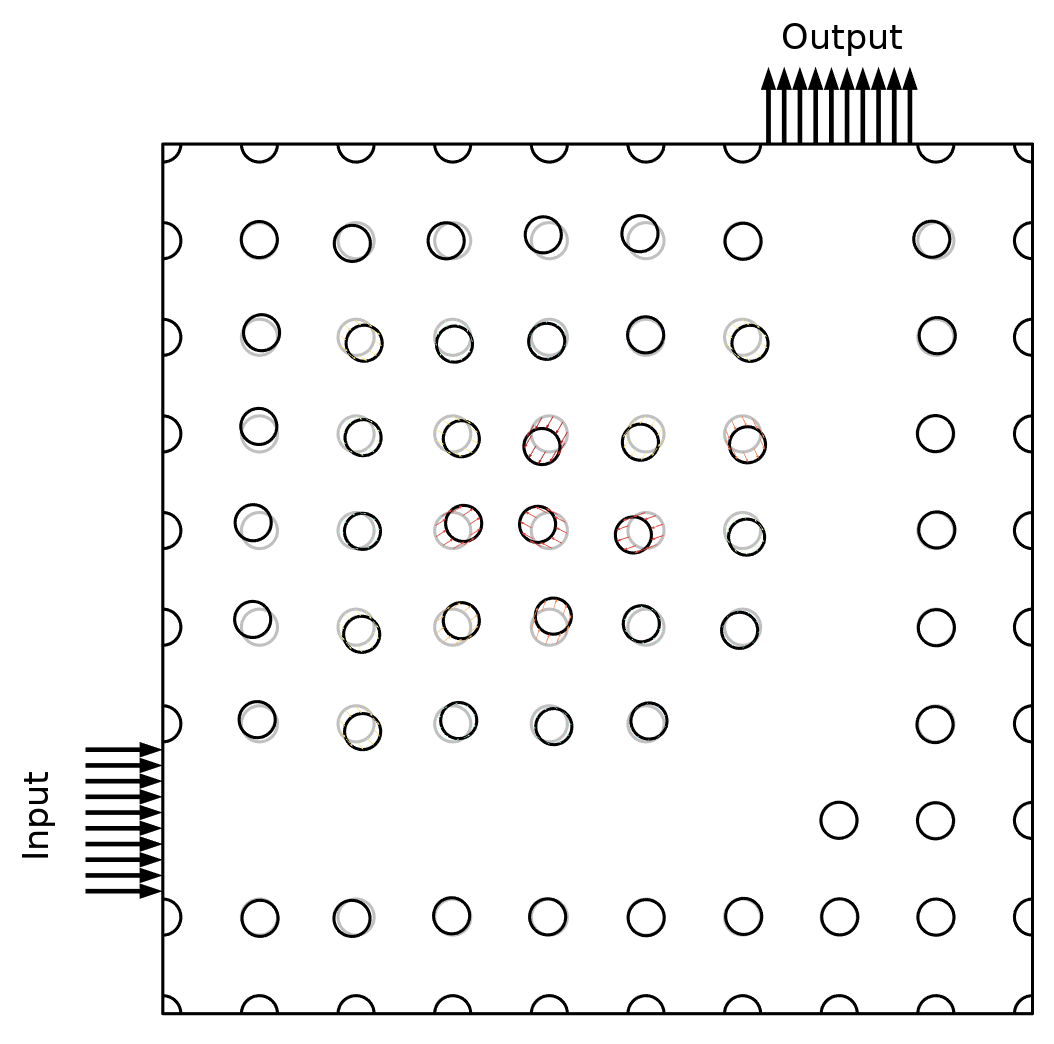
The optimized geometry is shown below, but it is difficult to understand the working mechanism due to the nonintuitive nature of the problem. Looking at the power at the output boundary, however, one can clearly see that the optimization emphasizes the minimization of the power at the larger wavelength, so it might be better to express the objective function in terms of minimax objective. This will be demonstrated in the next example.
Left: The geometry with the initial design drawn in gray, and the optimized design drawn in black. Right: The output power is plotted as a function of the wavelength, with the two wavelengths considered in the optimization (shown as points).
Example 2: Demultiplexer
The second example also considers a photonic crystal, but this time for the purpose of demultiplexing. We want to design a device that routes two different wavelengths (\lambda_1 and \lambda_2) to two different output ports while blocking other wavelengths. You can express the objectives for the blocking, \phi_B, and routing, \phi_R, as:
where P_\mathrm{min} and P_\mathrm{max} are the minimum and maximum power for the routing and blocking, respectively. Note that the definition of the routing objective depends on whether it is evaluated for \lambda = \lambda_1 or \lambda = \lambda_2, so that the signal is encouraged toward the desired output port. If the desired power is achieved for the relevant wavelengths, both objectives are equal to -1, whereas higher values are obtained if the desired power is not achieved, so the objectives should be minimized. The objectives are combined in a minimax formulation, meaning that the objective is taken as the maximum of several objectives. Some of the objectives will only differ because they are evaluated at different wavelengths, while other differ because the ideal behavior of the device depends on the wavelength, and therefore the definition of the objective also depends on the wavelength. The final objective is expressed as:
If the wavelength is within \Delta \lambda / 2, the routing objective will be used; if it’s not within \Delta \lambda / 2, the blocking objective will be used.
Similar to the first example, we will use the Transformation feature to optimize the position of the pillars in the photonic crystal. The animation below illustrates the optimization of the design as well as P^1_\mathrm{out} and P_\mathrm{out}^2. The electric field is also shown for the case of \lambda_1 and \lambda_2, but a total of 14 wavelengths are evaluated for every optimization iteration.
The z-component of the electric field is plotted for two wavelengths, while the output powers are shown at the ports.
In this example, we have chosen P_\mathrm{min}=5P_\mathrm{max}. This gives rise to the spectrum shown below, but one can prioritize blocking or routing by changing the parameters.
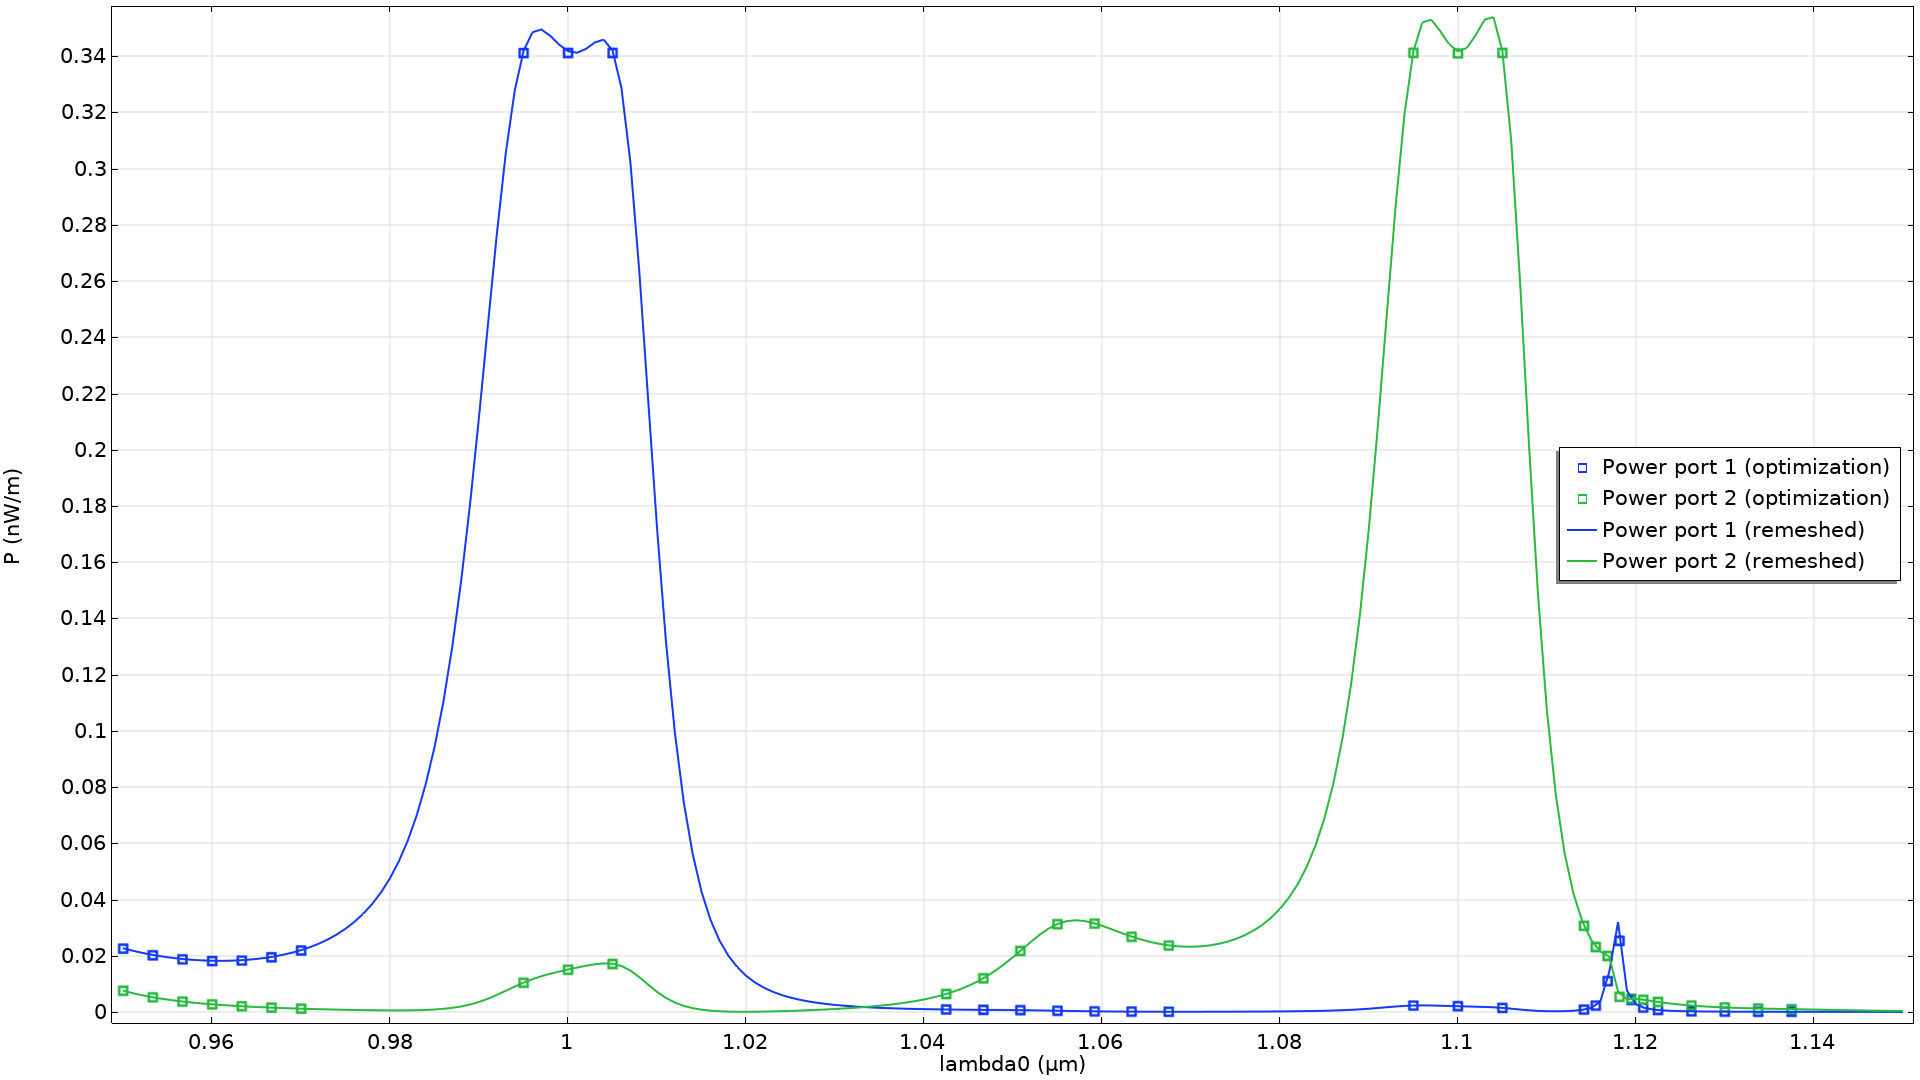
The output port powers are plotted for the wavelengths used in the optimization (points). These are compared with a graph of the port powers after remeshing in the deformed configuration.
There are small deviations between the port powers before and after remeshing, but only for a few of the wavelengths, and the optimization result does not appear to exploit numerical effects. Moreover, we can see that we only get a small output power at the secondary port even though the objective only calls for a high output power at the primary port. Finally, it’s worth noting that the sensitivity of the position of every pillar for every wavelength is considered for all optimization iterations. A significant amount of highly relevant information is thus provided to the optimization solver for every iteration. Therefore, it’s possible to find a value for the 234 control variables after just 50 iterations.
There is an element of trial and error in choosing wavelengths to use in optimization, and the last example uses 31 wavelengths, which is computationally costly. The computational time can be brought down by using a cluster, and we will demonstrate this in Part 2 of this blog series, where we will look at optimization problems in the radio-frequency spectrum. All of the examples shown will use minimax formulations in combination with the Transformation and Polynomial Boundary features.
Next Step
Download the models highlighted in this blog post to gain a more in-depth understanding of their setup and results:




Comments (5)
Nguyen Kim Thanh Phong
September 10, 2023This is great info to know. I really like to be active Thanks for sharing.
mystoc strling
September 25, 2023hello Kristian Ejlebjærg Jensen
How to save all the positions of an optimized hole in CAM software like COMSOL?
thanks
Kristian Ejlebjærg Jensen
September 25, 2023 COMSOL EmployeeYou can a list the positions of the optimized holes by:
#1 Create a Explicit selection in the geometry sequence immediately after circle (for the hole) is created and set the explicit selection to point to the lower point of the circle.
#2 Build the geometry sequence and update (F5) the optimization study.
#3 Create an Evaluation Group pointing the optimization study step and set the solution to the first wave length (as the controls are the same for all)
#4 Add a Point Evaluation feature to the Evaluation Group, use the Explicit Selection, and write [X, Y+rHole] as the expression. This will give you the centers of all the optimized holes.
VINAYAKA D RAO
January 19, 2025Hello Kristian Ejlebjærg Jensen!
I am working on optimizing the metamaterial parameters for radiative cooling applications. Here, I will have to maximize absorptance for (8-13)um wavelength region. Could you kindly guide me of how to plot an absorptance plot with optimized values ?
Kristian Ejlebjærg Jensen
January 20, 2025 COMSOL EmployeeDear Vinayaka D Rao
I suggest that you contact comsol.com/support
Best regards,
Kristian E. Jensen
Technical Product Manager, Optimization