
When pesticides are used in crops to control pests, their effects on the environment continue even after they have served their purpose. Pesticides can leach into the soil and water sources that both humans and animals depend on, spreading harmful chemicals to the surrounding ecosystem. Over time, their active ingredients are detoxified through different reactions that occur after their release, eventually degrading them into harmless products. Understanding the pesticide runoff patterns and mobility of various pesticides before and after they degrade is therefore important to ensuring that they are safe for use. By simulating the transport and reactions of pesticides in soil, we can build a model of this system and determine whether or not a chemical is safe for both humans and the environment.
Pesticide Degradation: Aldicarb and its Decay Products
The pesticide aldicarb is used as an insecticide to control the populations of insect herbivores on many crops, especially cotton. When aldicarb degrades, it transforms first into the toxic chemicals aldicarb sulfoxide and aldicarb sulfone, and then is detoxified by hydrolysis, forming oximes and nitriles. When determining whether or not a chemical is safe for commercial and home use, the chemical’s toxicity is measured by its LD50 value. For aldicarb and aldicarb sulfoxide, the toxicity is LD50 = 0.9 mg/kg; a very high toxicity, while aldicarb sulfone has a value of LD50 = 24 mg/kg; a lower but still potentially harmful toxicity. By setting up a model in COMSOL Multiphysics, we can measure the time it takes for aldicarb to degrade, as well as measure the spatial concentration distribution of the toxic components aldicarb, aldicarb sulfoxide, and aldicarb sulfone over time.
Simulation of Pesticide Runoff into Variably-Saturated Soil of Different Porosity
Let’s assume that we want to understand the pesticide runoff and degradation patterns of aldicarb as it leaches into relatively dry and variably-saturated soil. By looking at the reaction mechanism of the pesticide’s degradation, we can determine the decomposition kinetics and mass balance equations for aldicarb and its decay products. By solving for the equations, the time scale of the degradation process can also be determined.
When setting up a pesticide runoff system, we can imagine that the aldicarb is contained in a ring of water sitting on the ground. The soil beneath the ring is layered, with the top layer slightly less permeable than the bottom one. Water seeps through the ring and passes into the soil below. For the purpose of simplicity, we’ll look at only the water flow through the base of the ring, and assume that there is no flow through the vertical walls. The system is simulated with the geometry shown below:
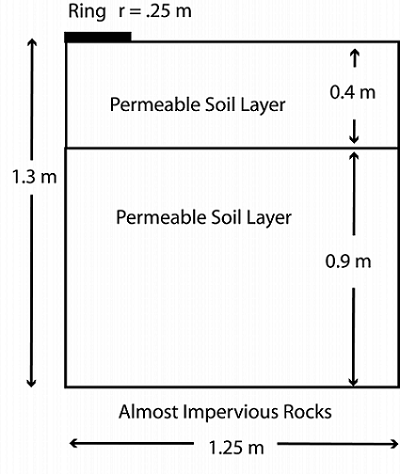
Geometry of the ring and soil in the pesticide system.
In the diagram, you can see the ring representing the aldicarb concentration, as well as the two permeable layers of soil below. At the base of the geometry is a bed of rocks that is almost impervious to water. As the aldicarb leaches into the surrounding soil, it is transported by advection, dispersion, sorption, and volatilization, and moves from the top of the geometry and into the soil at a constant concentration. Within the soil, the aldicarb reacts and is adsorbed into the soil particles.
The sorption, degradation, and volatilization of the three solutes, aldicarb, aldicarb sulfoxide, and aldicarb sulfone proceed in linear proportion to the aqueous concentrations. Initially, the soil in the system is pristine, with no trace of the pesticide runoff. However, over time, the degrading aldicarb passes into the soil and spreads. The Richards’ Equation interface can be used to calculate the fluid flow, while the Solute Transport interface can be used to predict the transport of the dissolved concentrations and absorbed contaminants.
We can measure the concentrations of the aldicarb and the decay products that remain in the soil beneath the pond after a 100-day period. These results are based on the reaction mechanisms and mass balance equations, and are shown in the graph below:
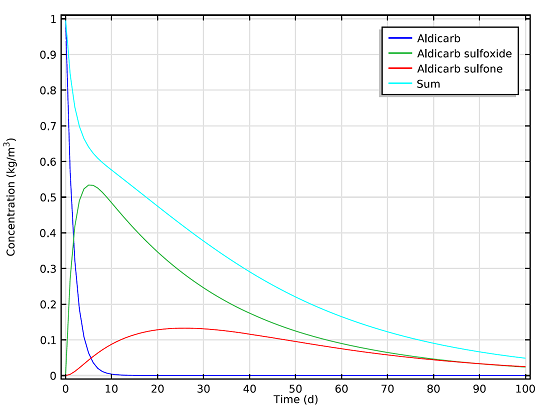
Concentration of the toxic species aldicarb, aldicarb sulfoxide, and aldicarb sulfone over a period of 100 days.
As can be seen in the graph, even after 100 days there is still a notable concentration of the toxic chemicals present in the soil. Using results from the space- and time-dependent model setup, we can also determine how far the chemicals will seep into the soil after a certain number of days.
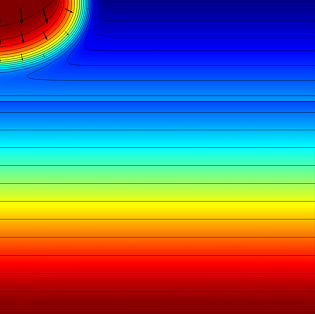
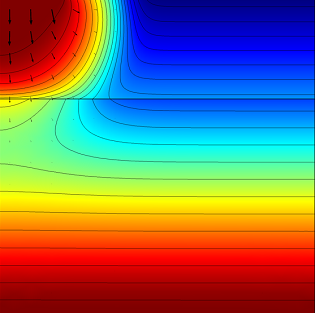
First, the model calculates the fluid flow into the soil where we can determine how far the pesticide-containing water has traveled after 0.3 and 1.0 days. The figures below show the results for this simulation:
|
|
The effective saturation (surface plot), pressure head (contours), and flow velocity (arrows) in a variably saturated soil after 0.3 days (left) and 1 day (right).
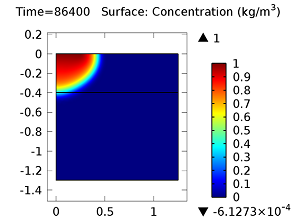
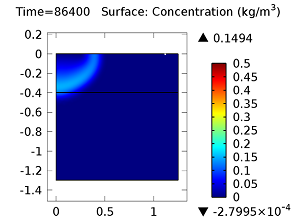
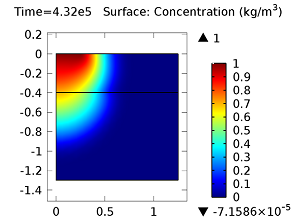
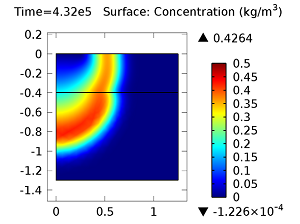
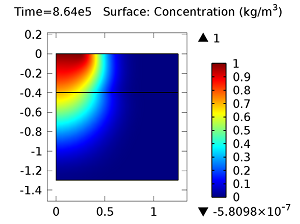
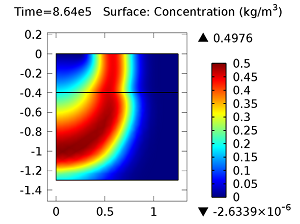
Next, let’s look at the concentrations of aldicarb and the equally toxic aldicarb sulfoxide after 1 day and 10 days. As the fluid flow field continues to travel deeper into the soil, the previously pristine soil becomes contaminated with the two highly toxic chemicals. You can see the concentrations of the chemicals in the figures below:
|
|
|
|
|
|
Concentration of aldicarb (top left) and aldicarb sulfoxide (top right) after 1 day (note the differing color ranges), 5 days (middle left and middle right, respectively), after 10 days (bottom left and bottom right, respectively).
After 10 days, the concentrations of aldicarb have reached a steady state, and stay rather localized with respect to the source. The aldicarb sulfoxide, however, has not reached a steady state after 10 days, and has covered a much greater volume of soil over the same time period.
Model Download
- You can download the model Pesticide Transport and Reaction in Soil from the Model Gallery


Comments (0)