
For patients with renal failure, efficient dialysis treatment is vital. One point of focus is designing high-performance dialysis equipment that increases contaminant removal, improving treatments like hemodialysis. To accomplish this, you can study aspects of the hemodialysis process, such as membrane dialysis devices, with numerical modeling apps. These apps, like the one discussed here, enable users to more quickly analyze the effects of different inputs and improve designs.
Treating Renal Failure with Hemodialysis
Renal failure, also known as kidney failure, occurs when a patient’s kidneys fail to properly remove excess waste and fluid from their blood, causing it to build up within the body. To help patients with failed kidneys, doctors use dialysis to replicate the kidneys’ blood-cleaning function.
Dialysis is a diffusion-driven process that transports only certain components through a membrane. Diffusion occurs due to the different concentrations of the dialysate and permeate located on either side of the membrane. During this process, chemical species are separated by variations in solubility and diffusivity, resulting in different transport rates for different species across the membrane.
One type of dialysis, hemodialysis, uses membranes as artificial kidneys. They serve some of the same functions as a healthy kidney and alleviate issues associated with kidney failure. For the hemodialysis process to work, the membrane dialysis device must be able to successfully remove contaminants from the bloodstream.
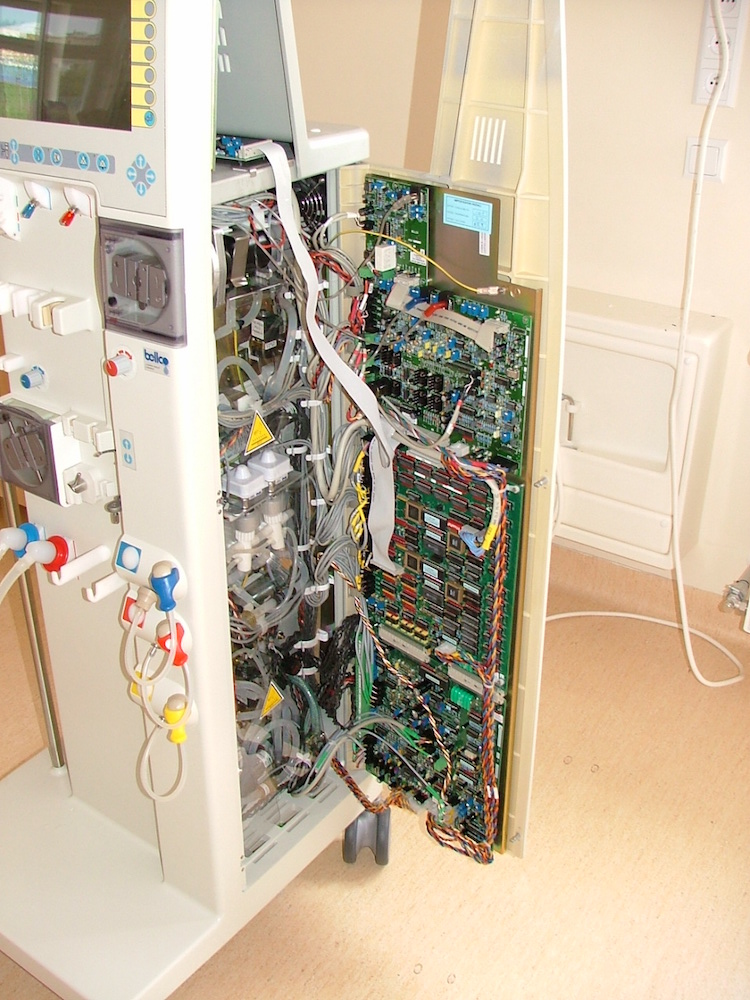
A look inside a machine used for hemodialysis. Image by luke130. Licensed under CC BY-SA 3.0, via Wikimedia Commons.
While modeling experts like you can find optimal dialysis device parameters by analyzing different materials and operating conditions with simulation, you can provide an easier way for colleagues and customers to run these analyses by building a COMSOL® app. Apps, an example of which we’ll discuss in the next section, help users more efficiently test different inputs and visualize how they affect the contaminant concentration in a membrane dialysis device.
Analyzing Contaminant Concentration in a Membrane Dialysis Device
Our demo app models a membrane dialysis device with a bloodstream flowing through it and calculates the bloodstream’s resulting contaminant concentration. The device featured in this app is made of a hollow-fiber module with walls that function as a membrane to remove contaminants. The following schematic shows the hollow-fiber assembly, a part in the dialysis device.
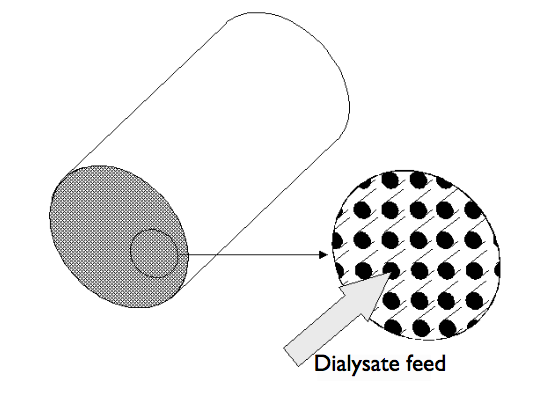
A schematic of the hollow-fiber assembly used in a membrane dialysis device.
In the membrane dialysis device, the dialysate and permeate flow inside and outside the fibers, respectively. Contaminants are transported via diffusion and convection within these liquids. However, in the model below, when contaminants pass through the membrane and move through the fiber walls to the permeate side, diffusion is the sole form of transport. Species with a higher weight and a lower solubility and diffusivity remain on the dialysate side. When simulating ultrafiltration, a process often used in hemodialysis, we can apply a pressure gradient across the membrane wall, which enables advective transport across the membrane for the species with lower weights. This transport mechanism can also be easily added to the model described below.
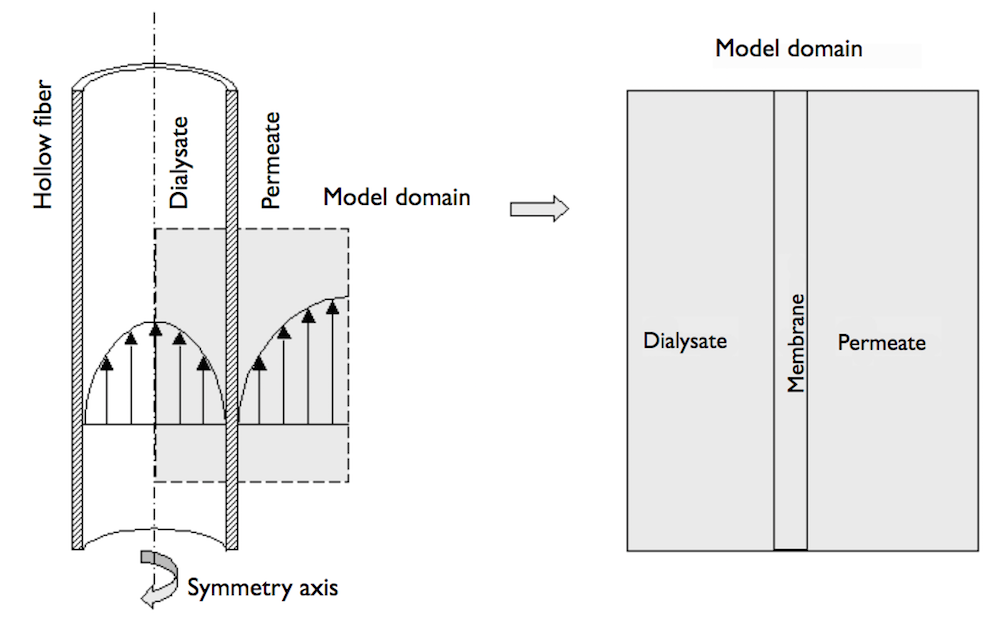
The setup of the hollow fiber, dialysate, and permeate (left) and the model domain (right).
Let’s take a closer look at this underlying model, which uses the Transport of Diluted Species interface to model mass transport and the Laminar Flow interface to model convective flux, under the assumption that there is a laminar flow.
When creating the underlying model, we paid special attention to defining the appropriate boundary conditions. The model deals with discontinuous concentration fields and requires boundary conditions to be set at each liquid interface on both sides of the membrane. You can see the boundaries that need to be considered in the image below.
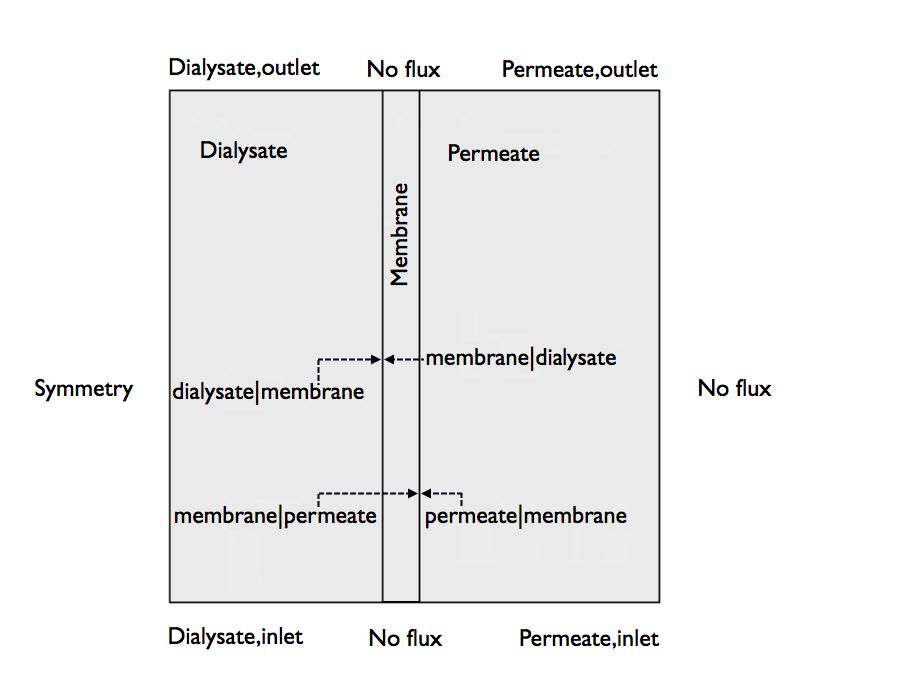
All of the boundaries used in the underlying model.
Further, the underlying model uses an axisymmetrical approximation because the angular gradients are considered negligible. In the axisymmetrical geometry, symmetry applies to the leftmost boundary.
Since the advective term runs parallel with the right edge and the concentration gradients are eliminated by advection, a no-flux boundary condition is set at the right vertical boundary. Additionally, because the membrane is attached to the frame at the upper and lower edges, we can also set no-flux boundary conditions at these boundaries.
Note that while this demo app uses the model described above, you can easily modify the underlying geometry to fit your specific needs. You can also add a pressure-driven term to model ultrafiltration.
All of this complexity and more is hidden from the app user in an easy-to-use interface. With this app, people with little to no simulation knowledge can analyze membrane dialysis devices.
Optimizing a Membrane Dialysis Device with a Numerical Modeling App
The goal of this demo app is to maximize contaminant removal within a membrane dialysis device. This can be done in the app by testing different input parameters, including:
- The inlet’s contaminant concentration within the dialysate
- Diffusion coefficients within the dialysate and permeate
- The diffusion coefficient in the membrane
- The partition coefficient at the liquid-membrane interfaces
- The model domain geometry
As we can see in the following annotated screenshot, users are able to modify these values in the Input & Results section on the left side of the app. Once the user has entered their desired inputs, they can click Compute at the top of the app to run a study and generate results.
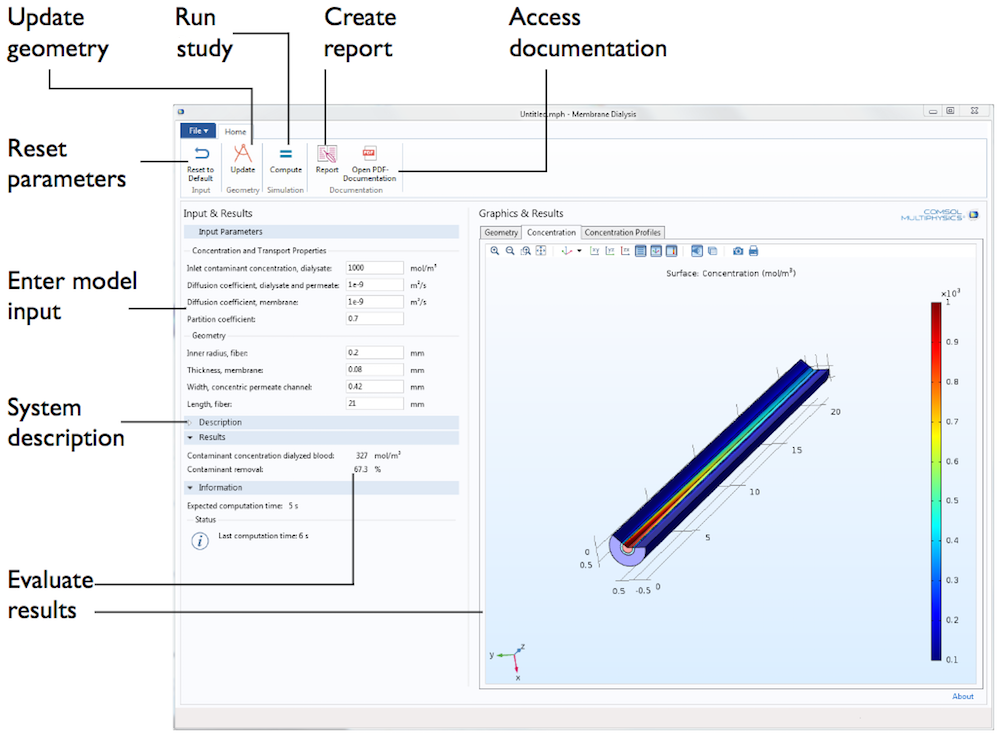
The user interface for our Calculating the Contaminant Concentration in Membrane Dialysis app.
After running a study with the desired inputs, users receive values for both the contaminant concentration in dialyzed blood as well as the contaminant removal in the Input & Results section. Further results are found in the Graphics & Results section, which contains three tabs: Geometry, Concentration, and Concentration Profiles.
The Concentration tab provides a detailed 3D view of the contaminant-concentration distribution within the three model domains. When listed from the center of the model outward, these domains include:
- Dialysate within the hollow fiber
- Membrane
- Permeate surrounding the hollow fiber
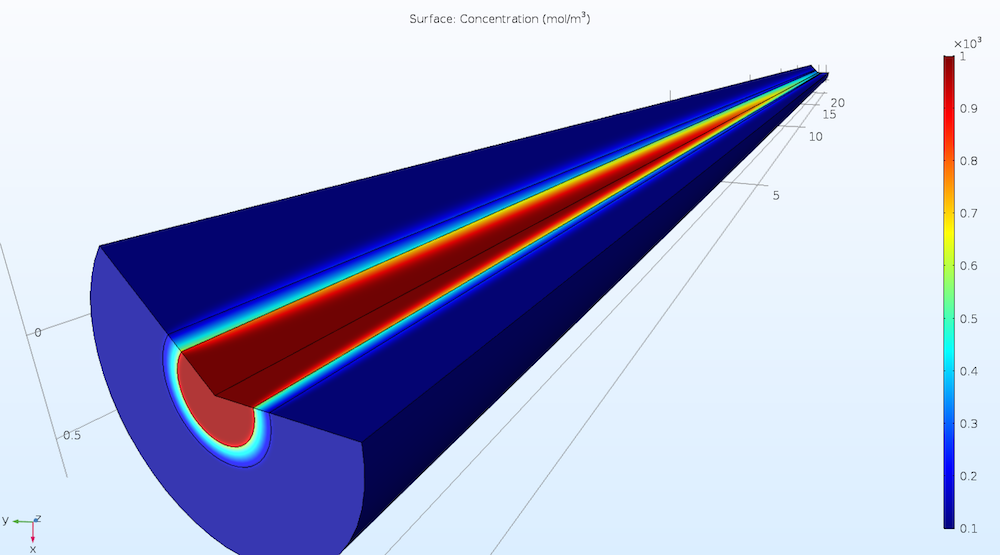
Results from the Concentration tab, showing contaminant concentrations in three domains.
The results plotted above show that as fluid flows from the inlet over a distance of 10 mm, the concentration within the hollow fiber experiences a marked decrease, indicating a successful contaminant removal. Meanwhile, the concentration in the permeate is highest closest to the outlet. The risk of a high filtered species concentration causing a deposition on the outer surface of the fiber is largest at this location. In this graph, we also see diffusion layers developing on the sides of the fiber wall.
Moving on to the Concentration Profiles tab, we see that the demo app enables users to generate a plot detailing the contaminant concentrations in all three domains for both the middle of the fiber and the outlet. The plot shows the discontinuity of the concentration field at the boundaries located between domains, which is caused by the relatively low porosity of the membrane. However, the flux is continuous over the boundaries of the membrane.
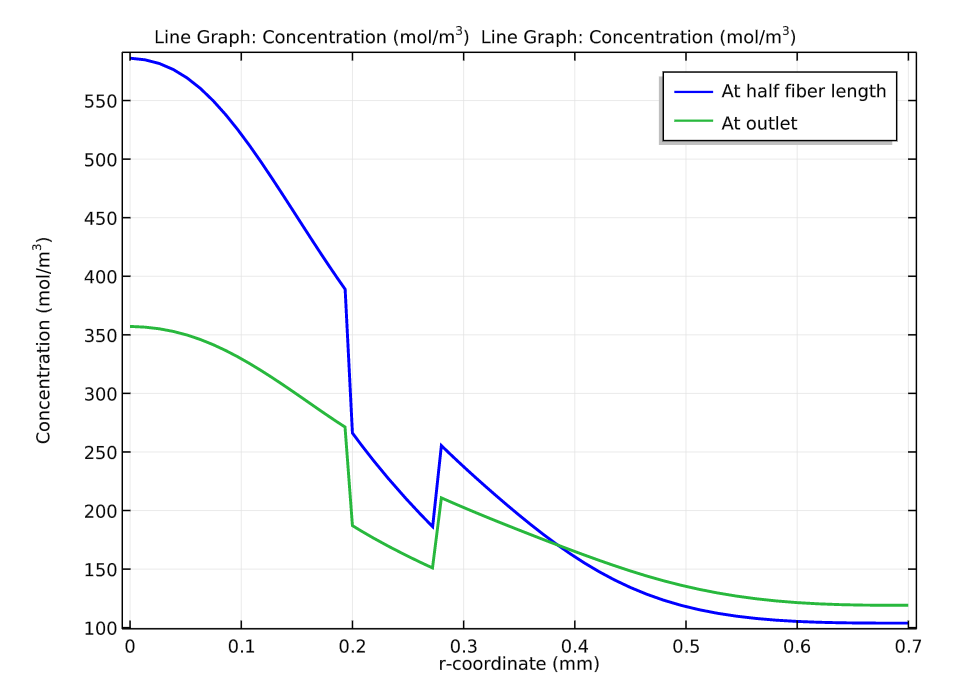
The concentration profiles at half of the fiber’s length and at the outlet, which are plotted along the model geometry’s radius.
With intuitive apps, users can easily test different input parameters to analyze dialysis devices. Results generated by the app discussed here enable users to find the device’s optimal operating conditions, membrane materials, and fiber dimensions for removing contaminants within the membrane dialysis device — helping to improve the dialysis process for renal patients.
Explore More Medical-Related Applications of Multiphysics Modeling
- Read more about biomedical uses of simulation on the COMSOL Blog:


Comments (0)