
Sound Navigation and Ranging (SoNaR, more commonly written in all lowercase as “sonar”) technology can be used for investigating and communicating underwater. To improve the sonar system, you need to optimize the design at a component level. A major component of sonar is the electro-acoustic transducer.
Sonar: Sound Navigation and Ranging
Sonar technology can be used for various applications for the main purpose of detecting objects in water. Some specific applications include mapping the ocean floor for nautical charts, finding hazardous or lost objects, communicating with other vessels, detecting enemy submarines, navigating the seas (both on and underwater), and more.
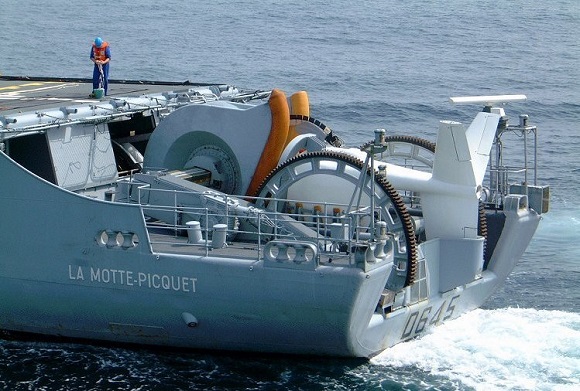
Towed sonar. Image credit: http://www.netmarine.net/ via Wikipedia.
A recent real-world example is the search effort for Malaysia Airlines Flight 370 in April this year. After weeks of employing other search methods, officials decided to use sonar to attempt locating the missing aircraft. The black box of any airplane comes equipped with underwater locator beacons for this very reason. The search team’s sonar did detect signals, but they were unfortunately unable to confirm that they came from Flight 370.
How Sonar Works
There are two types of sonar: active and passive. Active sonar implies that the sonar device can itself make sounds and then “listen” for the echo to return. The sound signals are created from electrical pulses that are converted into sound via the piezoelectric or magnetostrictive material in the center of a transducer. By transmitting sound and then actively awaiting its return and eventually receiving the signal or echo that bounces back, the device can measure how far away the object in question is.
Passive sonar simply involves listening to sounds made by other objects or beings, such as the locator beacons in the case of Flight 370. Both passive and active sonar systems are able to listen to incoming sounds by converting these into electrical signals, again via the piezoelectric or magnetostrictive material in the transducer.
The sonar performance is only as good as its components. The component responsible for sending and receiving signals is the electro-acoustic transducer. For efficiency, you’ll often have a multitude of these transducers arranged in arrays. There are various different designs to choose from, including tonpilz, ring, and flextensional transducers. Here, we will focus on the tonpilz piezo transducer.
Tonpilz Piezo Transducer, a Sonar Component
A tonpilz piezo transducer contains a stack of active piezoceramic rings in between a light head and heavy tail mass. This assembly allows the transducer to act as either a source or a receiver. Additionally, it could be prestressed by a central bolt.
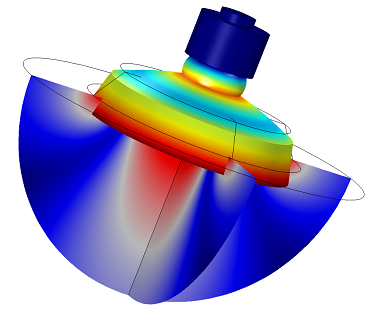
Tonpilz piezo transducer.
Design Considerations
When designing a tonpilz transducer, you will need to consider several elements. The design is based on multiphysics couplings between acoustics and structural mechanics as well as piezoelectricity and structural mechanics. We want to understand how the device deforms and where stresses lie; what the sound pressure level and radiated pressure field are; and the sound beam’s pattern, transmitting voltage response (TVR) curve, and directivity index (DI).
Modeling the Transducer
Due to the multiphysics nature of the component, I would suggest you model it using COMSOL Multiphysics and the Acoustics Module. The Acoustics Module comes with the Acoustic-Piezoelectric Interaction, Frequency Domain interface, which contains all the necessary multiphysics couplings for modeling the transducer.
If we open the solved Tonpilz Piezo Transducer model from the Application Gallery, we can study the performance of a transducer with a bolt that is not prestressed. Below, you can see four of the most important plots.
Note: My colleague Mads Herring Jensen recently updated the model entry with files for COMSOL Multiphysics 4.4. It is available in the Application Gallery for those of you who want to download the model MPH file and the accompanying PowerPoint® presentation.
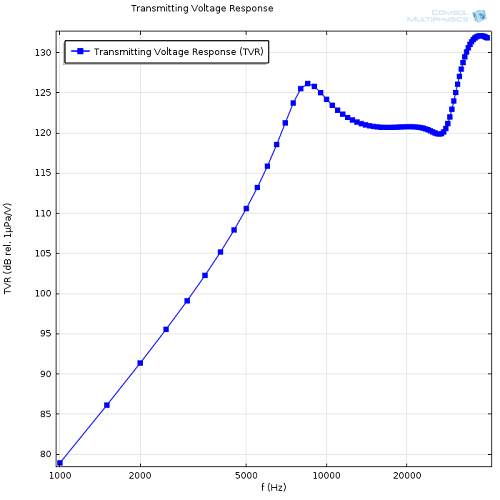
The sensitivity, or rather the transmitting voltage response (TVR), of the transducer plotted between 1 and 40 kHz.
The transducer directivity (depicted as a 3D polar plot) evaluated at a distance of 10 m in front of the transducer for all the modeled frequencies. The normalized directivity is shown in the figure below.
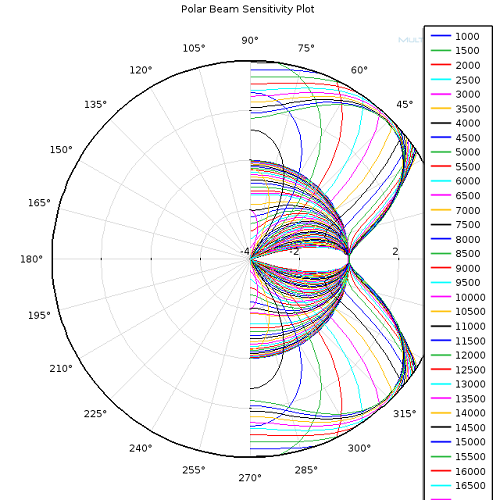
Here, the spatial sensitivity of the transducer is depicted in the xz-plane at a distance of 10 m. The patterns are normalized to 0 dB in front. Evaluating this data at any desired distance is a simple postprocessing task. Based on the far-field data, you can also readily calculate the DI. This is done in the model.
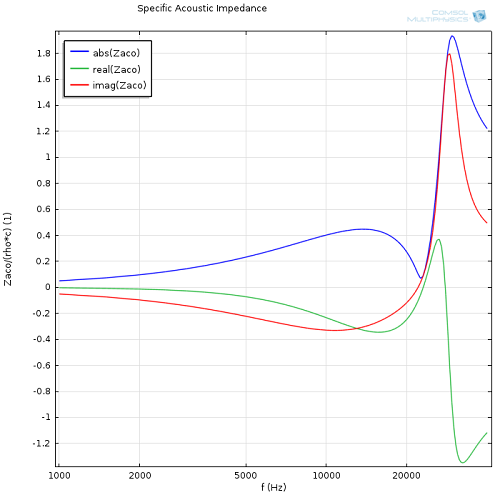
Specific acoustic impedance at the surface of the transducer.
Conclusion
From plotting the results, we can conclude that the transducer is very versatile. That is because we can control its directivity (varying the direct index from -4 to 11 dB) given that the TVR is almost constant in the frequency range of 10 to 30 kHz.
Editor’s note: The section above was updated on 4/13/2016 to reflect the correct direct index values for the tutorial model.
Additional Resources
- Download the Tonpilz Piezo Transducer model
- Watch how to build the model in the Tonpilz Piezo Transducer Tutorial video
- Learn what you can simulate with the Acoustics Module
- COMSOL Conference paper:


Comments (0)