
When fluid flows around an obstacle, periodic vortex shedding can occur. This gives rise to so-called vortex streets, which occur quite frequently in nature and whose understanding is interesting for various technical applications. For me, vortex streets are also simply of captivating beauty. They can be analyzed with modern CFD simulation, but the basic understanding of the nature of vortex streets was gained by their namesake over 100 years ago, just a short walk from my current workplace in Göttingen.
A Window into the History of Fluid Mechanics
When we look out of the window of the COMSOL office in Göttingen, Germany, we see the Leine Canal, a branch of the Leine River. Artificially created in the Middle Ages, the canal flows through the historic city center of Göttingen.
The water of the Leine Canal was served as a source for the local brewery, and several mills used the water power. If we follow the Leine Canal upstream from the COMSOL office through the city center, we come to a place where it was used for a very unusual purpose: At the site where the German Aerospace Center is located today, the “father of modern aerodynamics”, Ludwig Prandtl, is said to have conducted experiments to understand various flow phenomena in the Leine Canal just over 100 years ago.
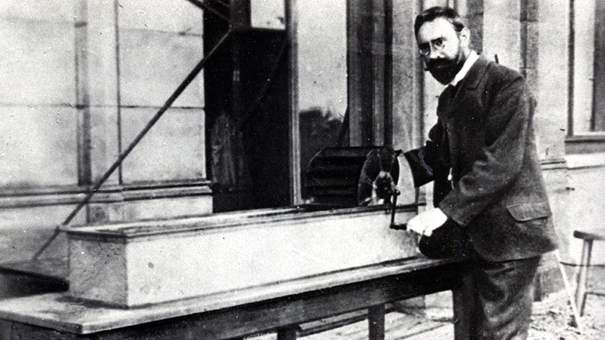
Ludwig Prandtl (1875–1953), the “father of modern aerodynamics”, at his water channel, which is still named after him today. Image by DLR and licensed under CC BY 3.0 DE.
Due to the “Modellversuchsanstalt für Aerodynamik der Motorluftschiff-Studiengesellschaft” founded by Prandtl in 1907, which is today known as the German Aerospace Center (DLR), Göttingen is considered the cradle of modern aerodynamics. A fluid mechanics research pioneer and student of Prandtl from this time, Theodore von Kármán, published one of his best known works on the vortex streets, later named after him, in 1911–12. These vortex streets can often be observed in rivers and streams and were also regularly produced by Prandtl during his experiments.
This brings us back full circle to our office building, on whose façade we have depicted this vortex street, along with other symbolic works by Göttingen’s scientific greats, such as Gauss, Lichtenstein, and Noether; each, of course, in the form of simulation plots in the COMSOL Multiphysics® software.
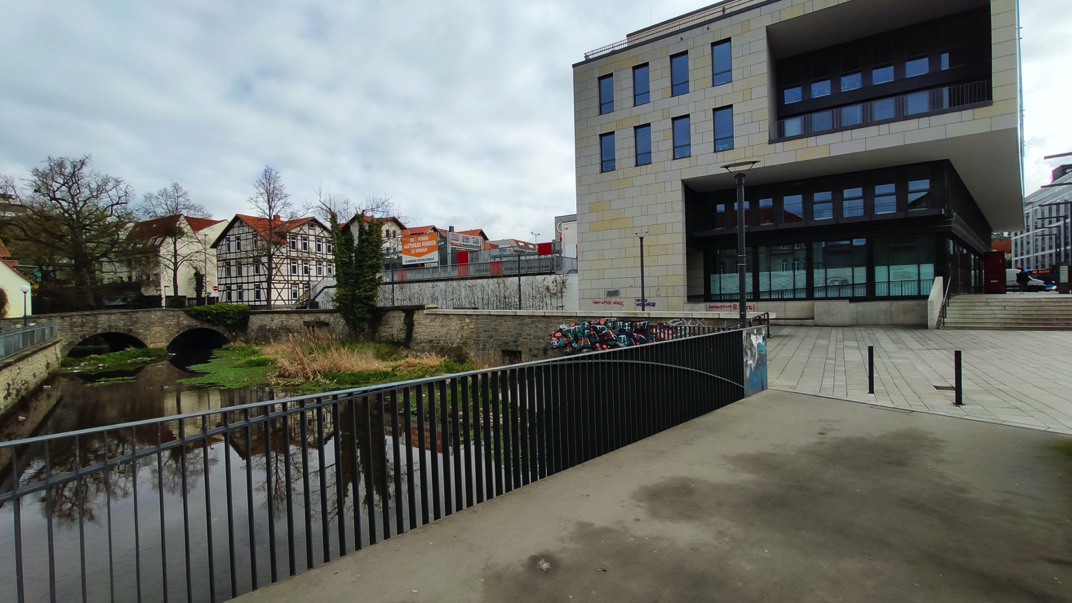
An image of the COMSOL office in Göttingen and the Göttingen Leine Canal. Fun fact: The office is ~1 km downstream from the German Aerospace Center and the location of the first comprehensive studies of the nature of fluid mechanics and aerodynamics. (Can you spot the vortex street simulation decal in the COMSOL office window? Hint: Try clicking on the photo for a closer look.)
Vortex Streets in Nature and Technology
In nature, vortex streets occur in the air and in the water.
Very clear examples are provided by satellite images of vortices in the lee of islands, such as the Juan Fernández Islands, which are made visible by clouds and are many kilometers in size.
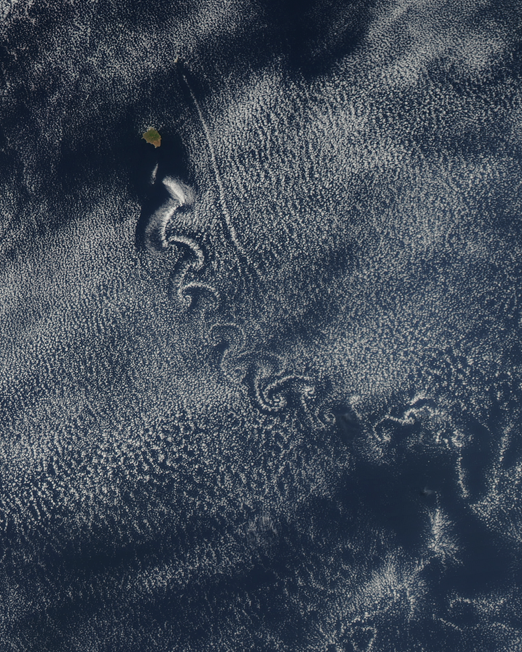
Satellite image of a vortex street in the lee of the Juan Fernández Islands. Image in the public domain via NASA Earth Observatory.
Vortex streets have also been observed on other planets. Particularly impressive and beautiful are the vortices that are tens of thousands of kilometers large, found in the lee of the famous Great Red Spot on Jupiter.
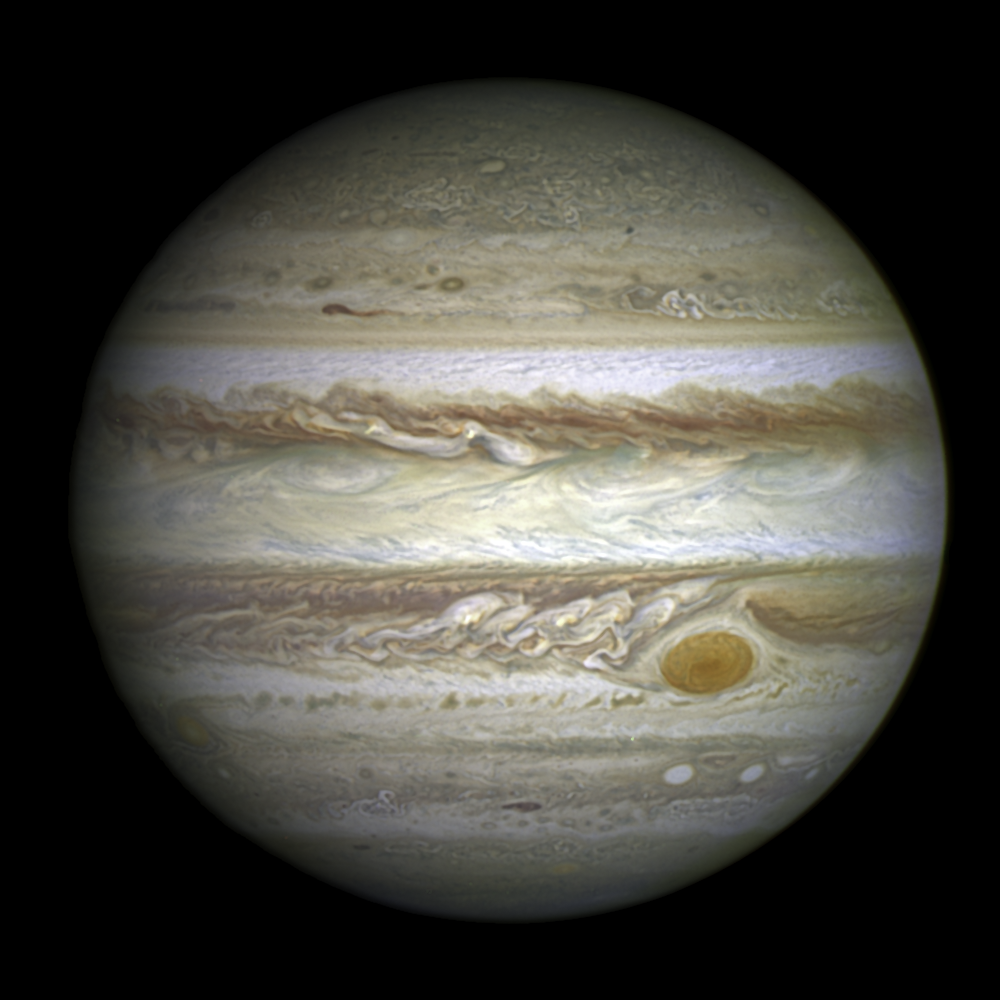
Hubble Telescope image of Jupiter with vortices to the left of the Great Red Spot. Image in the public domain via NASA, ESA, and A. Simon (Goddard Space Flight Center).
The technical importance of Kármán vortices is mainly in aerodynamics and aeroacoustics. The periodic detachment of the vortices can lead to structural vibrations if the detachment frequency of the vortices corresponds to the natural frequency of the body flowing around it.
An audible example of this is aeolian harps, but power lines can also produce sounds when the wind flows around them (though they will be unpleasant sounds, typically a low hum around 100 Hz).
The vibrations can also become quite problematic when they affect tall buildings or chimneys.
How Vortex Streets Develop
Kármán’s vortices occur when the inertial forces in a flow are significantly greater than the viscous forces. A large dynamic viscosity \eta of a fluid suppresses vortices, whereas a higher density \rho, velocity u, and larger size L of the flowed object provide for more dynamics and a less ordered flow pattern. If the factors that increase the inertial forces are put in relation to the viscosity, a dimensionless measure is obtained that can be used to characterize a flow regime: The Reynolds number:
The Reynolds number characterizes the state of a flow. In particular, depending on the configuration, there is a critical Reynolds number below which a flow is usually laminar, and above which it becomes turbulent. For the flow in a pipe, for example, Recrit = 2300.
For the flow around a cylinder and a Reynolds number less than 4, no separation occurs behind the cylinder; the flow adheres completely to the cylinder surface.
Up to a Reynolds number of about 40, the boundary layer separates and two counterrotating vortices form in the wake (steady separation bubble).
If the Reynolds number is increased further, for example, by increasing the flow velocity, these two vortices become unstable until they finally detach periodically (Re ~80). The detached vortices remain stable for a while, and so they line up downstream behind the flowed object like pearls on a necklace, until they slowly dissociate again in the flow due to friction, and finally disappear.


Streamlines around a cylinder with flow coming from the left at three different Reynolds numbers. Top: Re = 1. Center: Re = 30. Bottom: Re = 100.
Simulation of Kármán Vortex Streets
To create the beauty of vortices myself, I set up a simulation model that calculates the flow of air around a cylinder. The Kármán vortex street is a phenomenon that occurs in both 2D and 3D and in laminar flow conditions, so let’s start with a laminar 2D model of the flow around a circle.
Setting up such a model is really simple. It is just a rectangle with a cutout circle, a constant inlet velocity that is ramped up over time on the left, symmetry boundaries parallel to the flow direction, and a constant outlet pressure. I increased Re in two steps, starting from 1 over 200 up to 500 by decreasing the dynamic viscosity in the model (which is again easily done by creating a time-dependent piecewise interpolation function).
The results correspond exactly to what we could already observe in nature and made me immediately understand Kármán’s fascination for this beautiful and almost hypnotic phenomenon.
Model result of 2D flow around a circle for stepwise increased Reynolds numbers. The flow is made visible by plotting the vorticity magnitude (black = low vorticity, white = high vorticity).
Model results of 2D flow around a circle for stepwise increased Reynolds numbers. The flow is made visible by plotting the out-of-plane component of the vorticity (red = positive vorticity, blue = negative vorticity).
In addition to the rather simple laminar 2D model, I wanted to use the full power of my computer hardware on this occasion. I therefore decided to build a 3D model of a 10 cm diameter cylinder, with air flowing around it at a velocity of 0.5 m/s. This corresponds to a Reynolds number of over 5000, so the flow is turbulent. In such cases, the underlying Navier–Stokes equations for flows should be solved with a RANS turbulence model, for which COMSOL Multiphysics offers a wide range of choices. However, an even more accurate result can be obtained using large eddy simulation (LES), and if I’m going to use simulation for art, I might as well do it right!
Despite the complexity involved in simulating turbulent flows from a numerical point of view, setting up the LES flow model in COMSOL Multiphysics is just as simple as the laminar flow model. The side boundaries of the box in which I am computing the flow are equally defined as symmetry boundaries, which means that no boundary layer meshing is needed there, and no developed flow profile is needed at the inlet.
At the inlet, the flow velocity is simply specified, which is ramped up from 0 to the maximum value of 0.5 m/s within five seconds using a step function. At the outlet, the pressure is fixed and the standard no-slip boundary conditions are applied at the cylinder. The box through which the flow passes is 1 meter long, 10 cm high, and 50 cm wide.
Nowadays, a simulation model with more than 1.3 million degrees of freedom is a task that can be solved on my workstation overnight. Therefore, I started computing the model, and on the next morning, I was able to evaluate the results.
To make the vortices visible, I created a horizontal cut plane through the center of the box, on which the so-called Q-criterion, an established method for vortex identification, is visualized. In addition, the pressure distribution on the cylinder is visualized by means of color representation. The pressure clearly oscillates with the frequency of vortex shedding, which is visible in the animation.
The Q-criterion for identification of vortices is visualized on a horizontal cut plane in the 3D model of turbulent flow around a cylinder. The flow patterns are on a much smaller scale due to the higher Reynolds number and associated increased turbulence level.
Want More?
I hope you enjoyed our short excursion into the world of vortex streets. If you want to know more about the history of aerodynamics research, I highly recommend a visit to the German Aerospace Center in Göttingen, where some of the very first wind tunnels can still be visited. You can even play with Prandtl’s water channel from the image above.
However, if you would like to create beautiful Kármán vortex simulation images and animations yourself (and from the comfort of your own workstation), you only have to open COMSOL Multiphysics. For a computationally inexpensive way to start, I recommend the Flow Past a Cylinder tutorial model from the Application Gallery.




Comments (10)
Victor Martinez
June 2, 2021Really cool. How does one go about plotting the Q-Criterion for an unsteady turbulent flow past a rotating geometry for example a wind turbine and such. Cheers.
Phillip
June 3, 2021 COMSOL EmployeeThanks Victor. As described in the cited paper, the Q-criterion is something like
Q = 0.5*(vorticity² – strain rate²) > 0,
indicating regions where rotational components dominate over the stretching component in deformation of a fluid element. You can apply it to any other turbulent 3D-model, e.g. try to plot the expression
log10(-0.5*((ux+vy+wz)^2-(ux^2+vx^2+wx^2+uy^2+vy^2+wy^2+uz^2+vz^2+wz^2)))
in an isosurface plot.
Michiel De Rop
February 22, 2022Very nice elaboration on vortices! Did you use the standard vorticity magnitude from the expression list in COMSOL, what COMSOL expression did you use for the strain rate, and why?
Phillip
February 23, 2022 COMSOL EmployeeThanks, Michiel. I used the expression (ux+vy+wz)^2 as vorticity² and ux^2+vx^2+wx^2+uy^2+vy^2+wy^2+uz^2+vz^2+wz^2 as strain rate², as described in my reply to Victor above. This was just the easiest way for me. You could probably also use predefined expressions from the list.
Alan Andonian
May 12, 2022Hi, could we please have access to the files? Or a workshop on how to mesh and make beautiful images and videos. Thank you in advance.
Phillip
May 12, 2022 COMSOL EmployeeHi Alan, the Flow Past a Cylinder tutorial model file is already linked in the blog post. To make these kind of high resolved images and videos, you just need to make sure that you are using a fine mesh and small time steps for the computation and a high fps (frames per second, e.g. 30) rate + high image resolution when you export the video files. If your video file covers 10 seconds, you need define 300 time steps and export each time step in the video file. This will result in a smooth animation.
Adam Cox
February 23, 2023Hi there, I’m trying to model something similar and I’m getting inaccurate results or very long solving times (or both).
Do you know how fine the mesh (# of elements) and what type of mesh was used for this model? Do you also know how small the time step used was? Were there any initial conditions set or initial studies carried out to speed up the solving? Cheers.
Phillip
February 27, 2023 COMSOL EmployeeHi Adam, I don’t remember the exact settings here. I know I started with the tutorial model linked in the blog post. I would recommend starting with a coarse mesh and moderate time steps, which should give quick results, and then gradually increasing the mesh size in the regions of interest (i.e. within the downstram area behind the cylinder). Also, try to increase the inlet velocity using a step function starting at 0 to help the solver get a fast initial solution.
Alan Andonian
September 2, 2022I was trying to get a turbulent model for the time dependent problem of flow past a cylinder. Specifically for the reynolds numbers of 2000-5000. But I was not getting any osciallations in the lift on the cylinder. please let me know what I can do differently. Thank you in advance.
Phillip
September 5, 2022 COMSOL EmployeeHi Alan, please make sure that your mesh is fine enough and the time steps taken by the solver are small enough to be able to resolve the development vortices in space and time properly.