
For many structural engineers, beam theory is a popular analysis tool. Using the equations can be beneficial when considering structural behavior, as they are easy to apply and provide useful results. However, it’s also known that due to the simplicity and convenience, beam theory is applied even when some underlying assumption may not hold up too well. This blog post investigates one such case, where there are severe pitfalls of using beam theory, and the true structural behavior is surprisingly different.
A Thought Experiment
Take a look at the pipe model shown below. It consists of a 90° pipe bend with adjacent straight legs and a moderate-to-thin wall thickness. The material is assumed to be isotropic and linear elastic. Now, imagine bending this pipe in the bend plane as indicated with the force arrows. While doing so, we encourage you to consider two questions:
- How does the pipe bend deform?
- Where do the highest stresses occur?
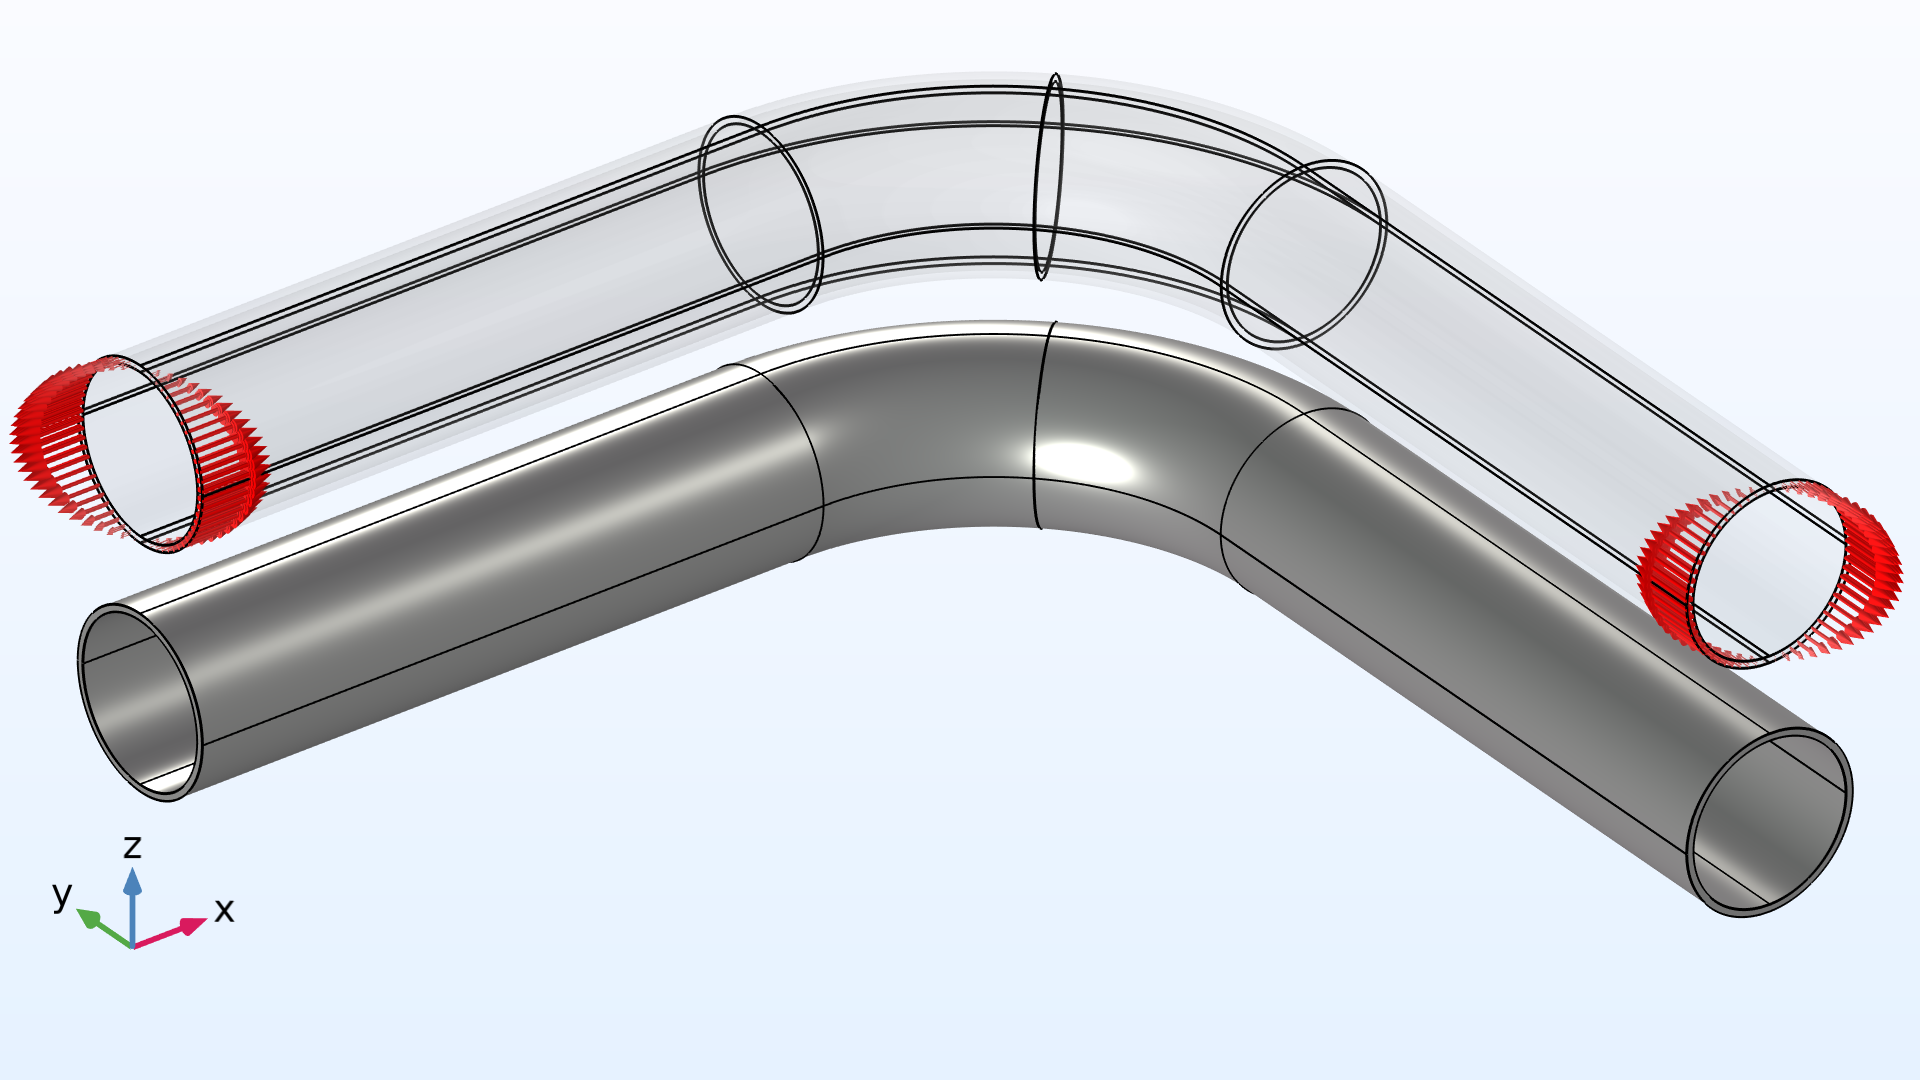
A curved pipe section with straight legs loaded in pure bending.
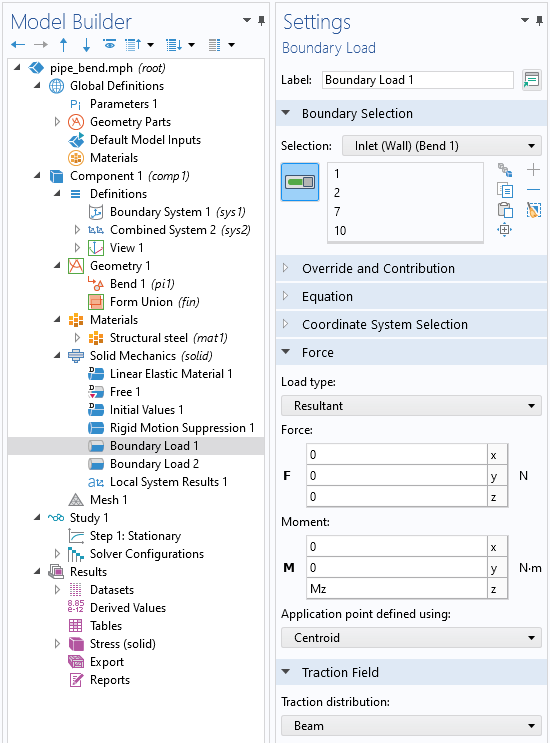
Applying a moment on a boundary results in a varying surface traction. Such a load can be easily applied in the COMSOL Multiphysics® software as of version 6.1 using the Resultant load type in the Boundary Load feature.
Do you have answers in mind? If so, play the following animations to view the von Mises stress and the deformation for a 3D solid model loaded with a varying bending moment.
The von Mises stress distribution and deformation of a curved pipe loaded with a varying bending moment.
A detailed view of the von Mises stress distribution and deformation of the cross section at the center of the bend for a varying bending moment.
The pipe is slender with a constant cross section, so it would seem like a natural choice to treat such a structure as a beam in a simplified analysis. The bending moment is the only load acting on the structure, and it’s thus constant for any given section along the entire beam axis (both in the straight and curved pipe segments). Beam theory predicts that the axial stress has its peak values at the inner-most and outer-most fibers in the bend plane. But, defying beam theory, the opposite happens!
As shown in the animations, the von Mises stress distribution reaches its peak at the top and bottom of the pipe. The maximum stress even occurs on the inside of the pipe. The cross section of the bend also deforms significantly, and, more specifically, it ovalizes with the major axis either being oriented in the bend plane or perpendicular to it depending on the direction of the bending moment.
Analyzing Pipes with Beam Theory
Pipe bends are common in piping systems, which typically transport liquids or gas, often under high pressure. One place where you may find a lot of pipes are oil tankers. The labyrinthine piping systems can look pretty fascinating.
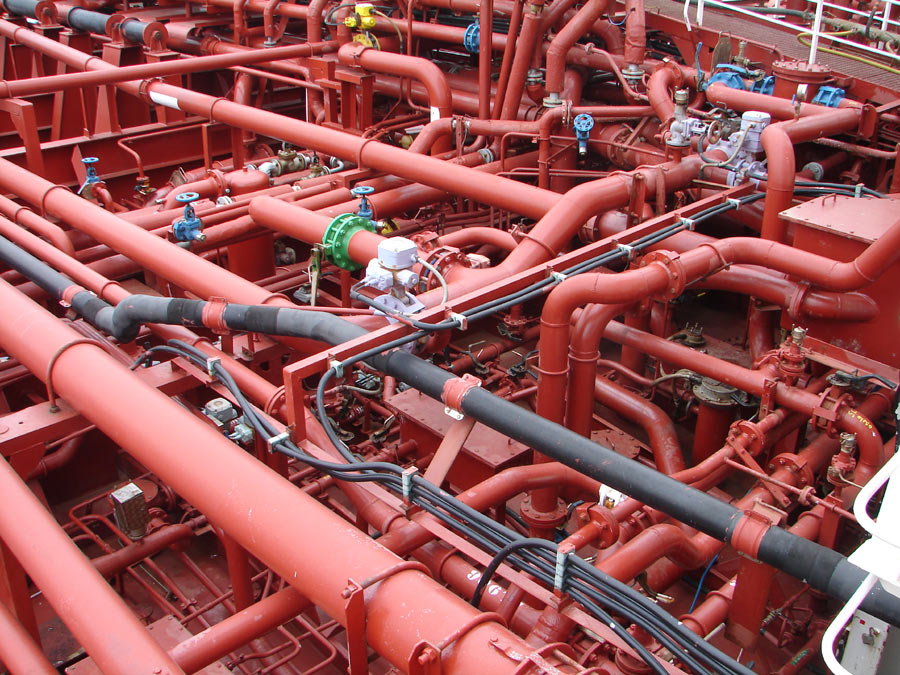
Piping systems on an oil/chemical tanker. Image licensed under CC BY-SA 3.0 via Wikimedia Commons.
Many piping standards (or codes) used for industrial applications are based on beam theory when it comes to the structural analysis. But, as we have already discovered, pipe bends generally do not behave like beams. When digging in piping standards, you will in fact find a lot of information dedicated to pipe bends. In particular, piping standards recommend to apply correction factors to the stiffness and stresses for curved pipe sections. (Ref. 1) In simplified terms, the bending stiffness from elementary beam theory, , should be divided by a so-called flexibility factor, or k-factor. Similarly, computed stresses,
, should be multiplied by a stress intensification factor (SIF), or i-factor, when comparing with allowed stress values. In other words, the ordinary beam theory may still be applied, but bending stiffness and stresses should be corrected.
Piping standards provide estimates for these correction factors, which depend primarily on the geometry of the pipe bend. In some cases, it’s also recommended to apply additional corrections to account for the effect of the pressure difference, , between internal and ambient pressure. This is because an internal overpressure tends to counteract the ovalization of the pipe cross section, which has a stiffening effect. Typical definitions for the k- and i-factors for a pipe bend subjected to in-plane bending are shown below (Ref. 2).
| Stiffness correction | Stress correction | Flexibility characteristic |
|---|---|---|
|
Correction: k-factor: |
Correction: i-factor: |
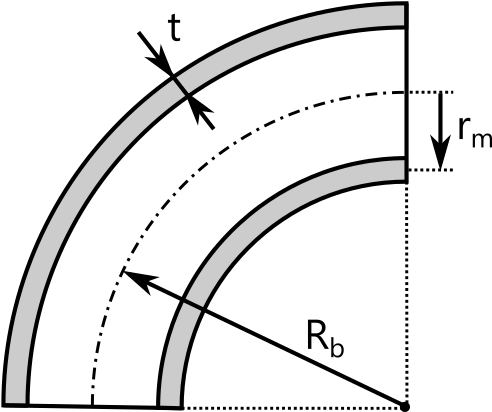 |
The flexibility characteristic, , is a dimensionless geometric measure that takes into account the wall thickness,
; the mean pipe radius,
; and the centerline bend radius,
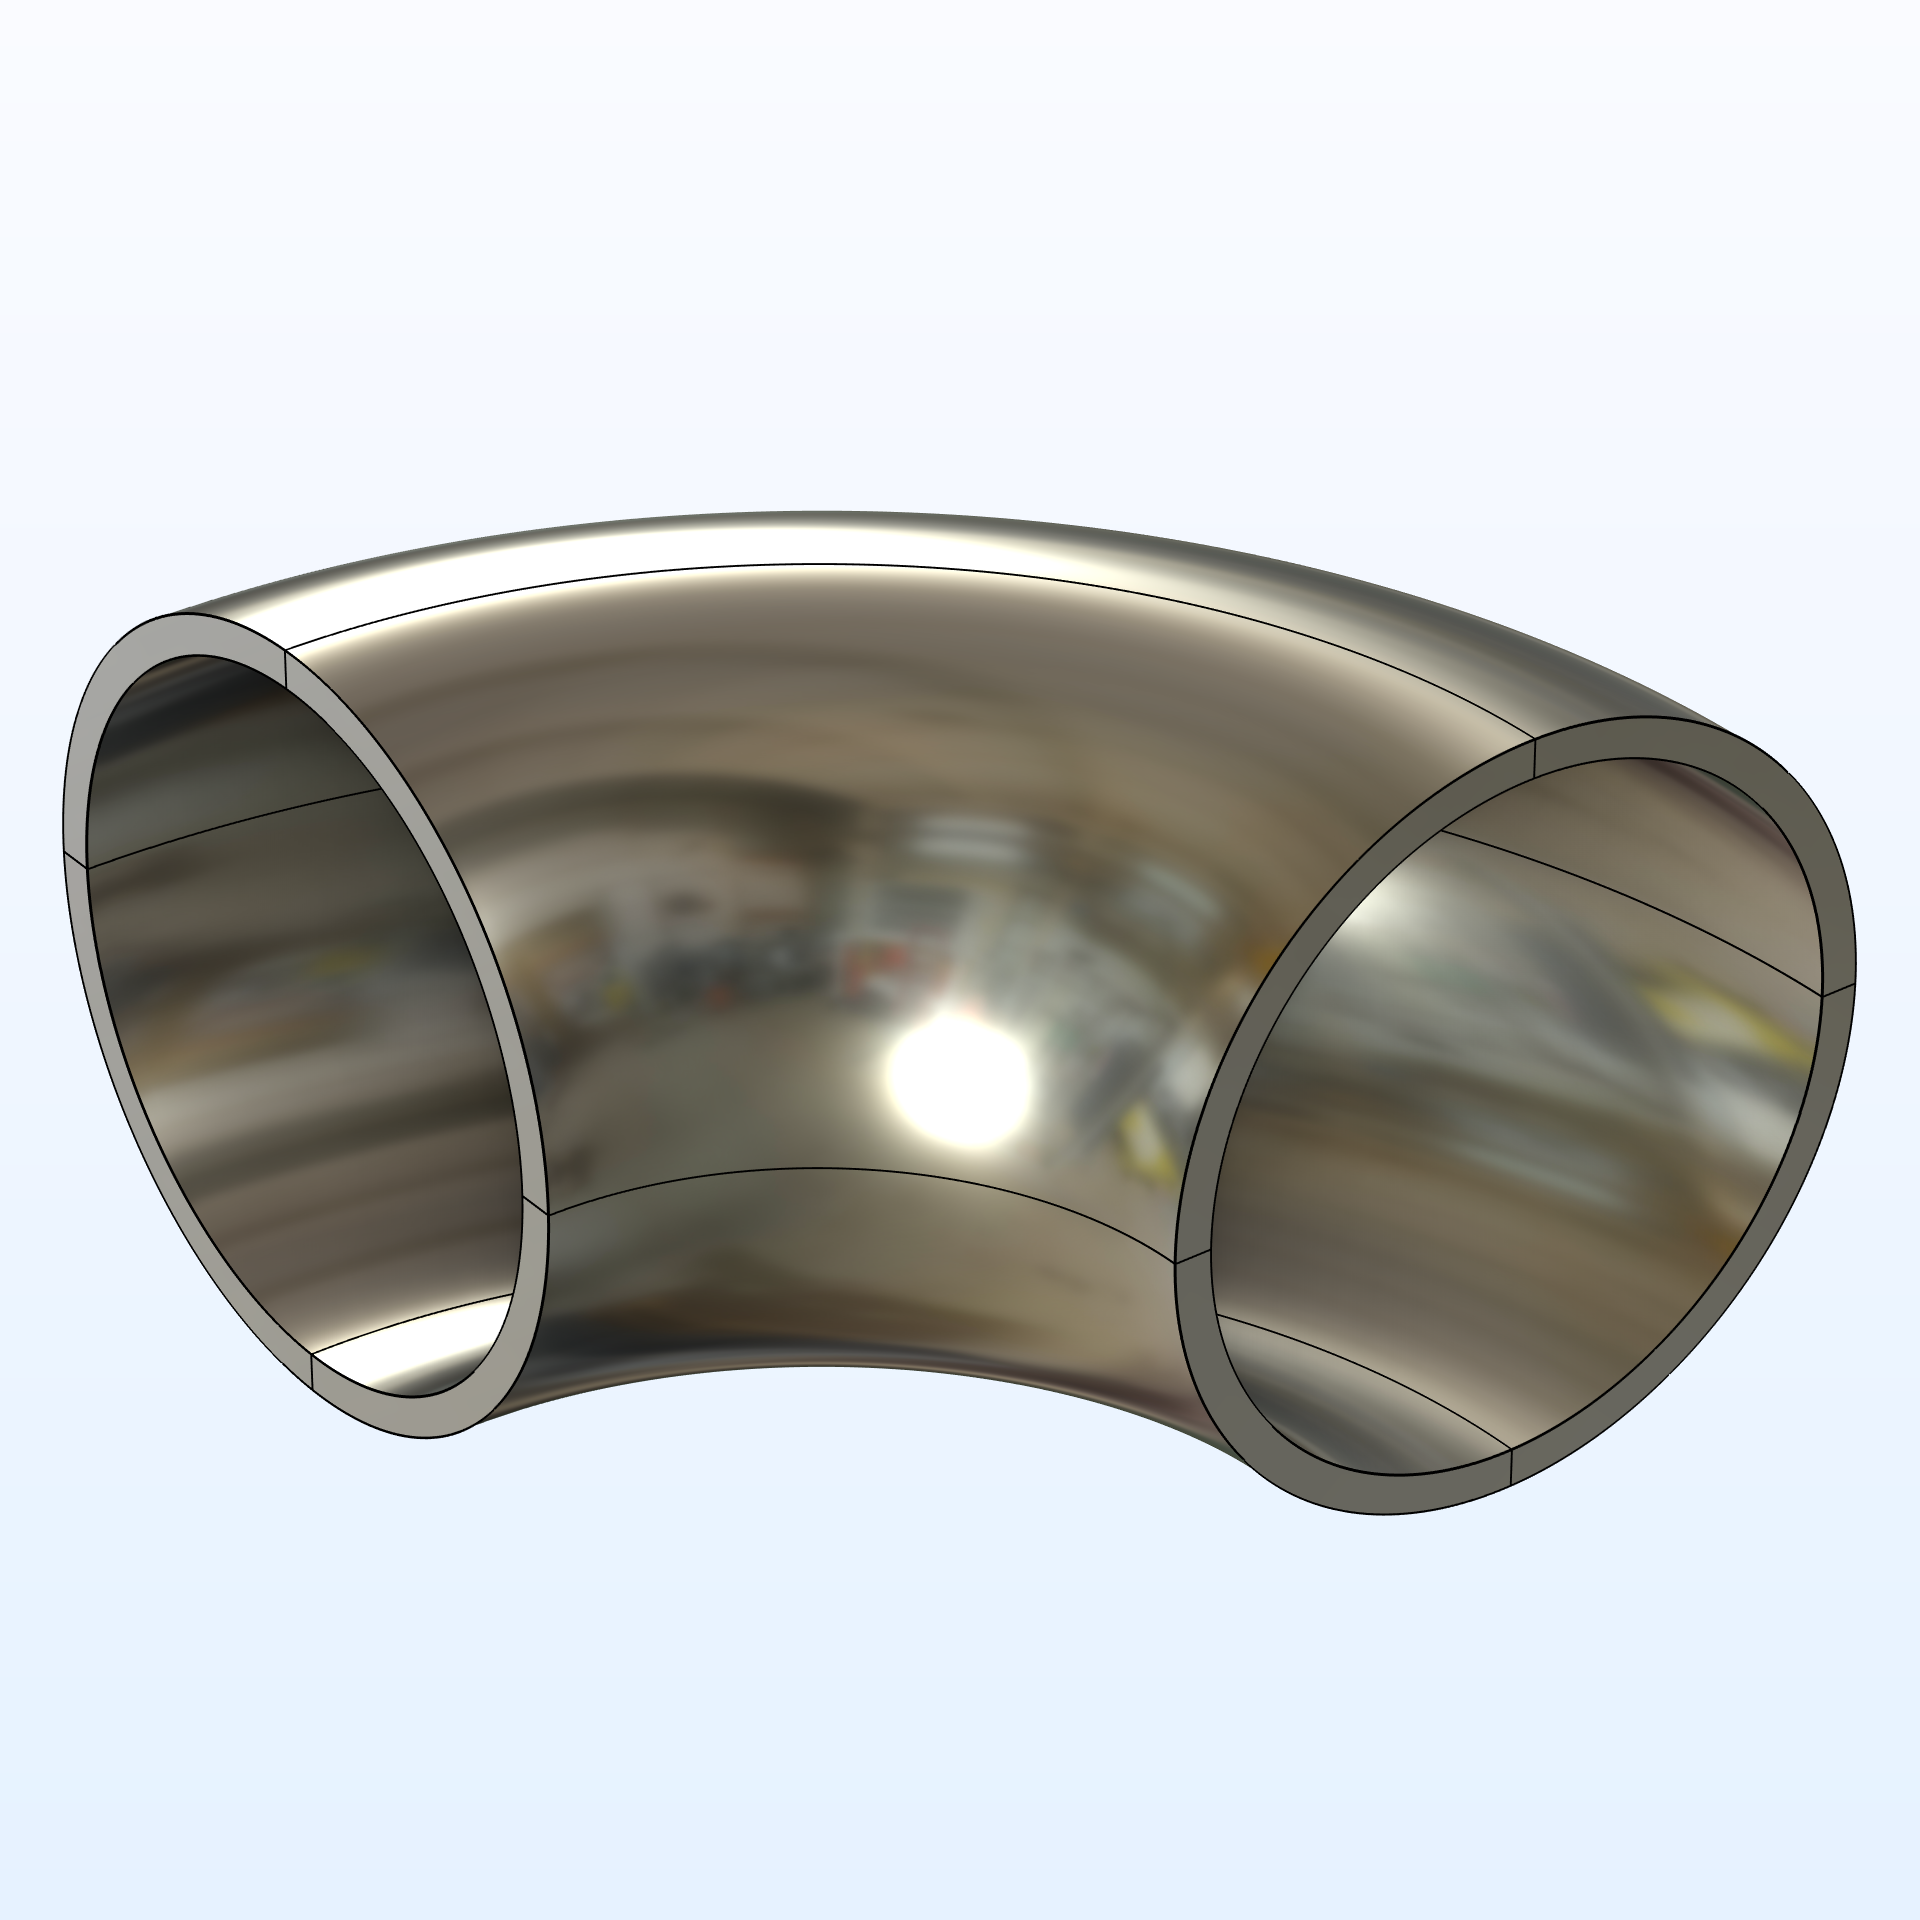
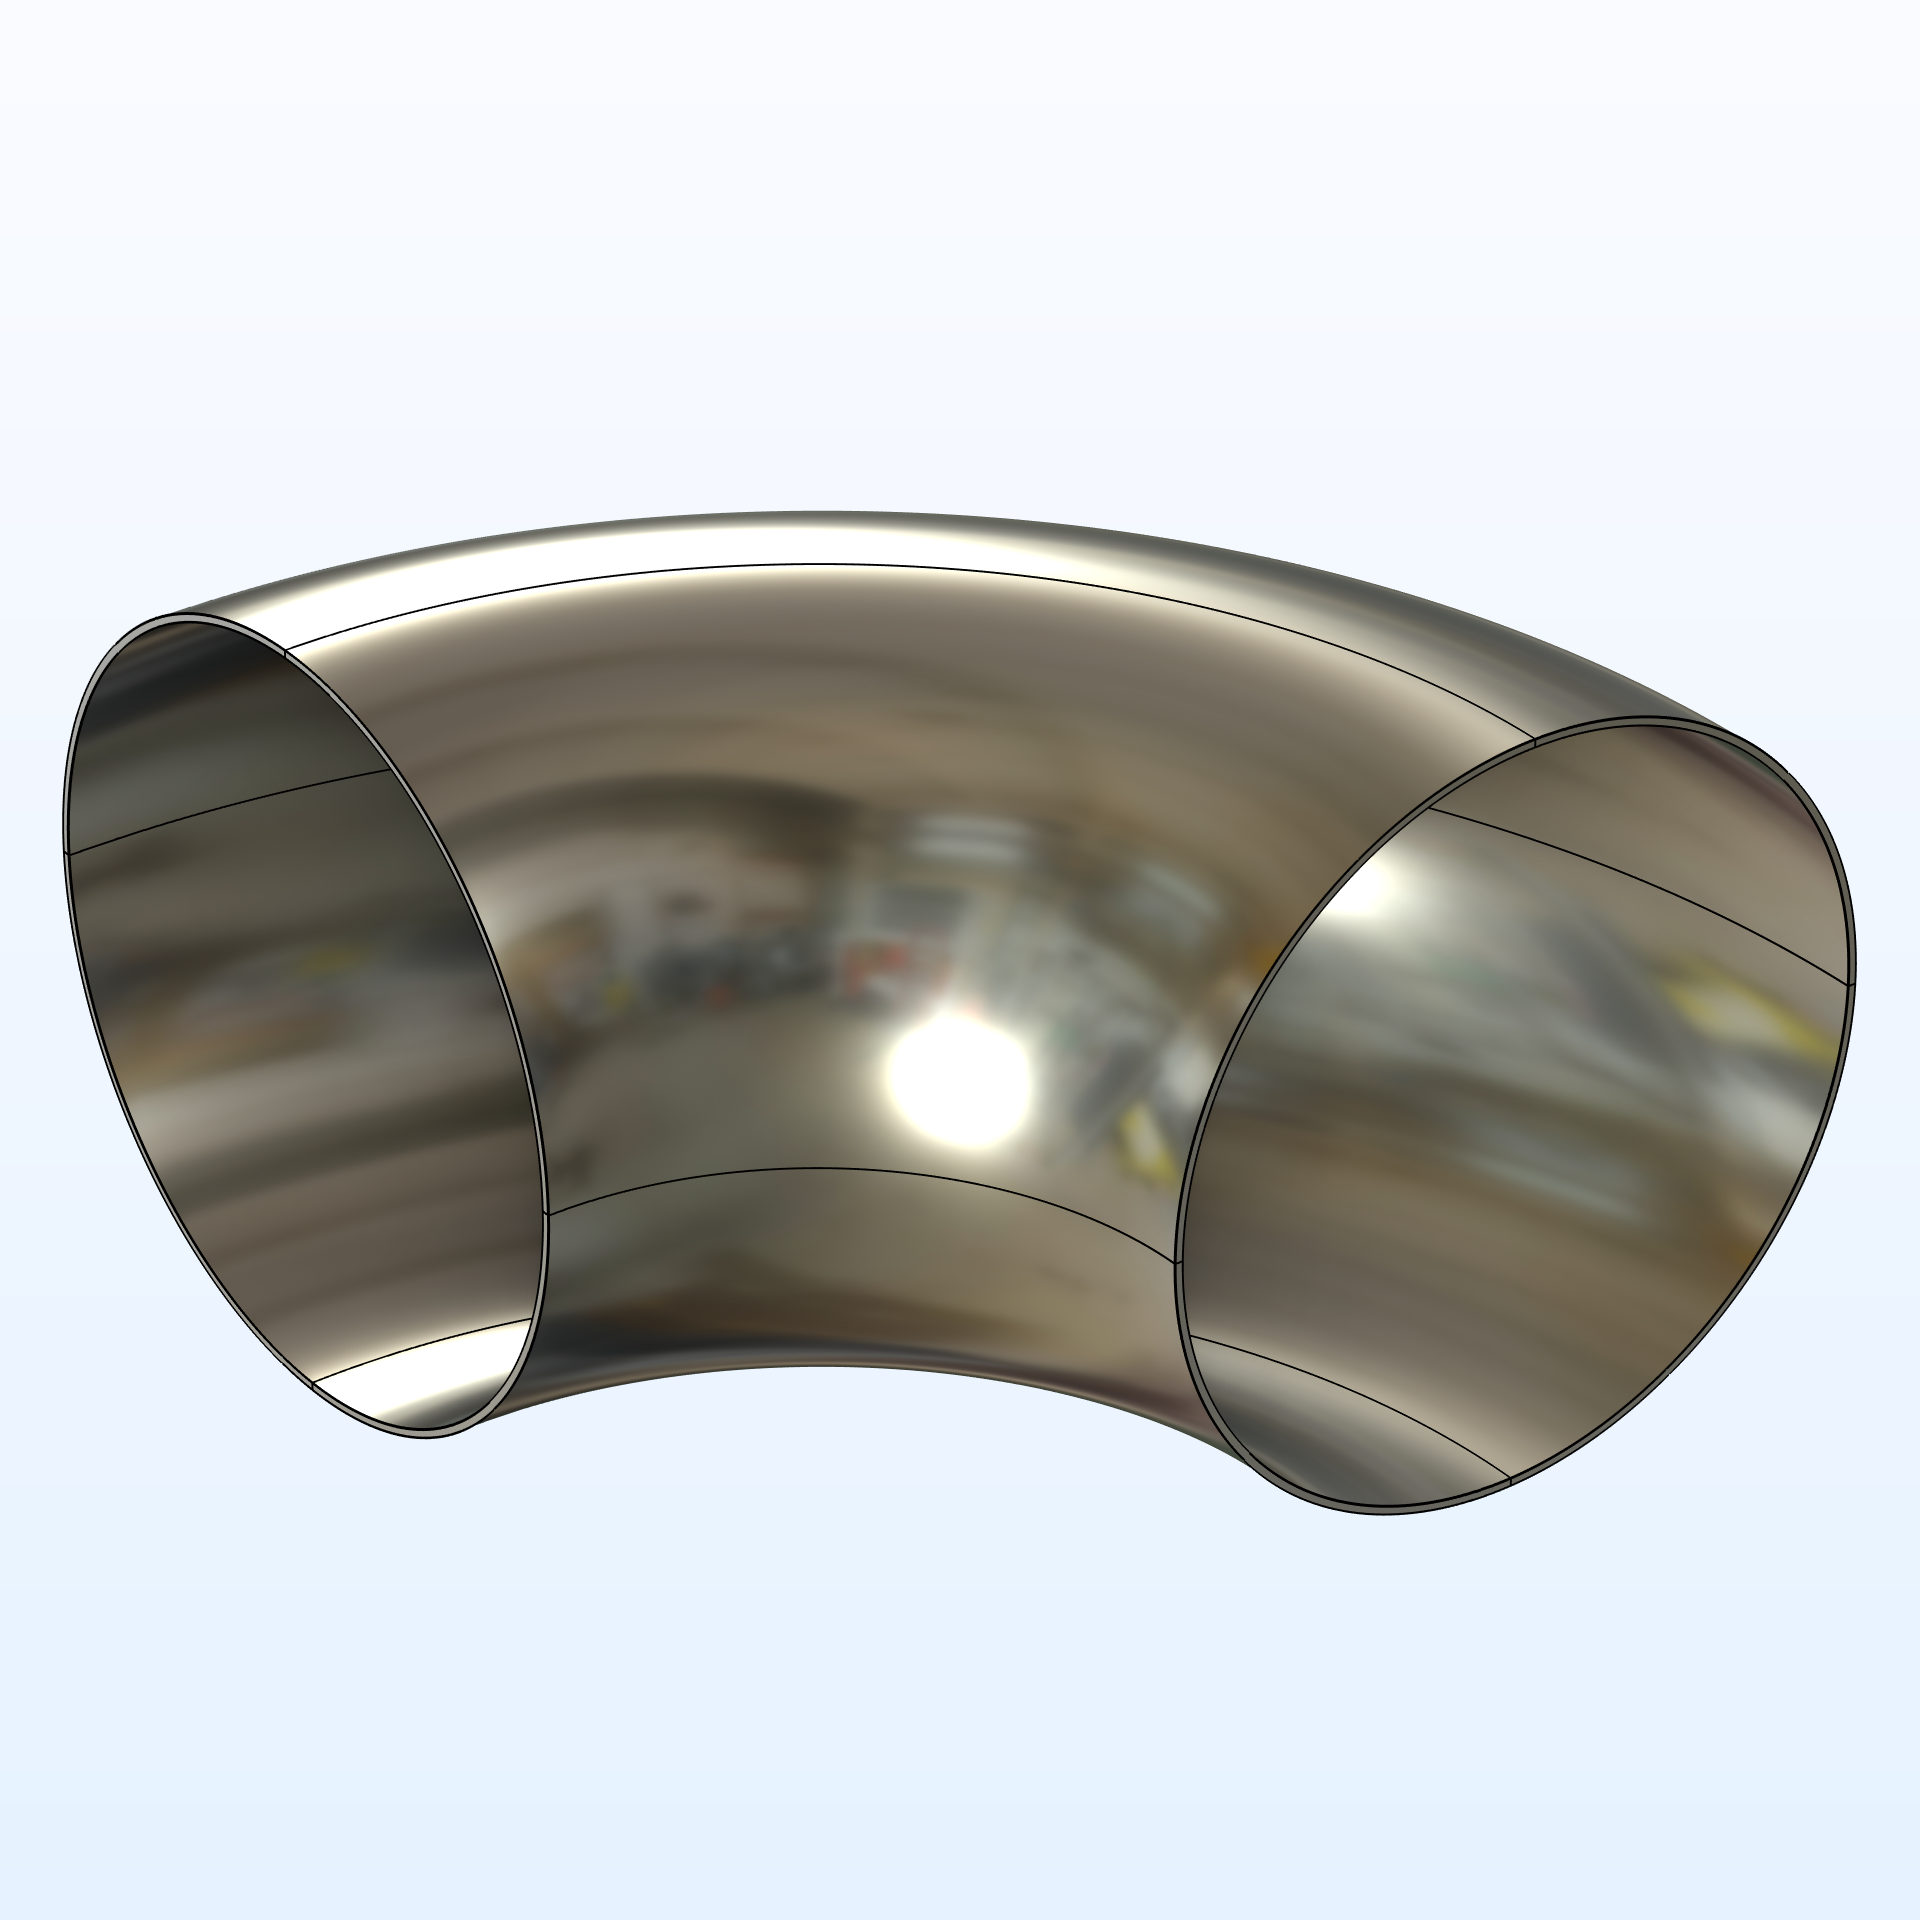
. The estimates for the correction factors are based on experimental data, or derived from higher-fidelity finite element analyses using solid or shell models. The correction factors can take rather large values, meaning that the deviation from ordinary beam theory is significant. It’s therefore crucial to consider the possible stress increase and stiffness reduction to get conservative results. The table below shows the correction factors for a range of pipe geometries. The wall thickness,
, and bend radius,
, are related to the outer pipe radius,
.
| Geometry |
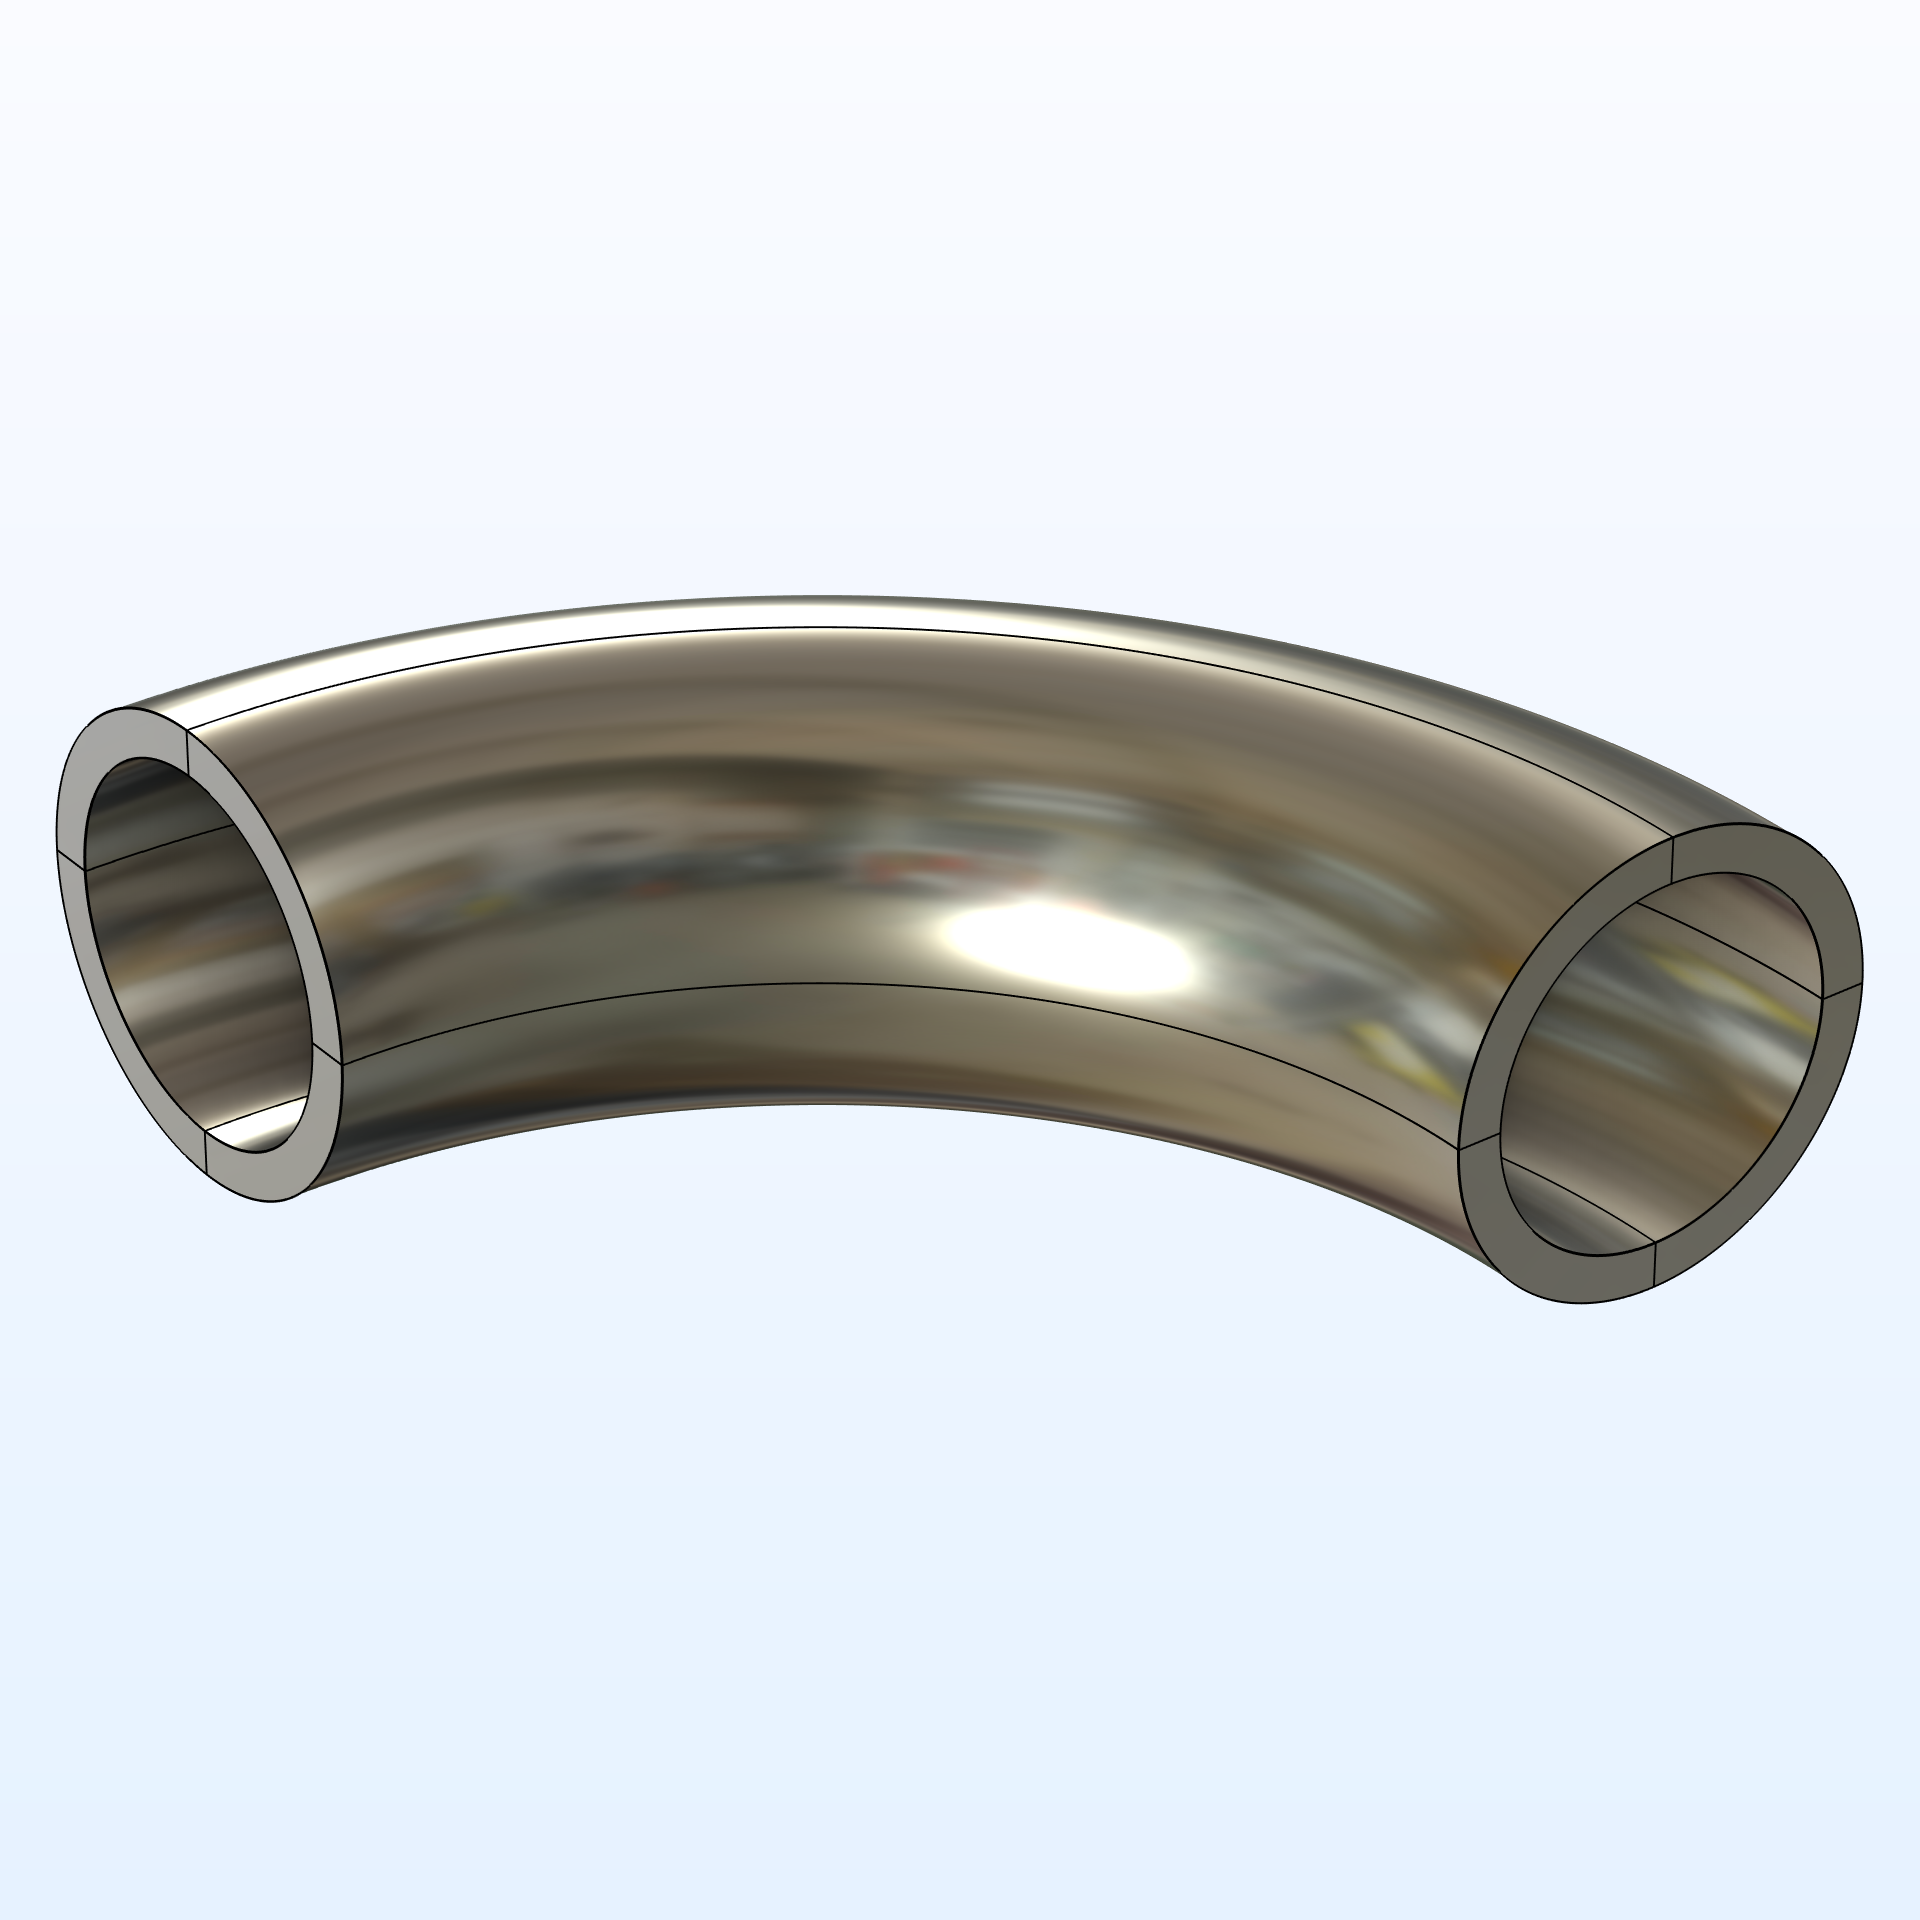
|
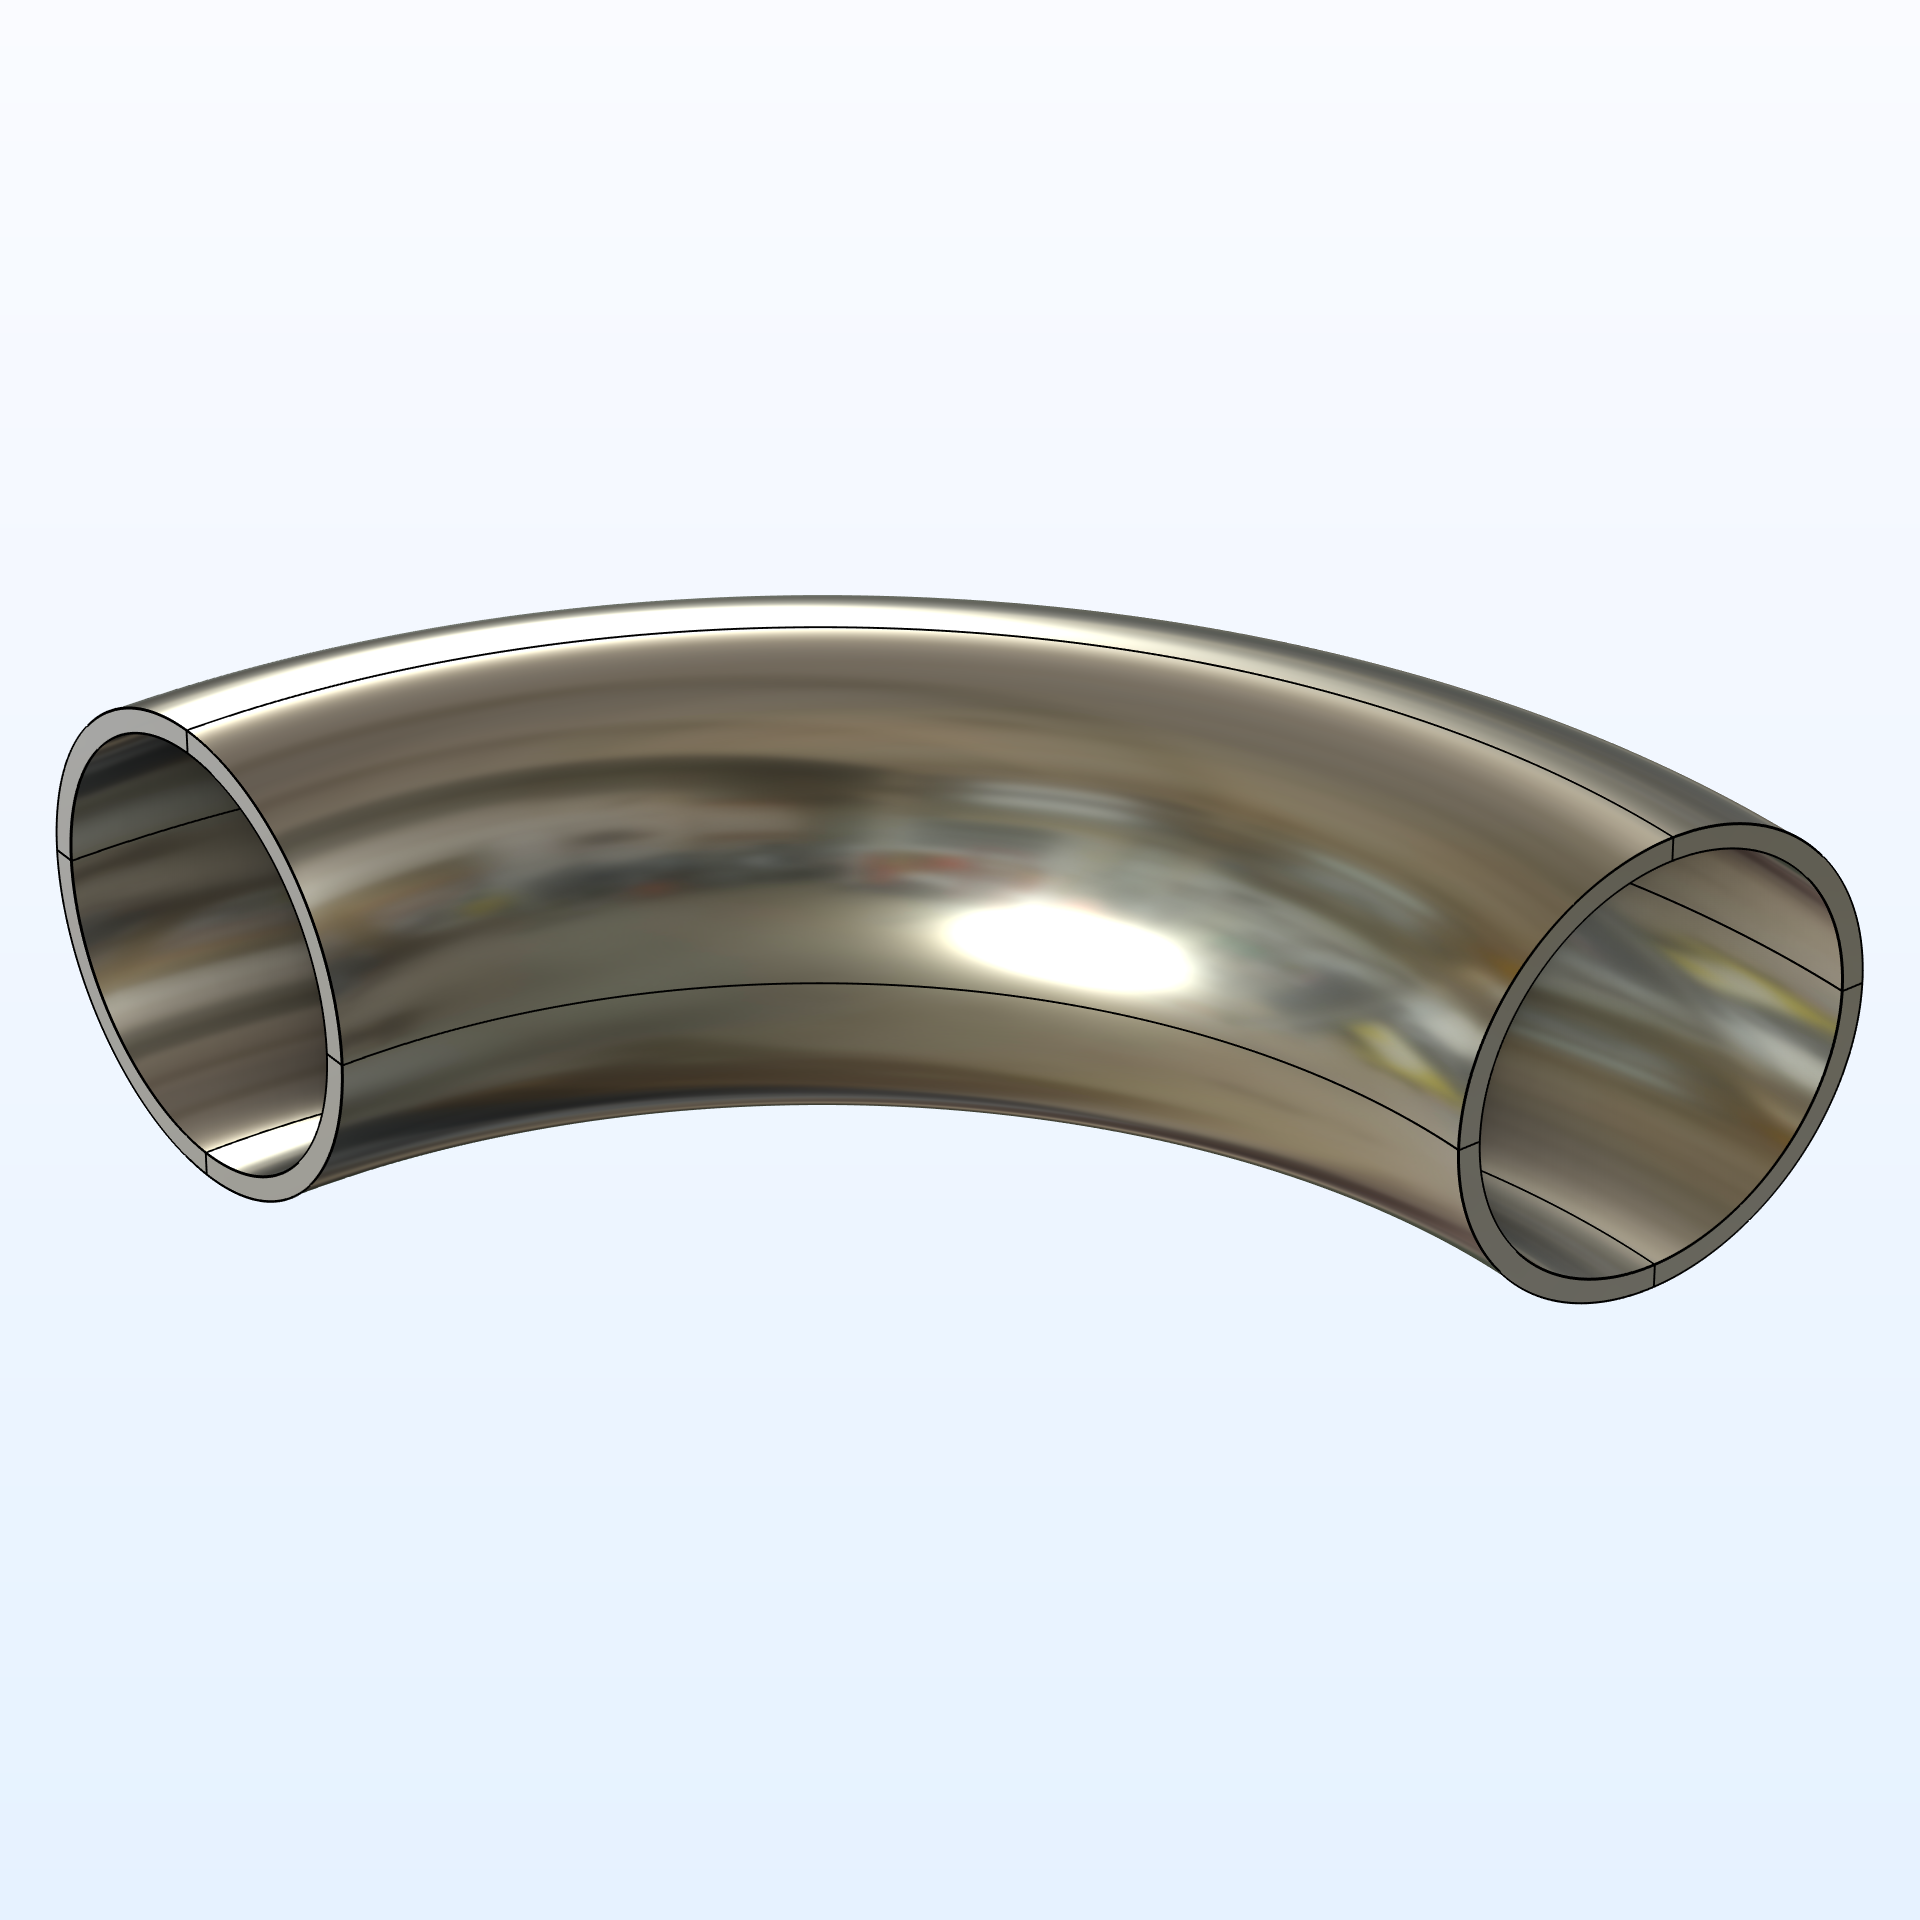
|
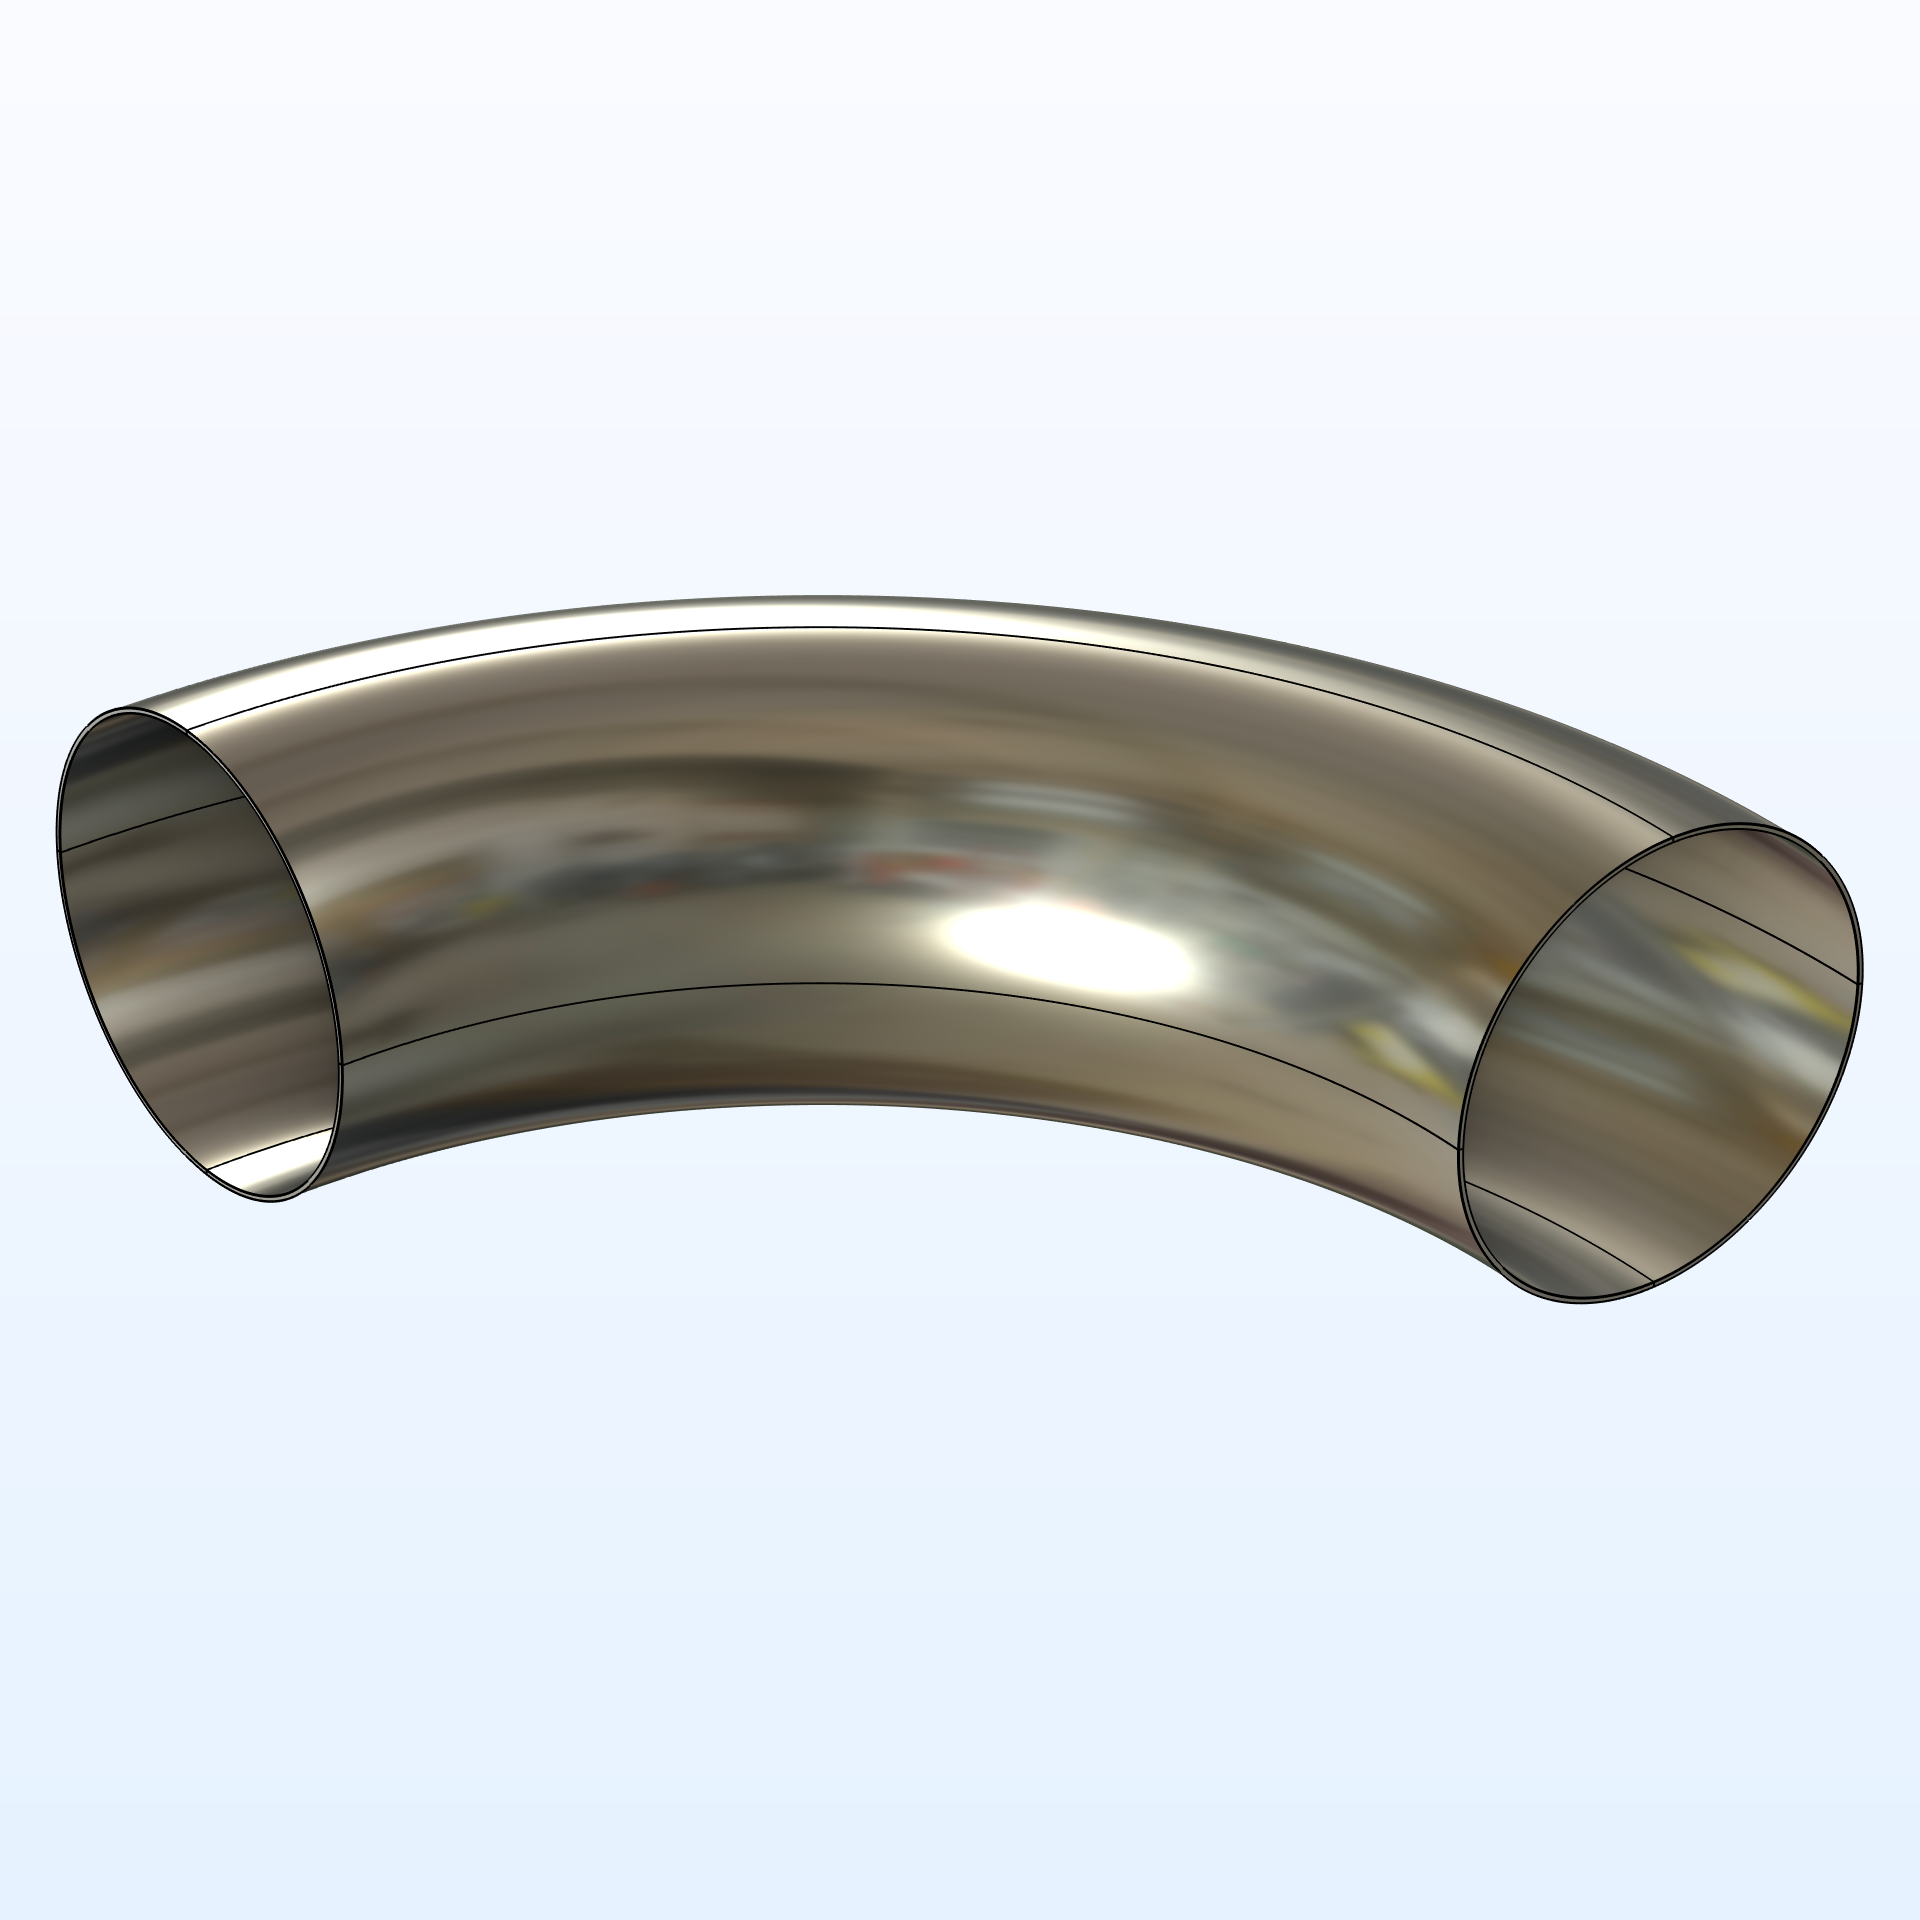
|
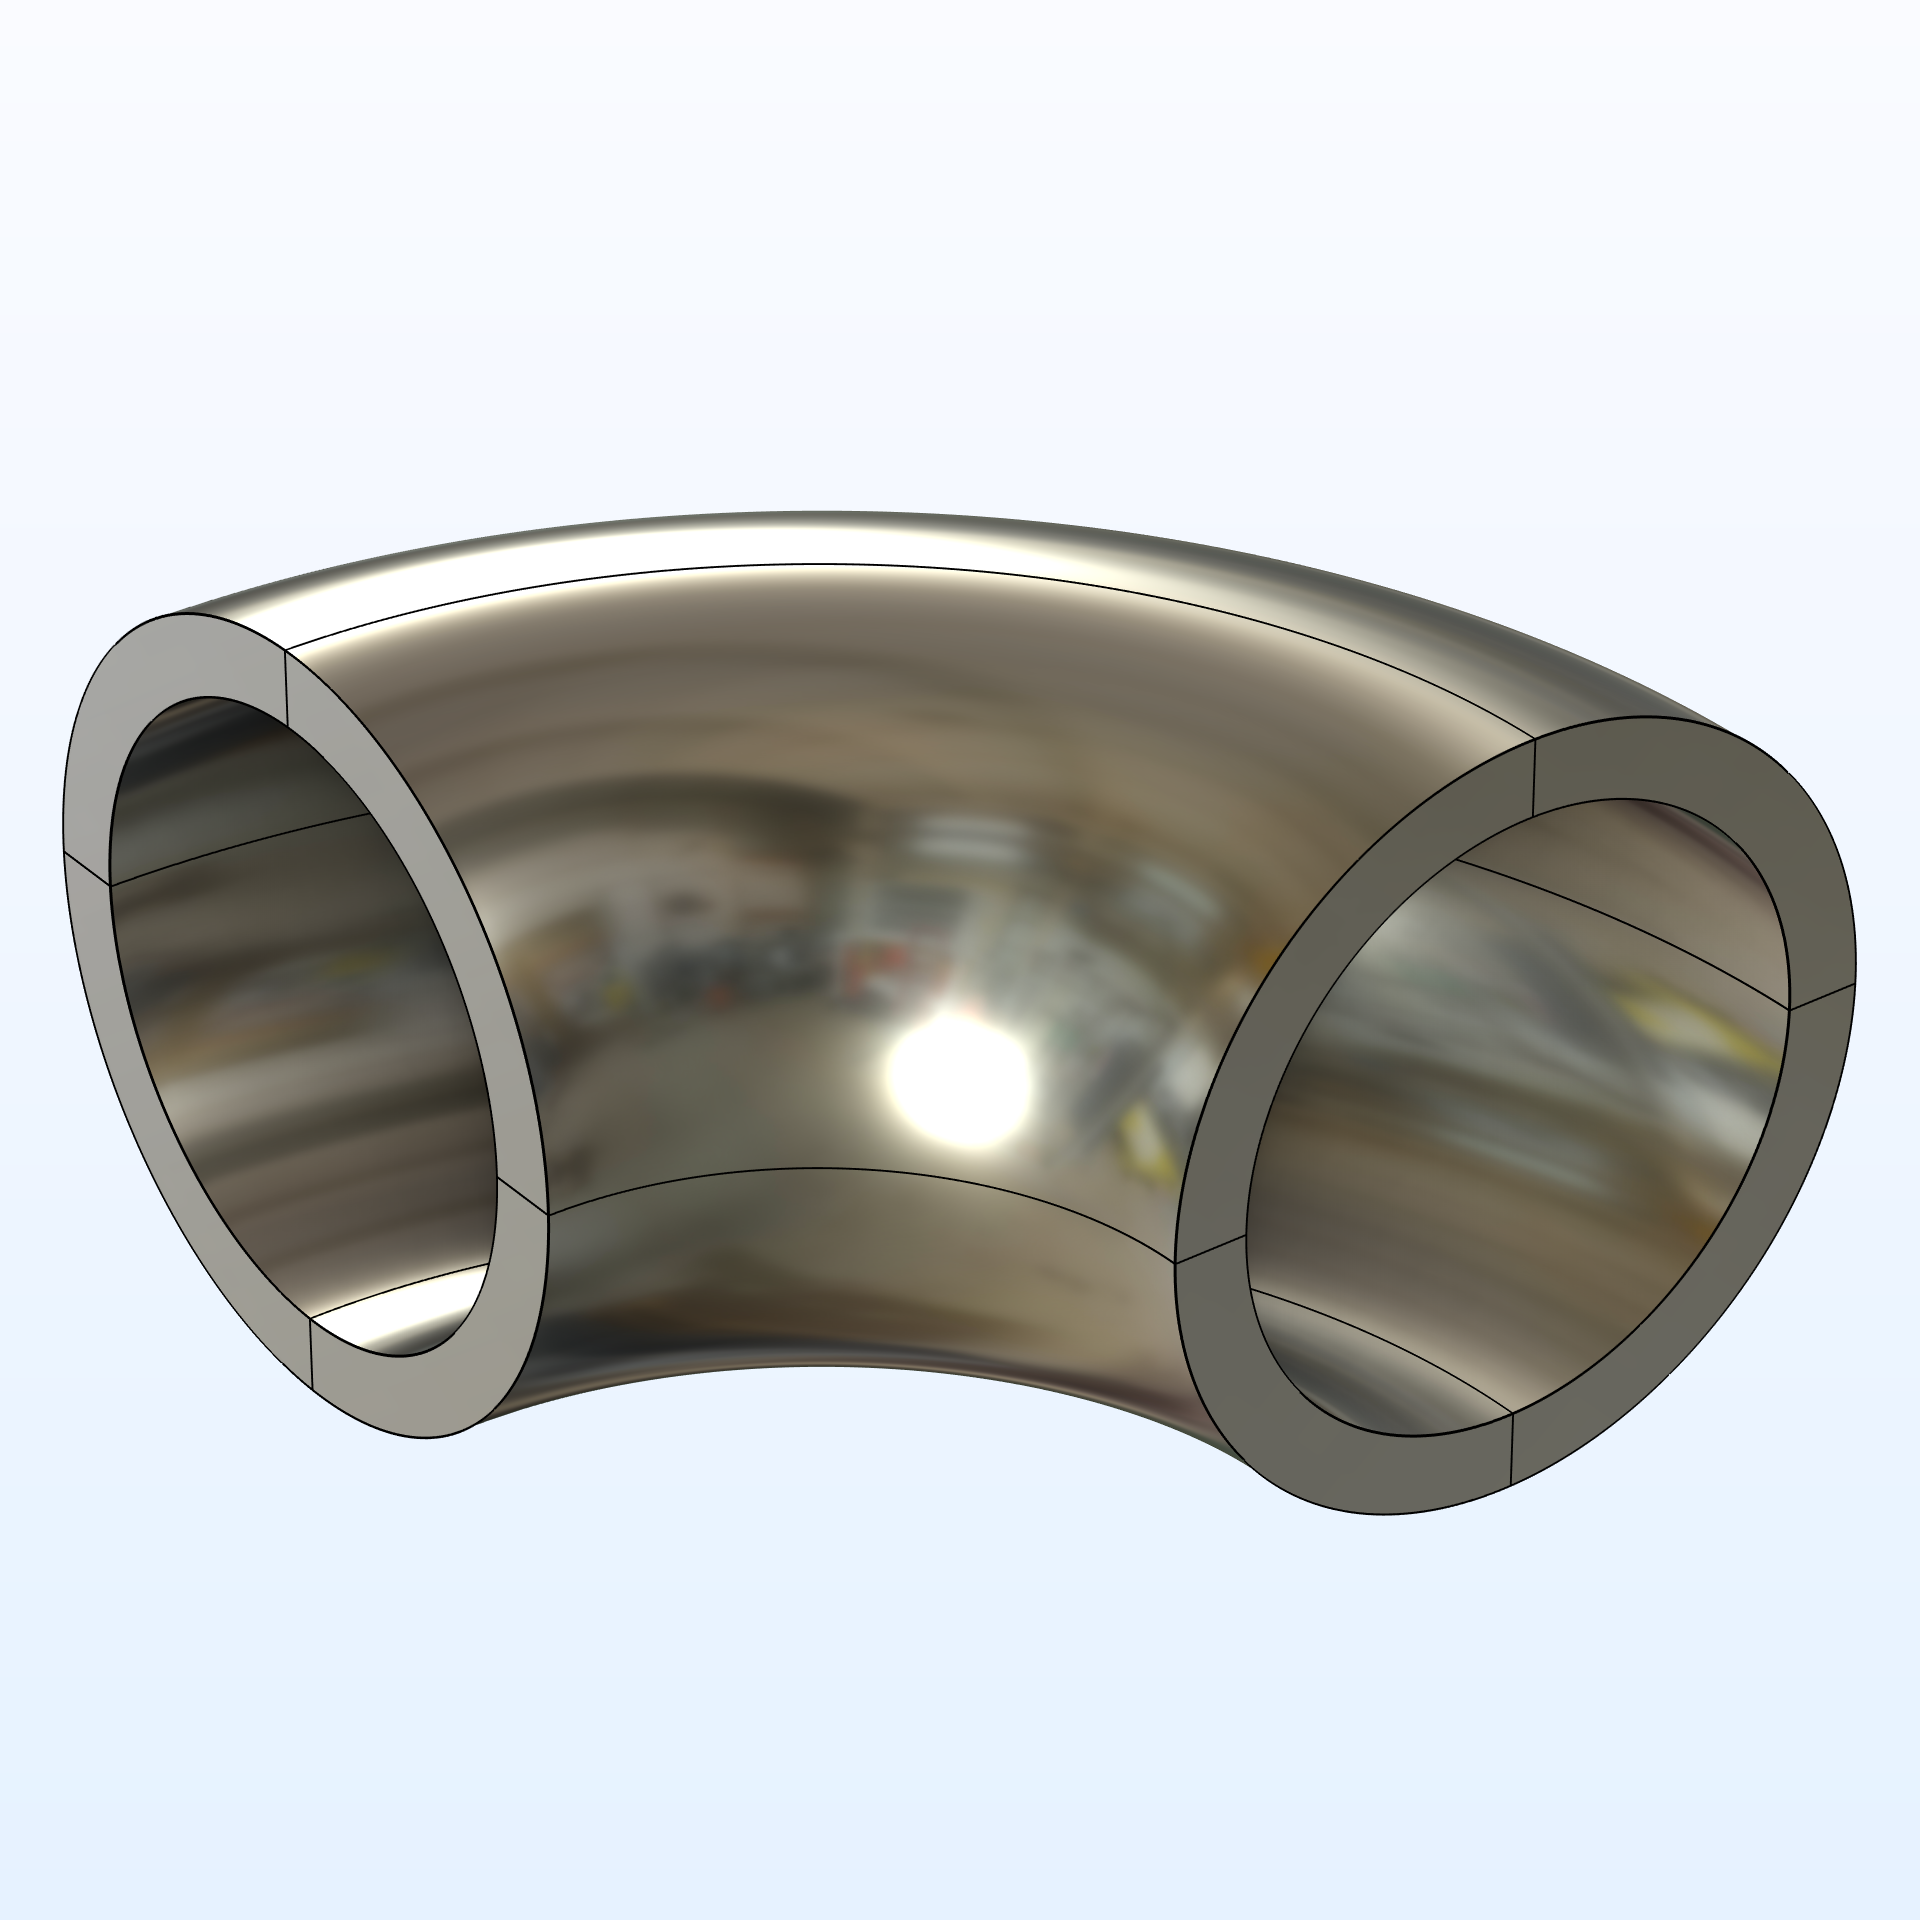
|
|
|
|---|---|---|---|---|---|---|
|
|
4 | 4 | 4 | 2 | 2 | 2 |
|
|
20% | 10% | 2% | 20% | 10% | 2% |
|
|
1.7 | 3.7 | 20.2 | 3.3 | 7.4 | 40.4 |
|
|
1 | 1.5 | 4.7 | 1.4 | 2.5 | 7.6 |
The correction factors provided by piping standards have a long history, dating back as far as the 1950s. While these corrections are still used, they are only phenomenological models and do not explain what really happens in a pipe bend. As shown in the stress plots above, the true behavior of a pipe bend is a fully 3D problem. But before we further investigate the full 3D case, let’s recall some important relations from elementary beam theory.
Curved Beams
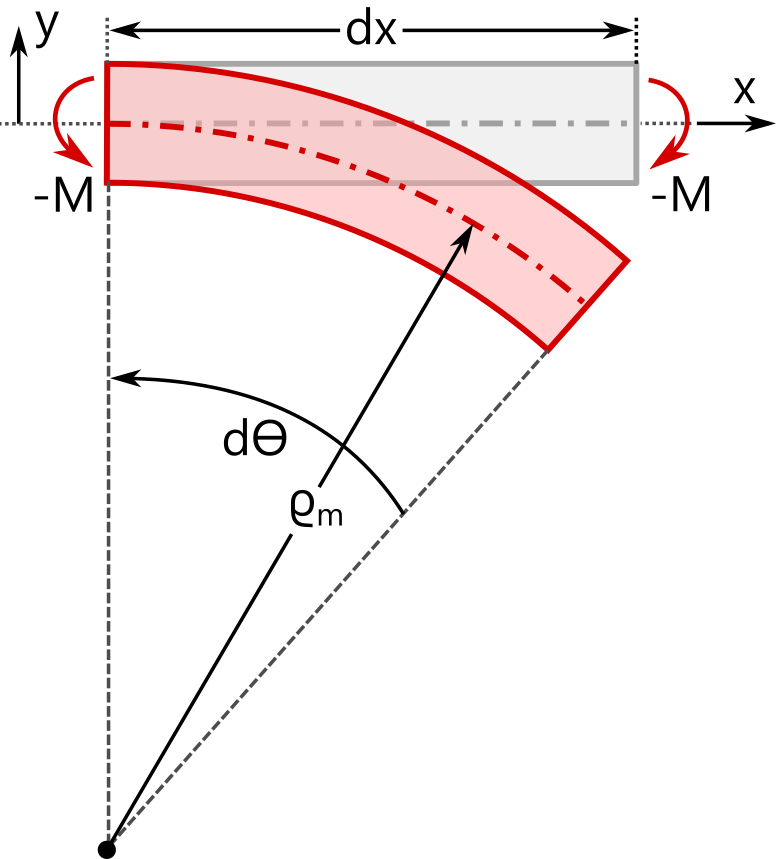
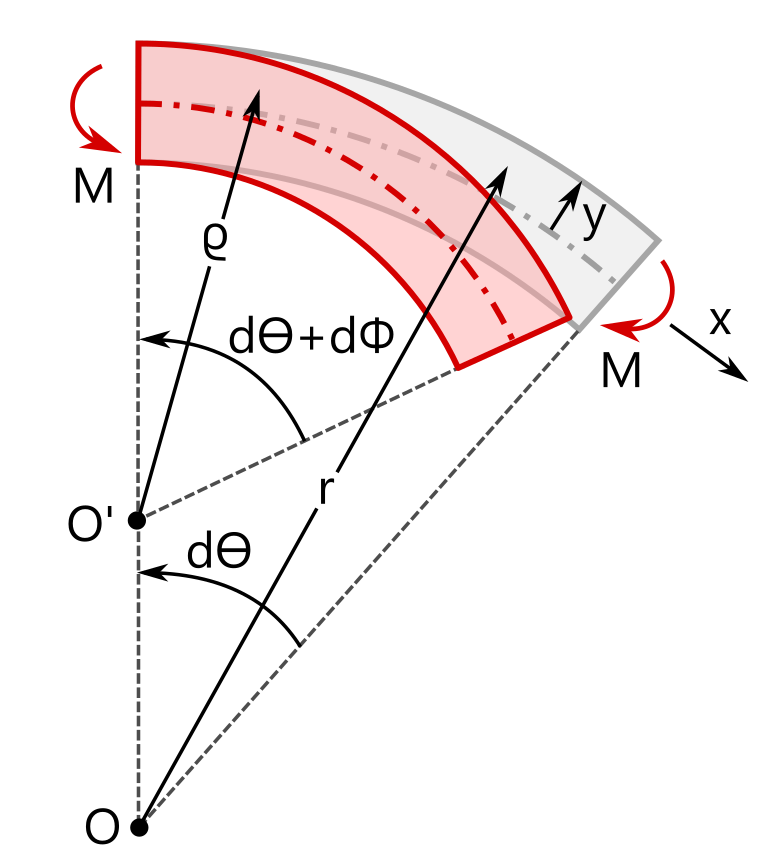
The classical beam equations are derived assuming that the beam axis is initially straight, and therefore the equations are, strictly speaking, only valid for straight beams. If the beam equations are instead derived from an initially curved beam axis, the definition of the strain along the axial direction differs compared to a straight beam, and subsequently the axial stress in the cross section differs. The assumed kinematics for the initially straight and curved beams are compared in the table below. The undeformed geometry is shown in gray, and the deformed geometry in red. The last row shows the analytic expressions for the axial stress resulting from an applied bending moment, .
| Straight beam | Curved beam | |
|---|---|---|
| Kinematics for pure bending |
|
|
| Strain |
|
|
| Area moment of inertia |
|
|
| Stress |
|
|
In the expressions above, represents the stress in the beam’s axial direction. The local coordinate
has its origin at the centroid of the cross section. For the curved beam,
is the radius of curvature of the centroidal axis. Note that the curved beam relations recover the straight beam relations when the radius
goes to infinity.
According to the straight-beam assumption, the axial stress varies linearly across the section, whereas in a curved beam the stress distribution becomes nonlinear — even with the assumption that the cross section remains plane during deformation. For a straight beam, the neutral axis (where ) coincides with the centroid (
). For a curved beam, however, the neutral axis and centroid no longer coincide, as shown in the following example.
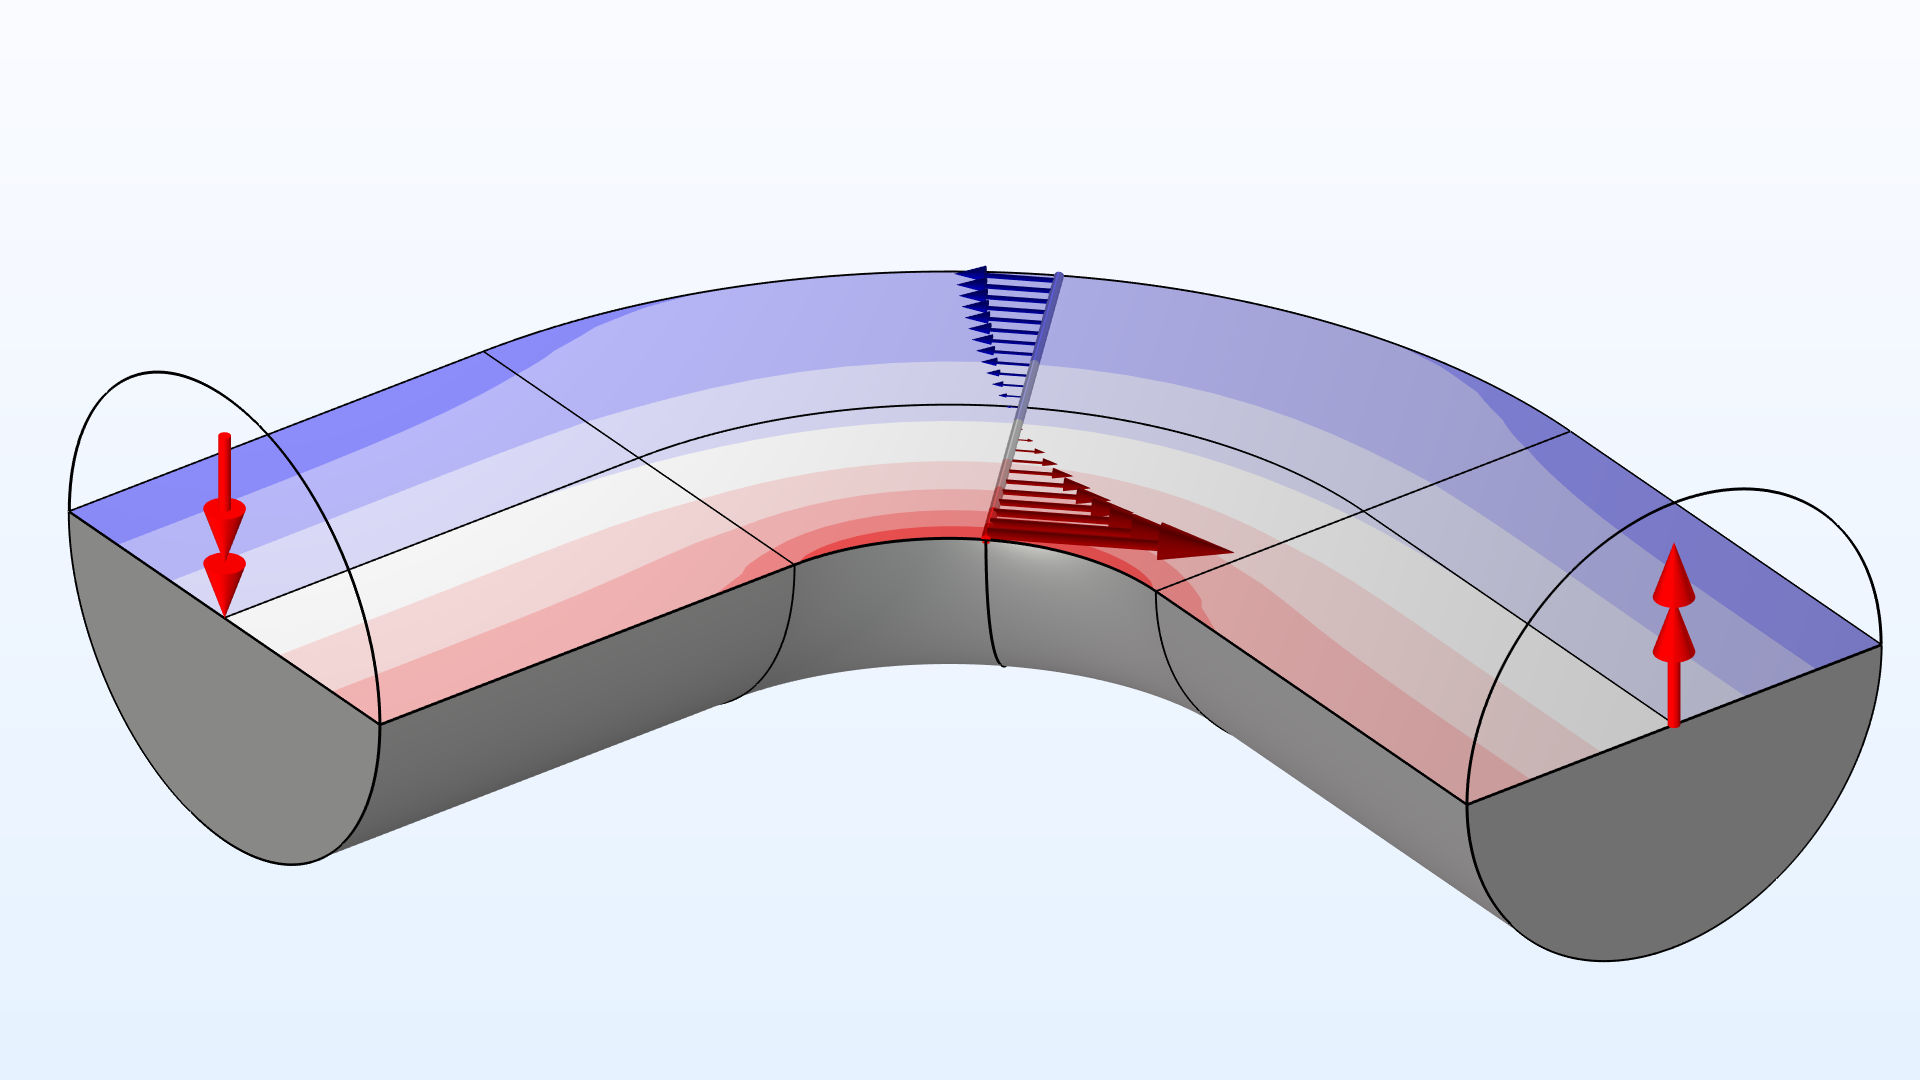
Cut through a beam with a solid, circular profile. The applied bending moments are indicated at the beam ends. The resulting axial stress, , as computed with solid elements, ranges from tension (red) to compression (blue). In the curved section,
has a nonlinear distribution.
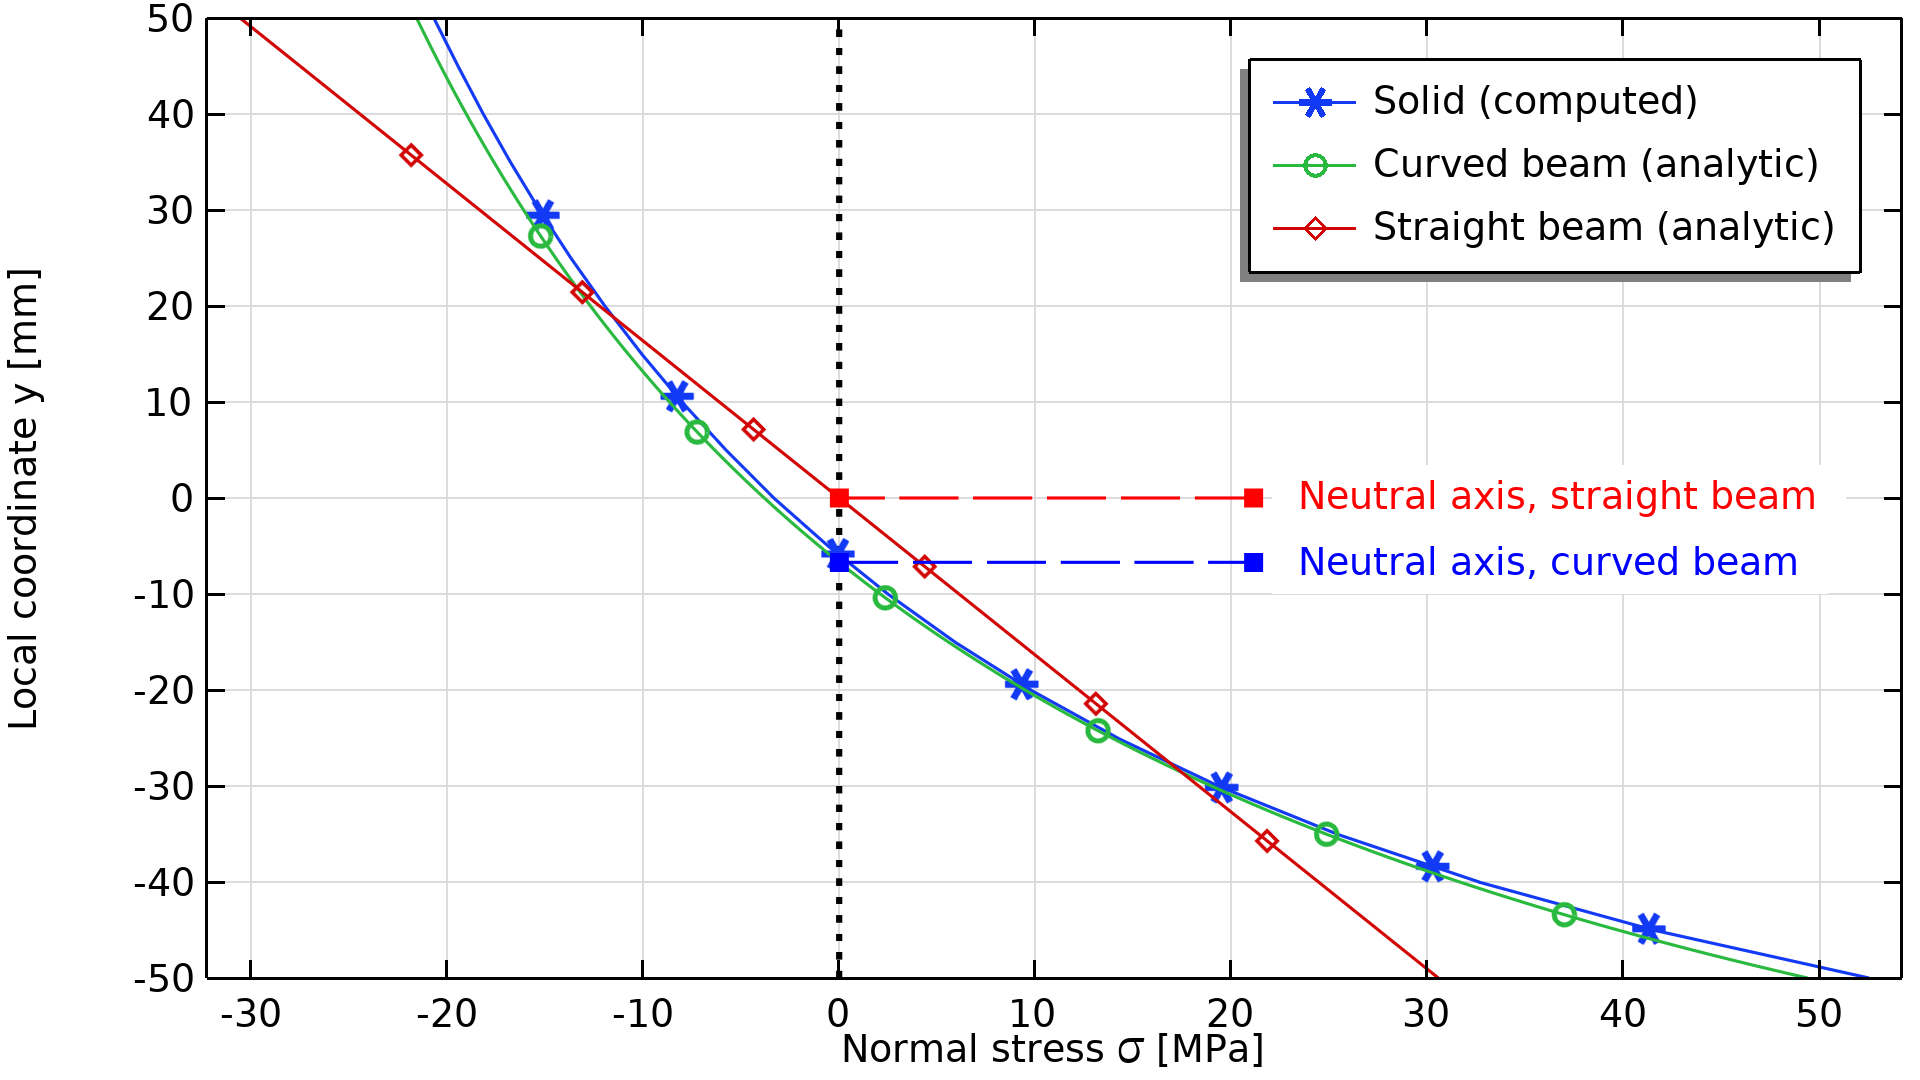
A comparison of the axial stress distribution, as computed with a full 3D solid model (blue), beam theory assuming a straight beam axis (red), and beam theory assuming a curved beam axis (green).
Even though this particular beam is by no means slender, curved beam theory matches a full 3D solid solution well. The stress comparison also emphasizes that straight beam theory predicts nonconservative results for highly curved beams. In this case, the maximum stress is underestimated by around 40 percent! However, for beams with a weak curvature, the use of straight beam theory is often still justifiable. As a rule of thumb, classical beam theory is often sufficient when the ratio of mean curvature radius to beam height is >10.
What is Different in Pipes?
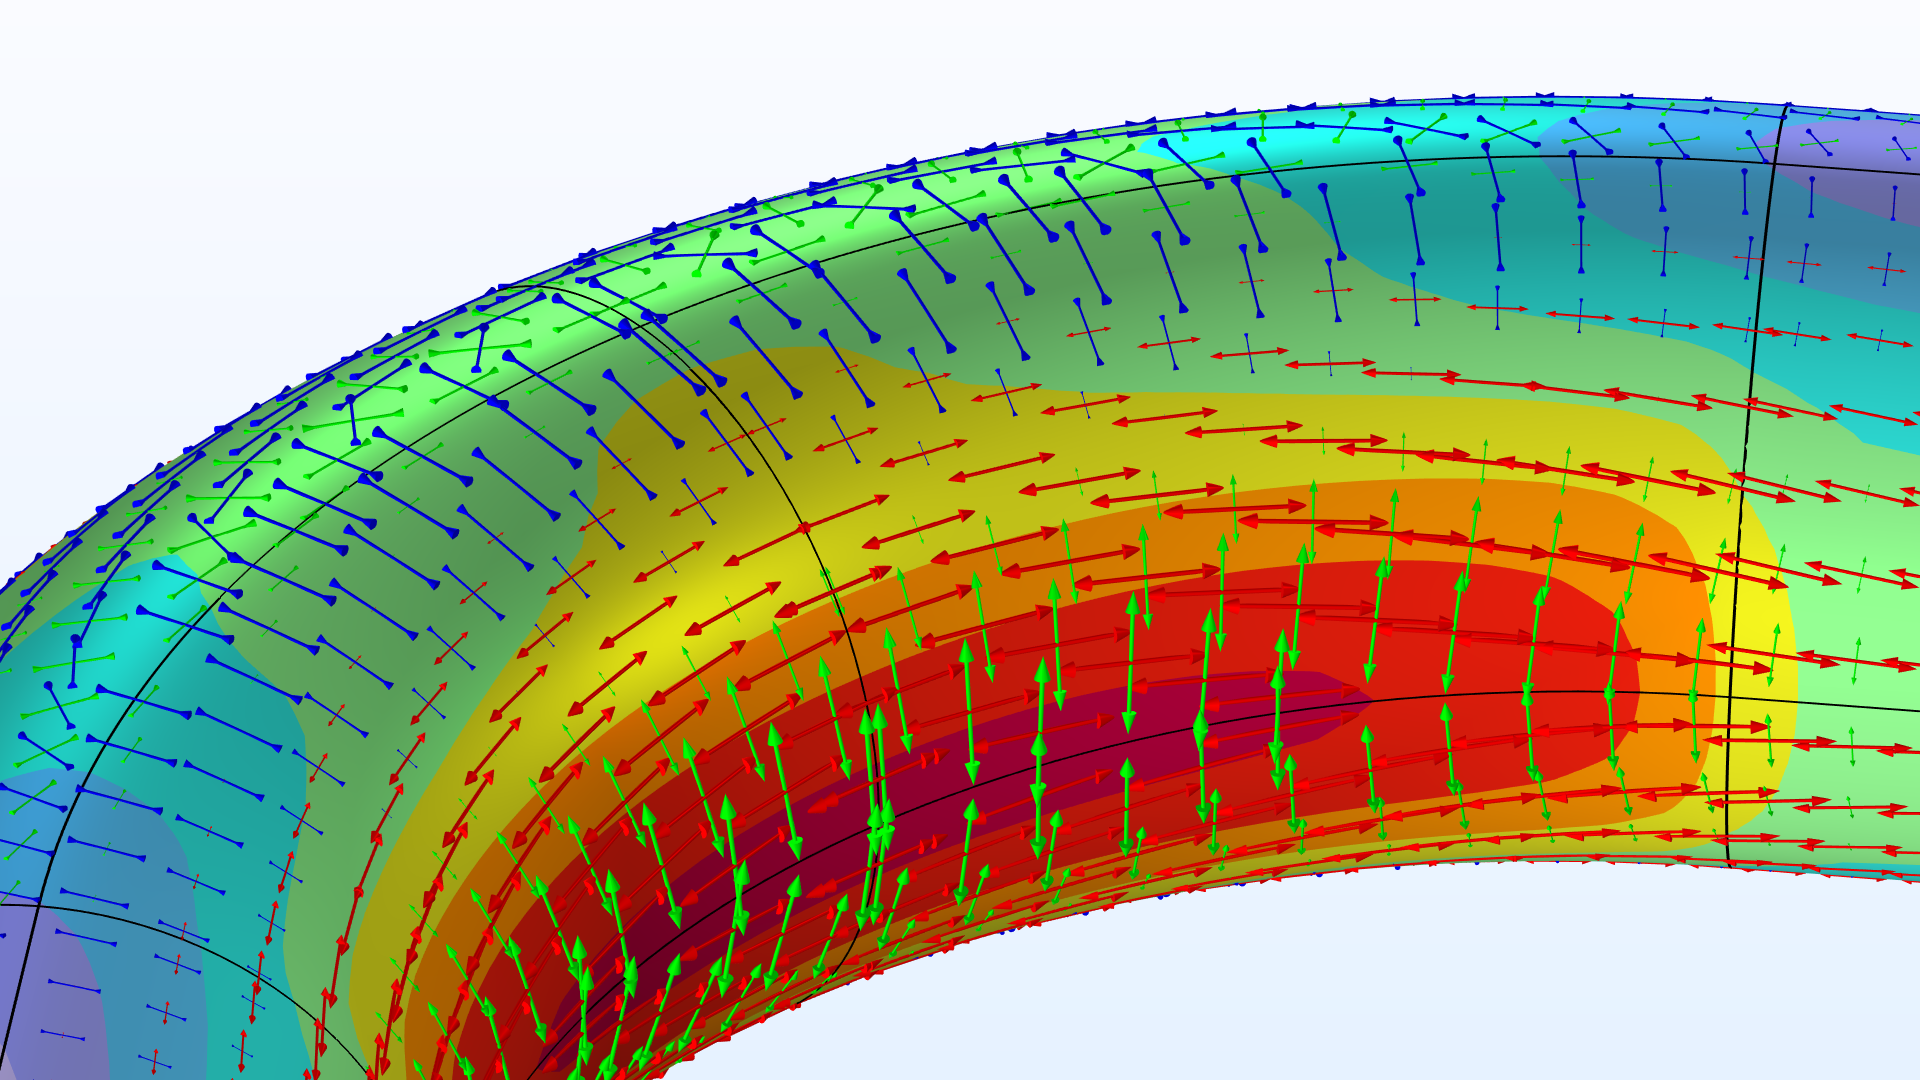
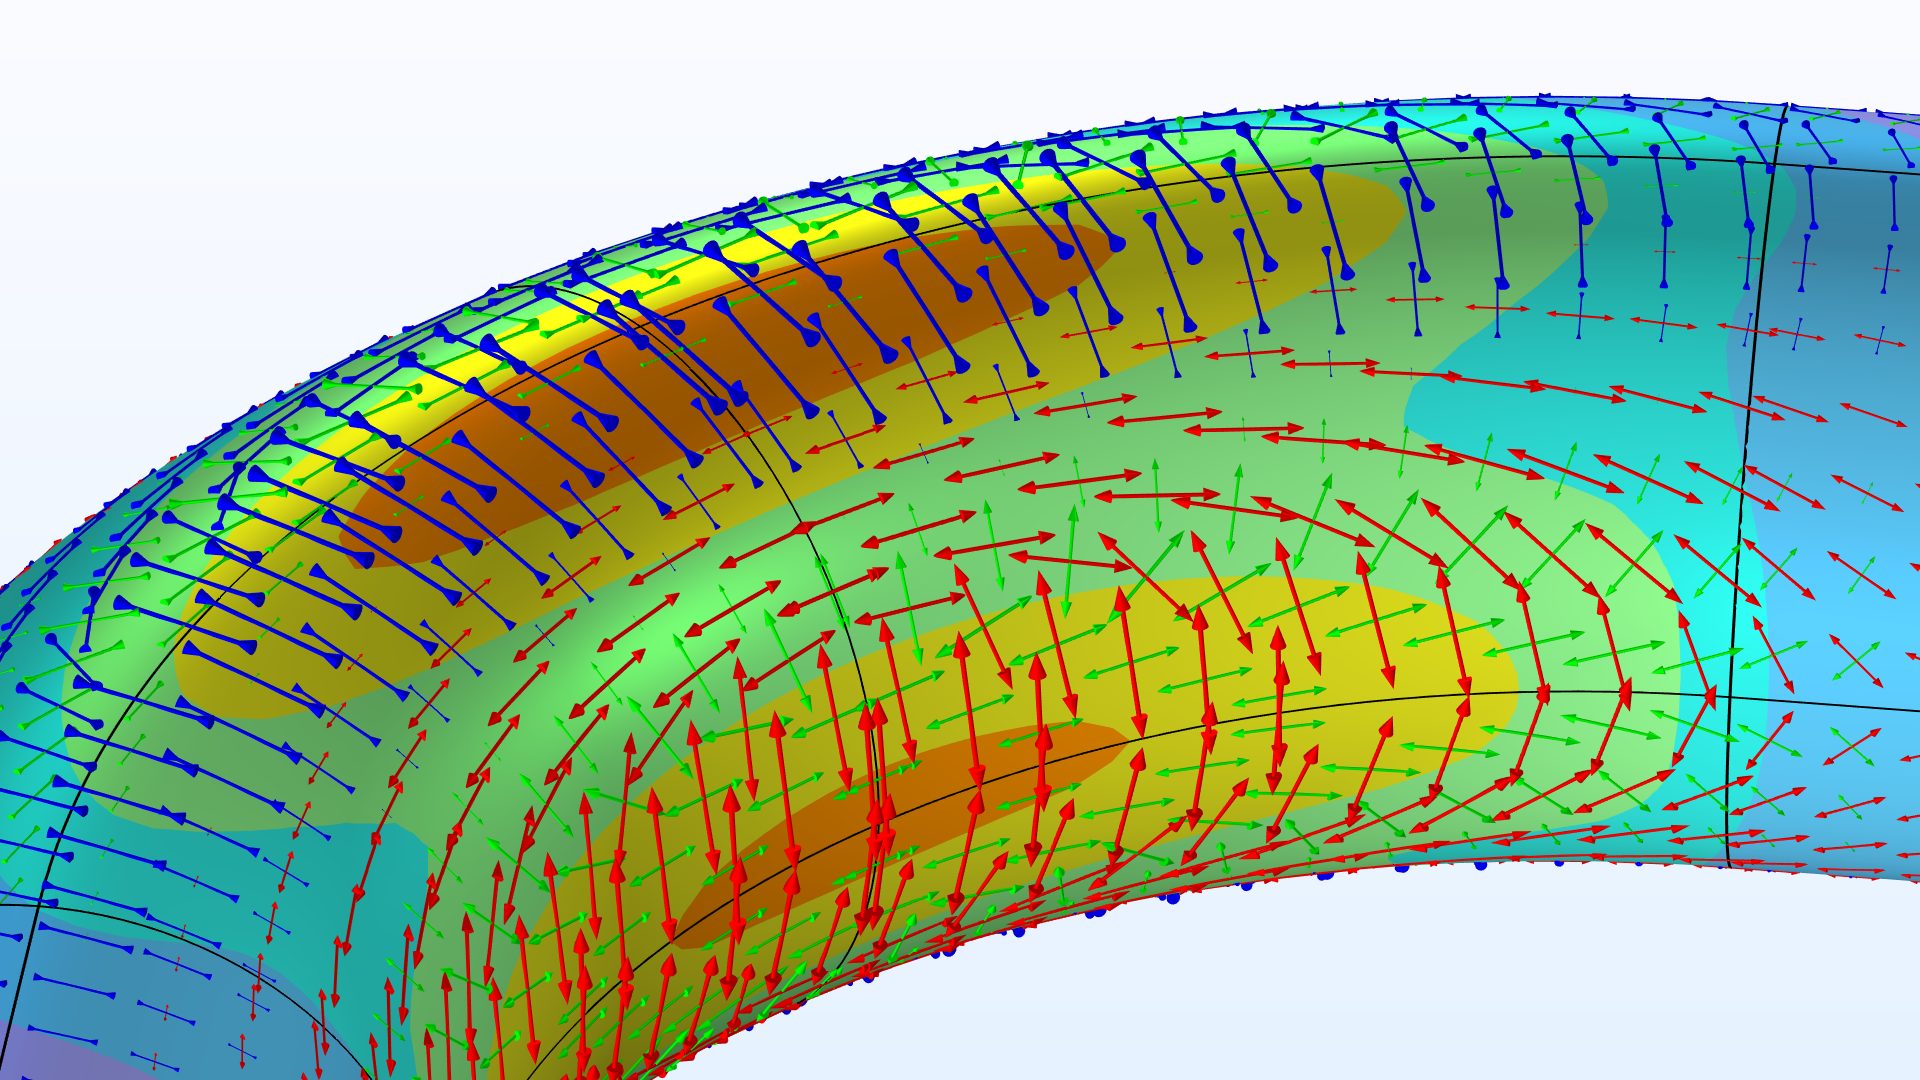
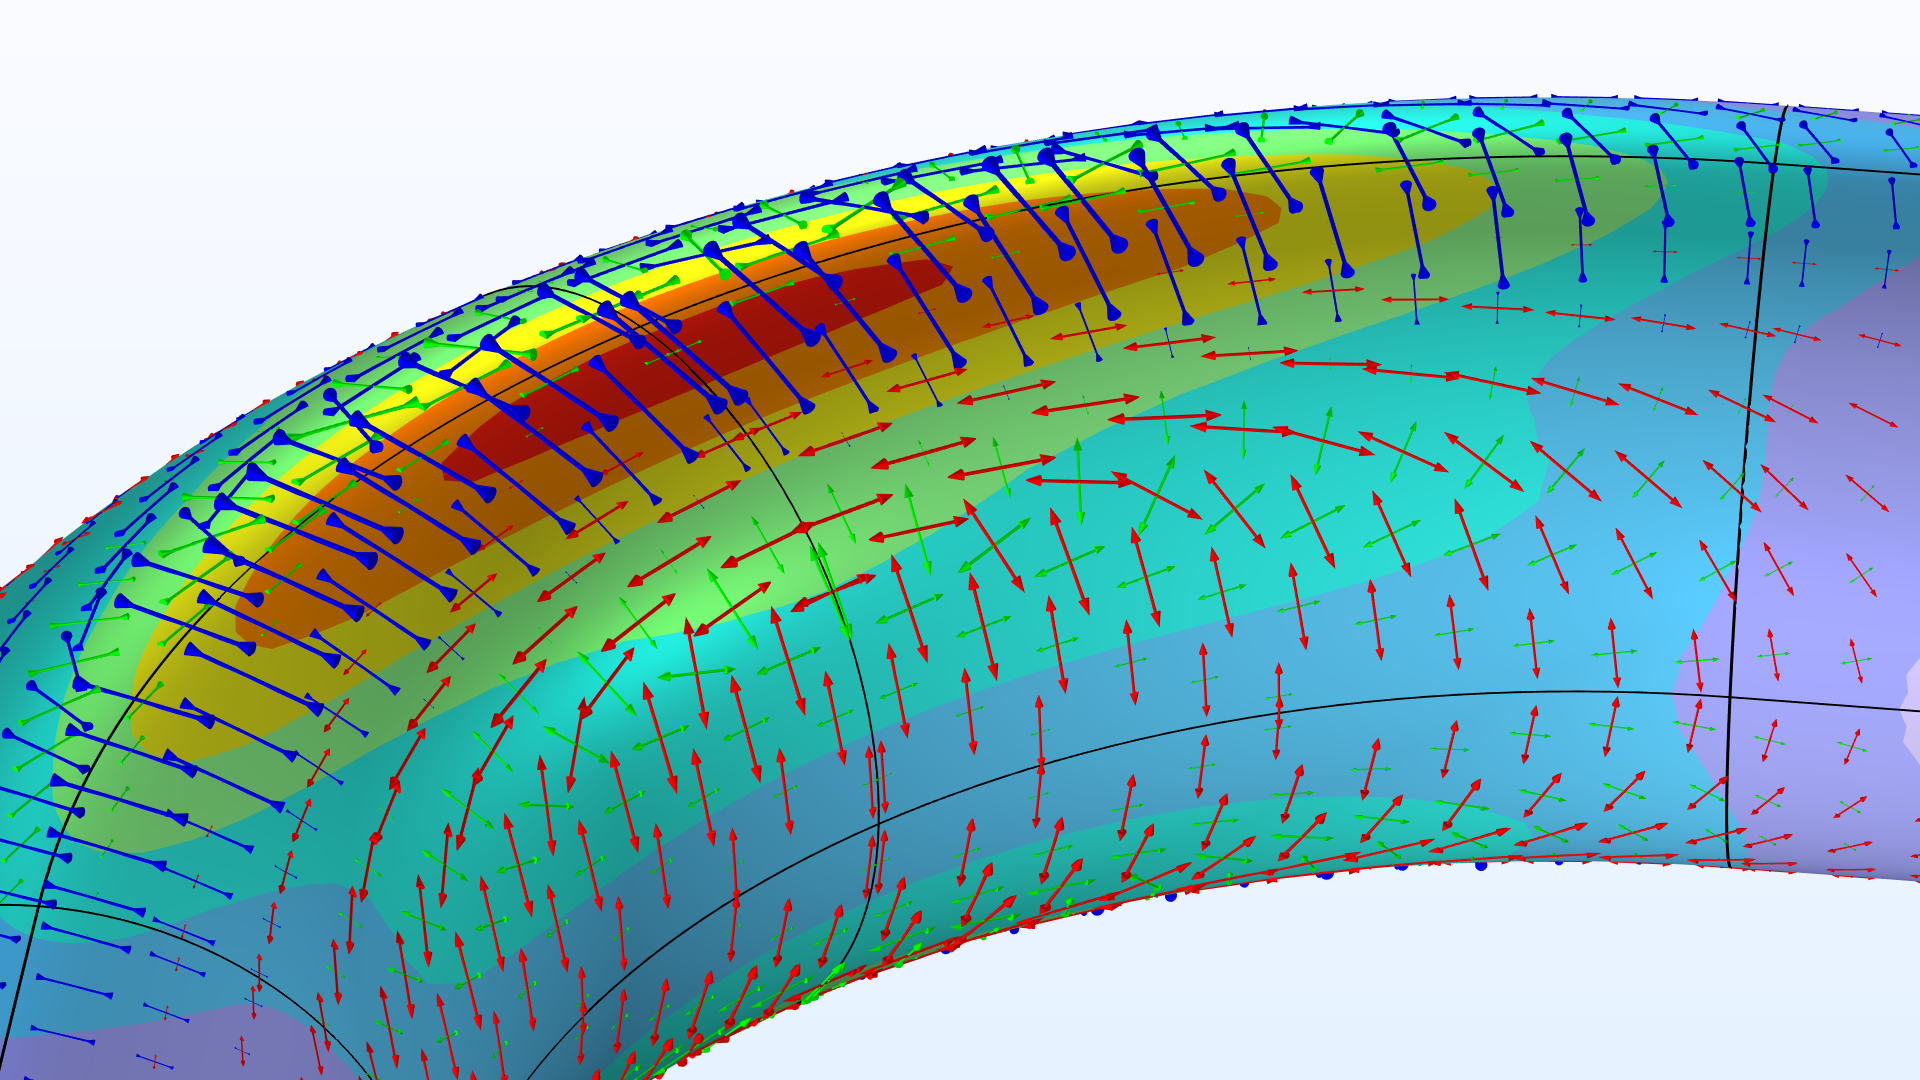
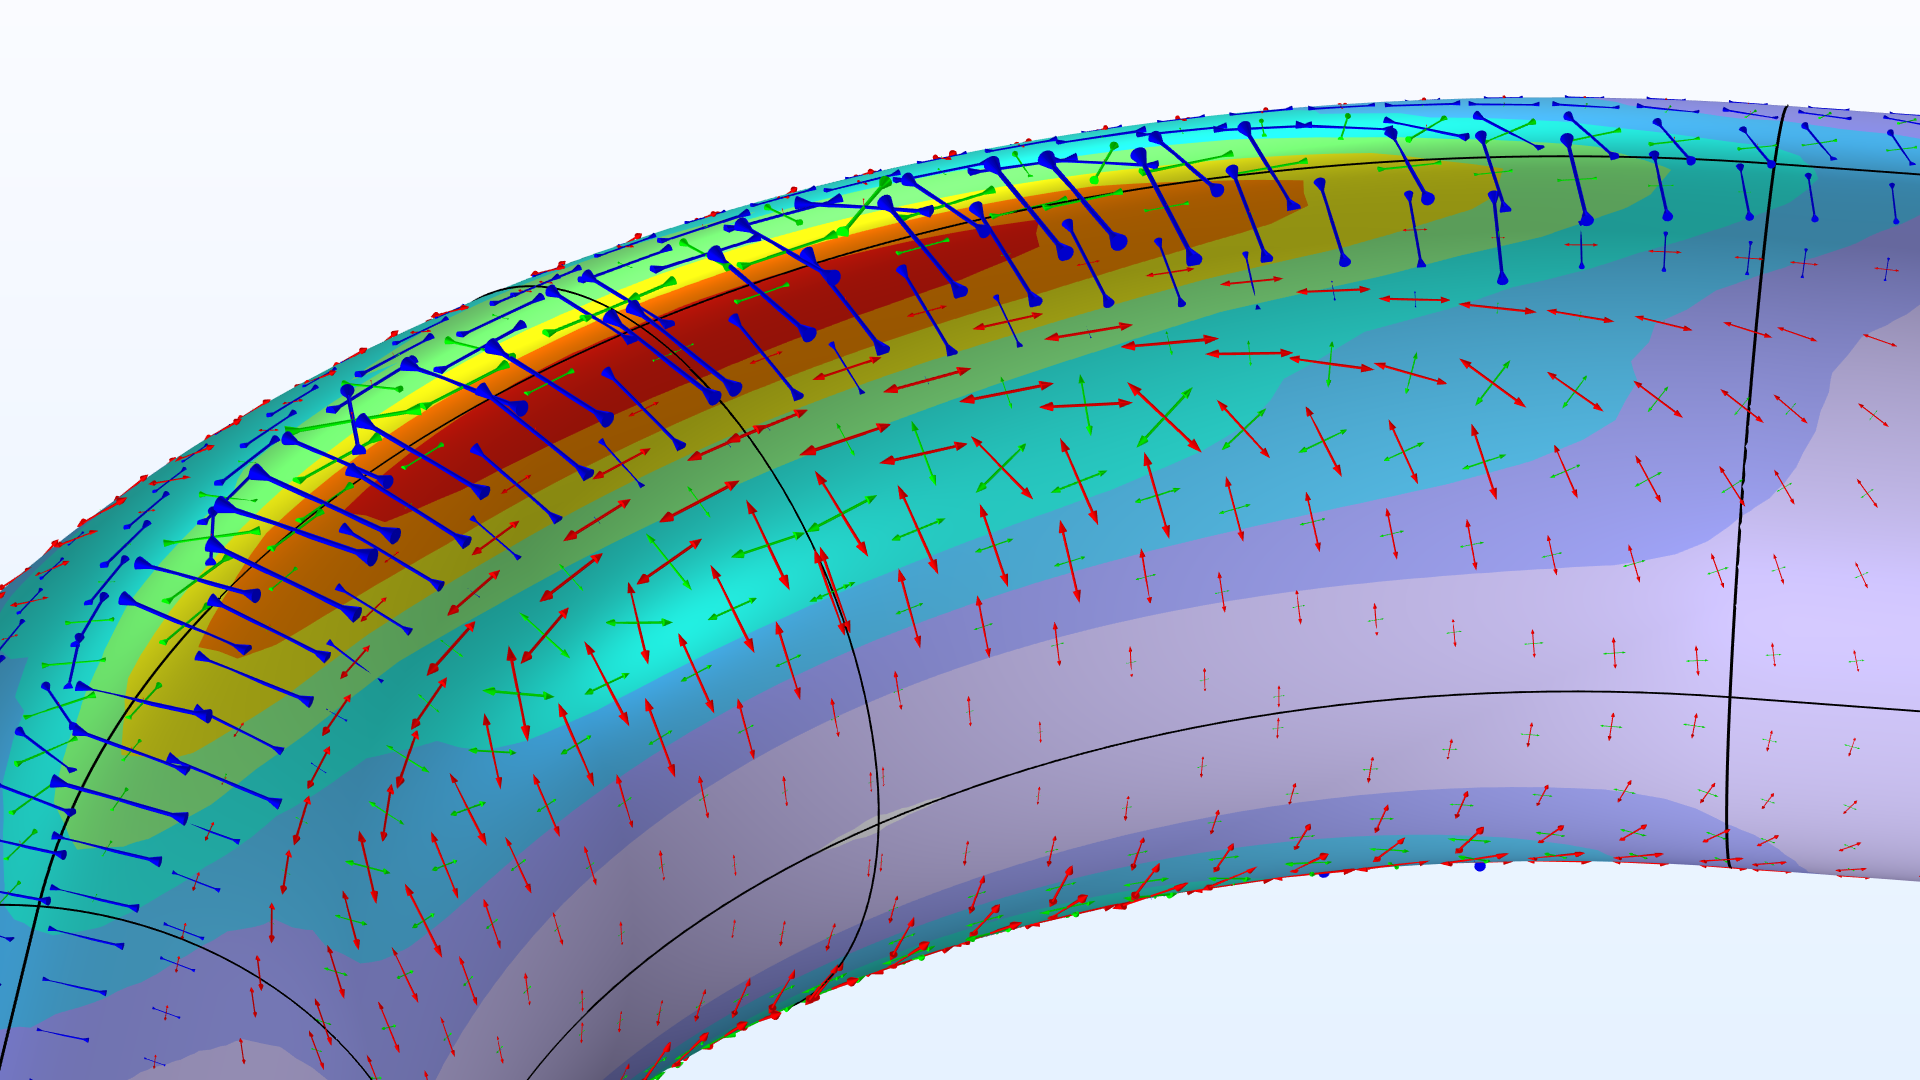
We have now seen that a curved beam with a solid, circular cross section is well described with beam theory. So, the reason why certain pipe geometries behave so differently must lie in the wall thickness. As before, the following animations show a 90° pipe bend loaded in bending. In this case, the bending moment is kept constant, while the wall thickness is reduced.
The von Mises stress distribution (normalized) and principal stresses in a curved pipe with varying wall thickness loaded in pure bending.
Detailed view of the von Mises stress distribution (normalized) and cross section deformation in the center of the bend for a varying wall thickness. The inner-bend radius is on the left side.
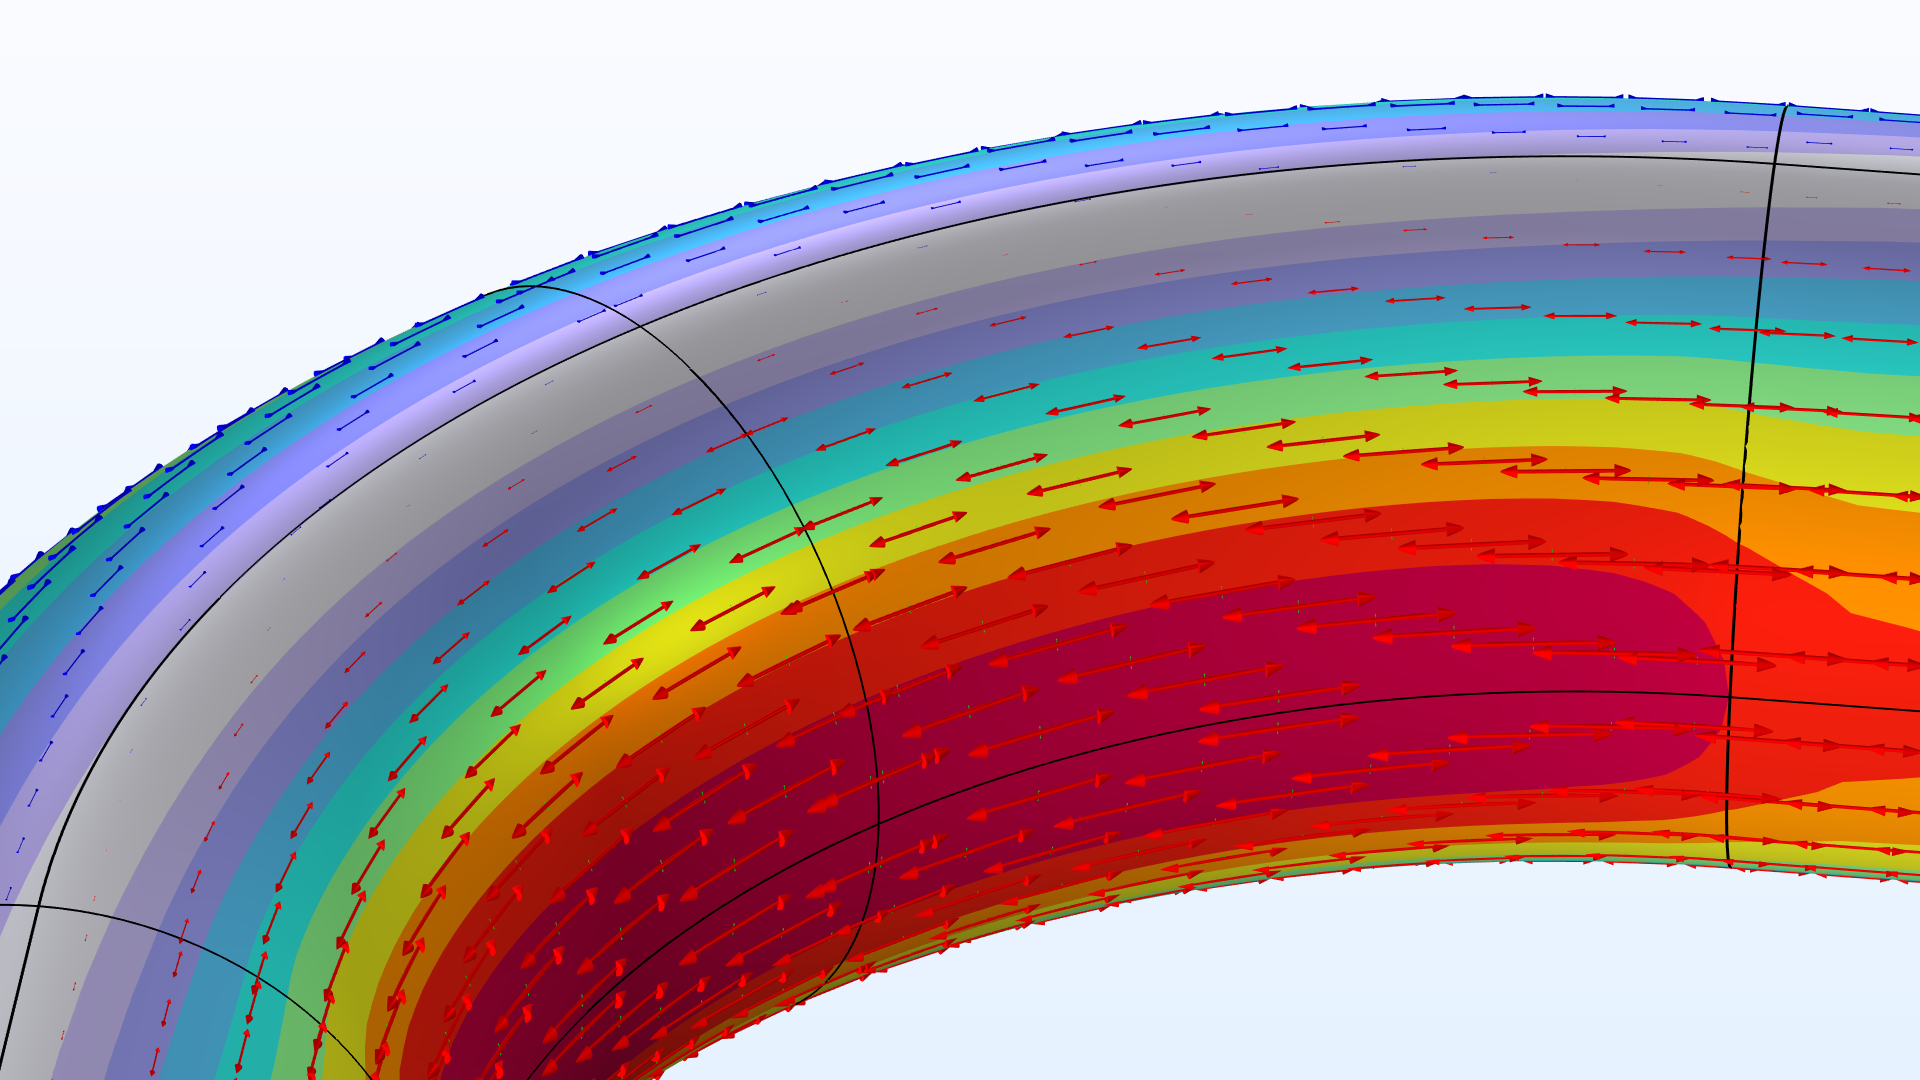
For extremely thick walls (), the pipe still behaves as expected from beam theory. In fact, the von Mises stress is practically completely determined by the stress state discussed for the solid beam, that is
, where
is the stress parallel to the beam axis. The applied moment causes tensional stresses at the inner radius and compressional stresses at the outer radius. The fact that the stresses are slightly higher in the curved section compared to the straight legs is also fully consistent with curved beam theory as seen above.
|
|
|
|---|---|
|
|
|
|
|
|
|
|
|
|
|
|
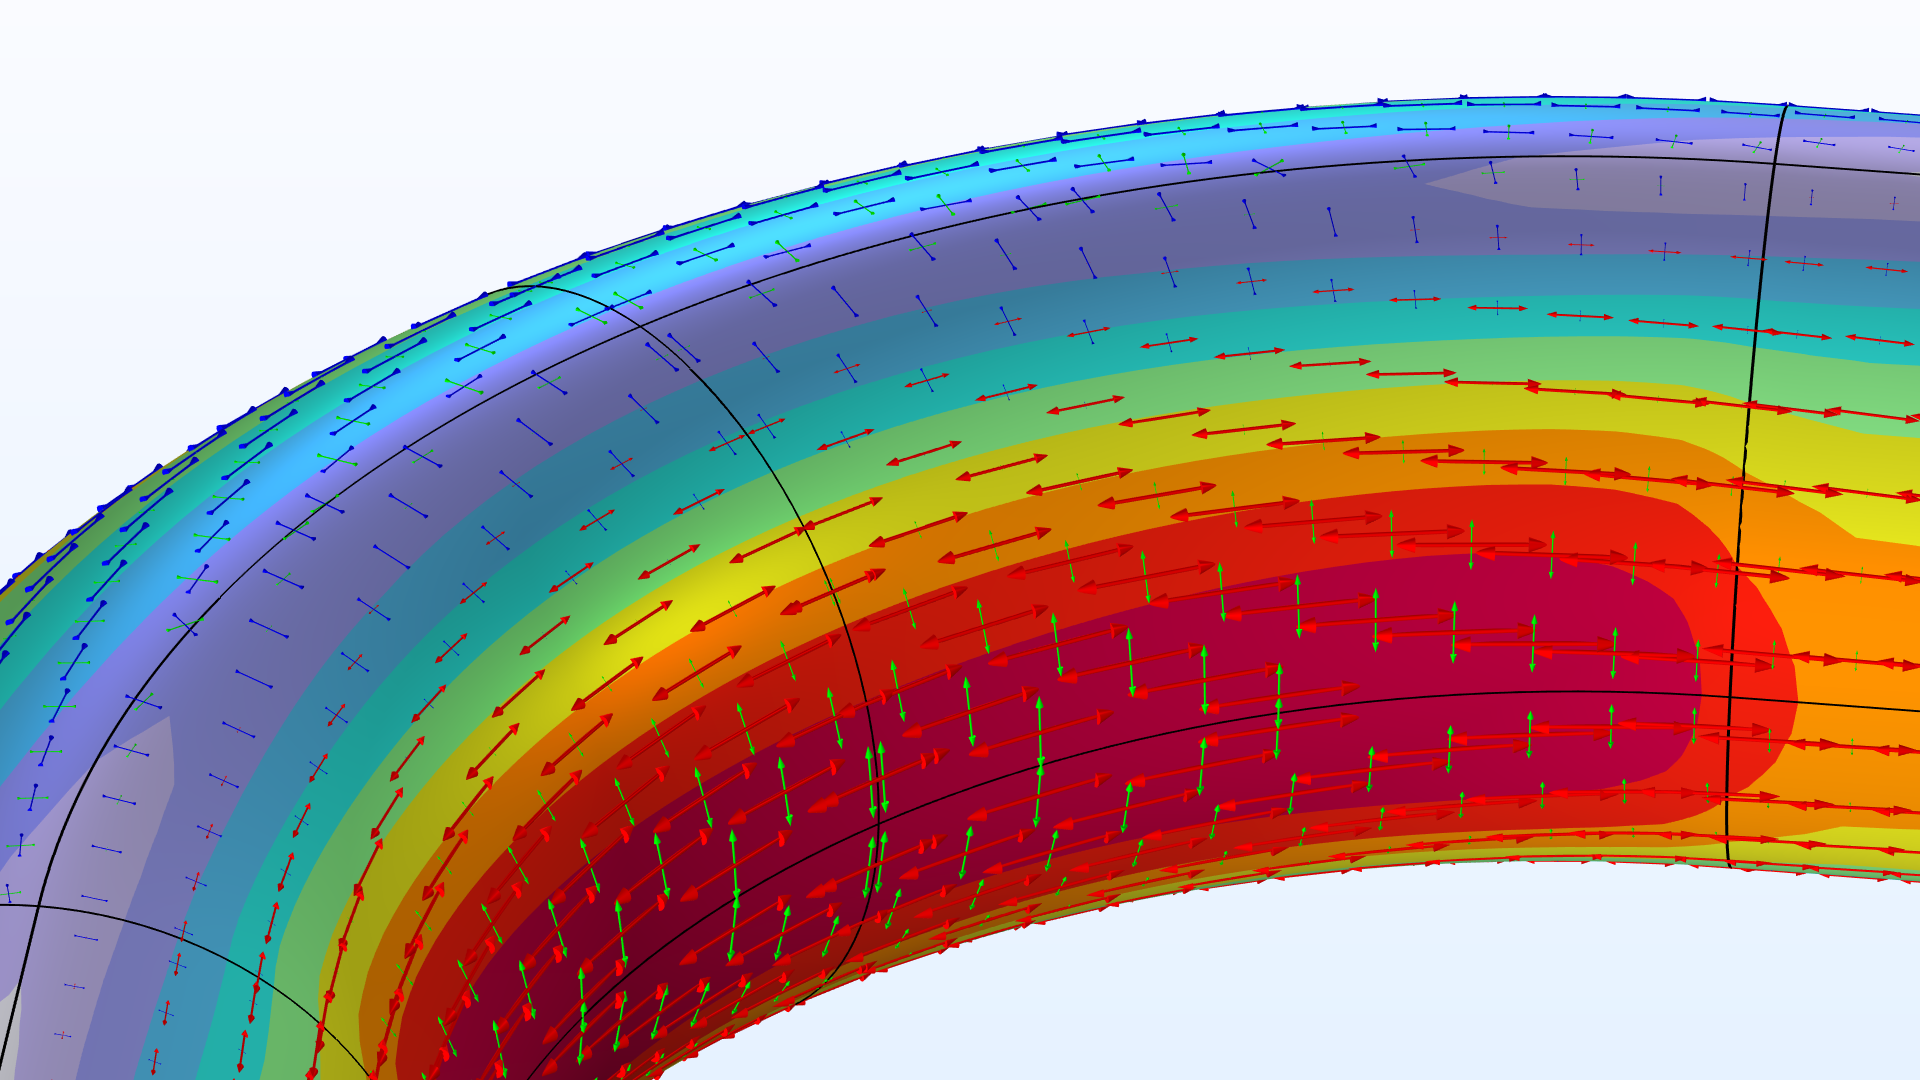
View of the pipe bend showing the von Mises stress (normalized) and principal stresses for different wall thicknesses.
At a relative thickness of (which for any real application would be considered very thick), the stress distribution starts to change quite significantly. Additional perpendicular tensional stresses superpose the beam solution at the inner- and outer-bend radii. Simultaneously, the top and bottom of the pipe show compressional stresses. These additional circumferential stresses arise due to the ovalization of the cross section. Ordinary beam theory explicitly ignores such cross-sectional deformations, and it does fall short in capturing its effect.
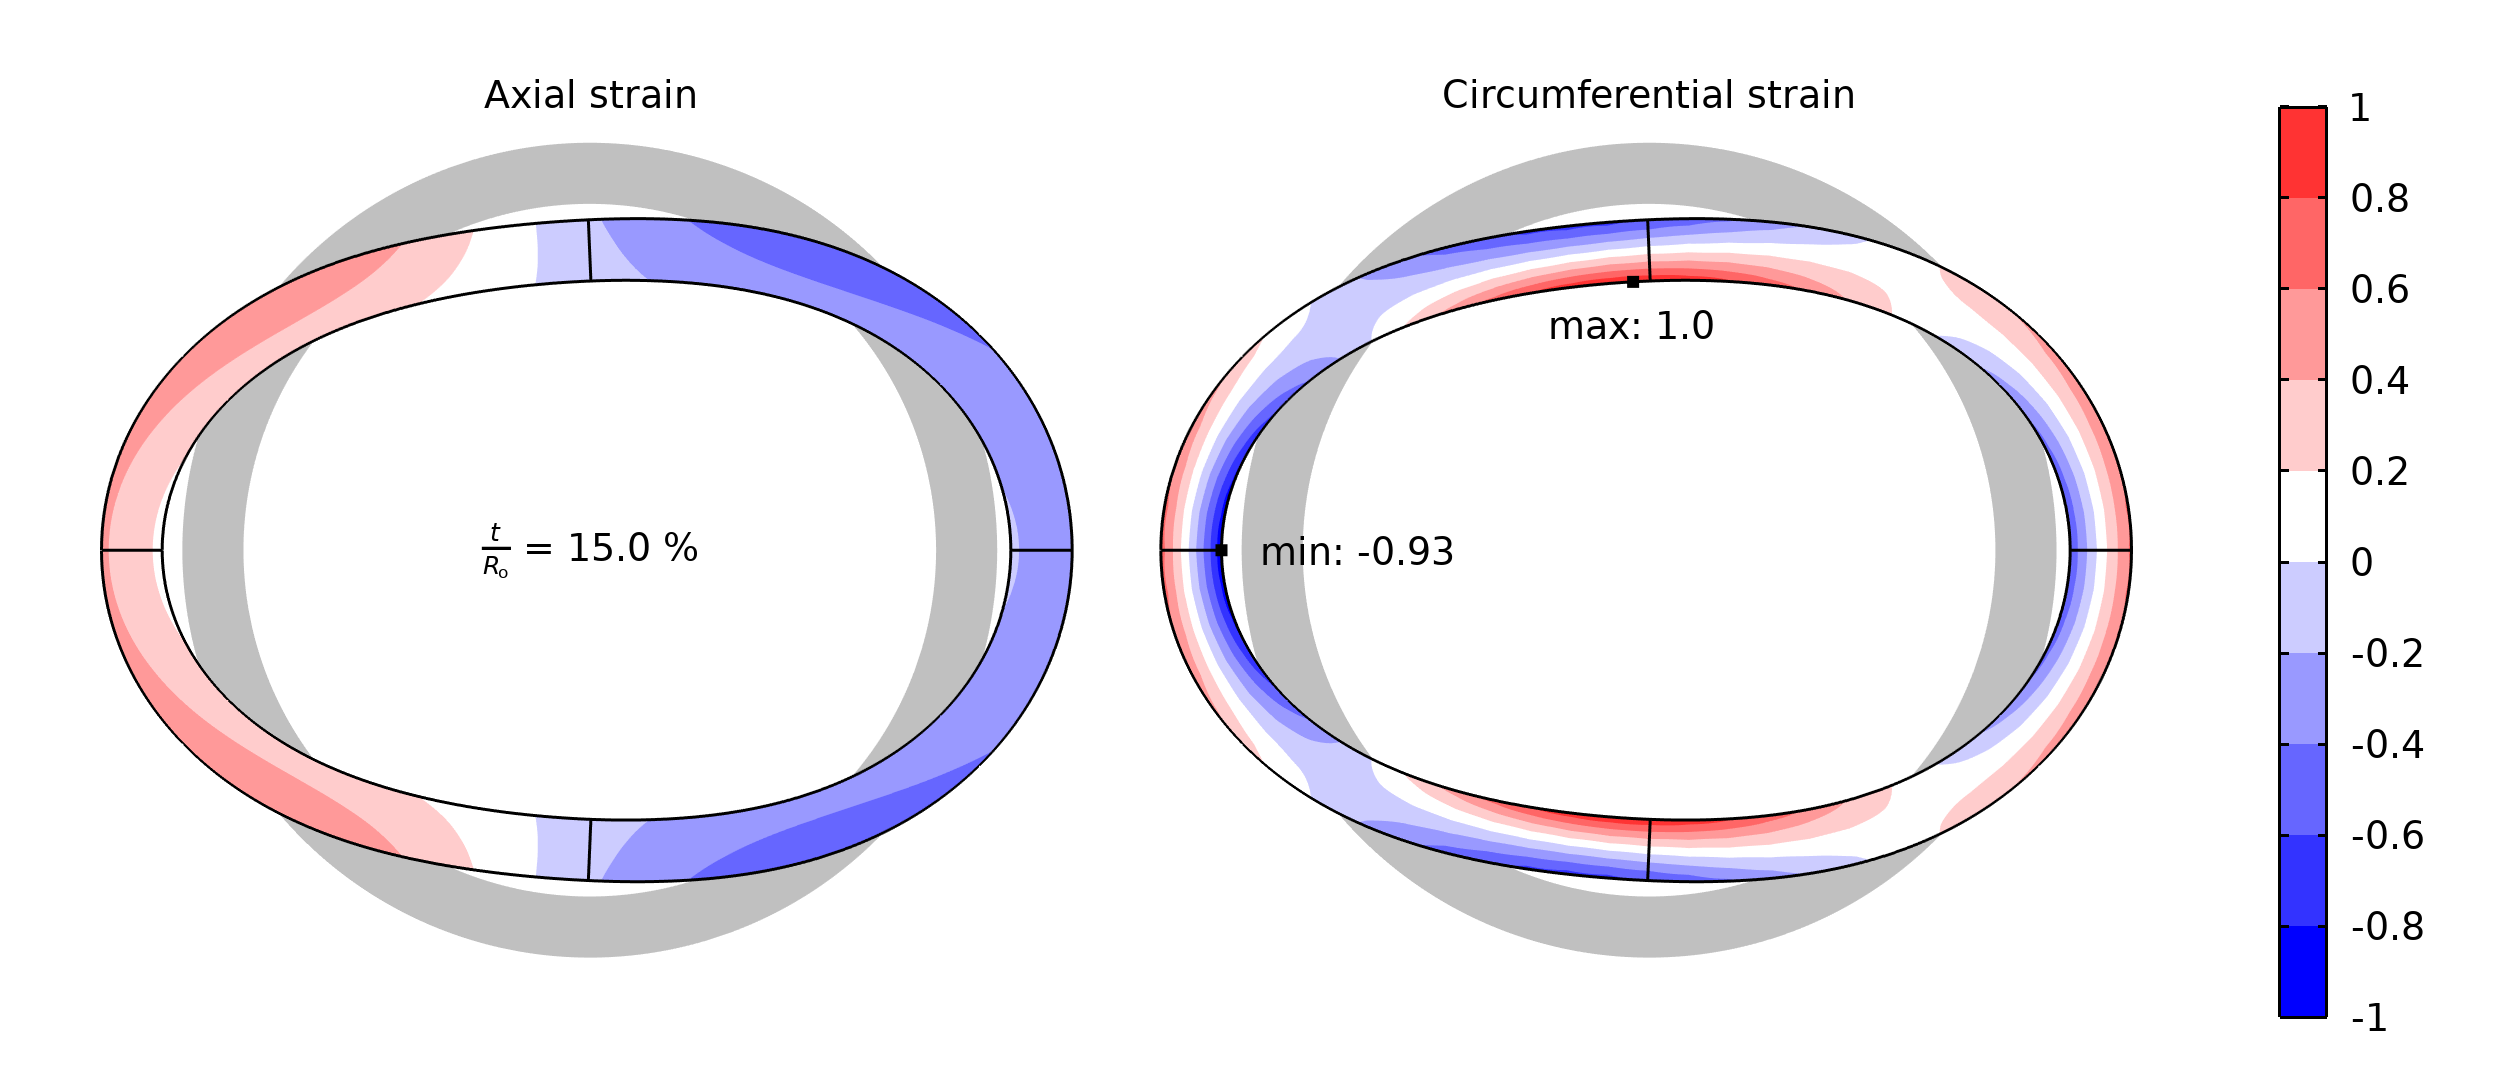
Comparison of normalized strains in axial and circumferential directions at the center of a thick-walled bend. The ovalization (highly exaggerated) causes circumferential strains that have higher peak values than the axial strains.
Smaller wall thicknesses allow for more pronounced ovalization shapes, and this deviation from the initial circular profile becomes most extreme at the top and bottom. The cross-sectional deformations may be considered as local “bending deformations”, which cause strains in the circumferential direction of the pipe wall. At the inner-wall radius, where the local deformation is compared with a smaller, initial arc length, the strains (and thus stresses) reach their highest value.
Modeling Pipes in COMSOL
The COMSOL Multiphysics® software provides various features for analyzing pipes at different fidelity levels. Let’s take a look at some examples.
The Pipe Mechanics Interface
The Pipe Mechanics interface is a special version of the Beam interface. Its enhanced functionality makes it possible to take fluid properties into account and easily set up multiphysics couplings to include fluid and thermal effects.
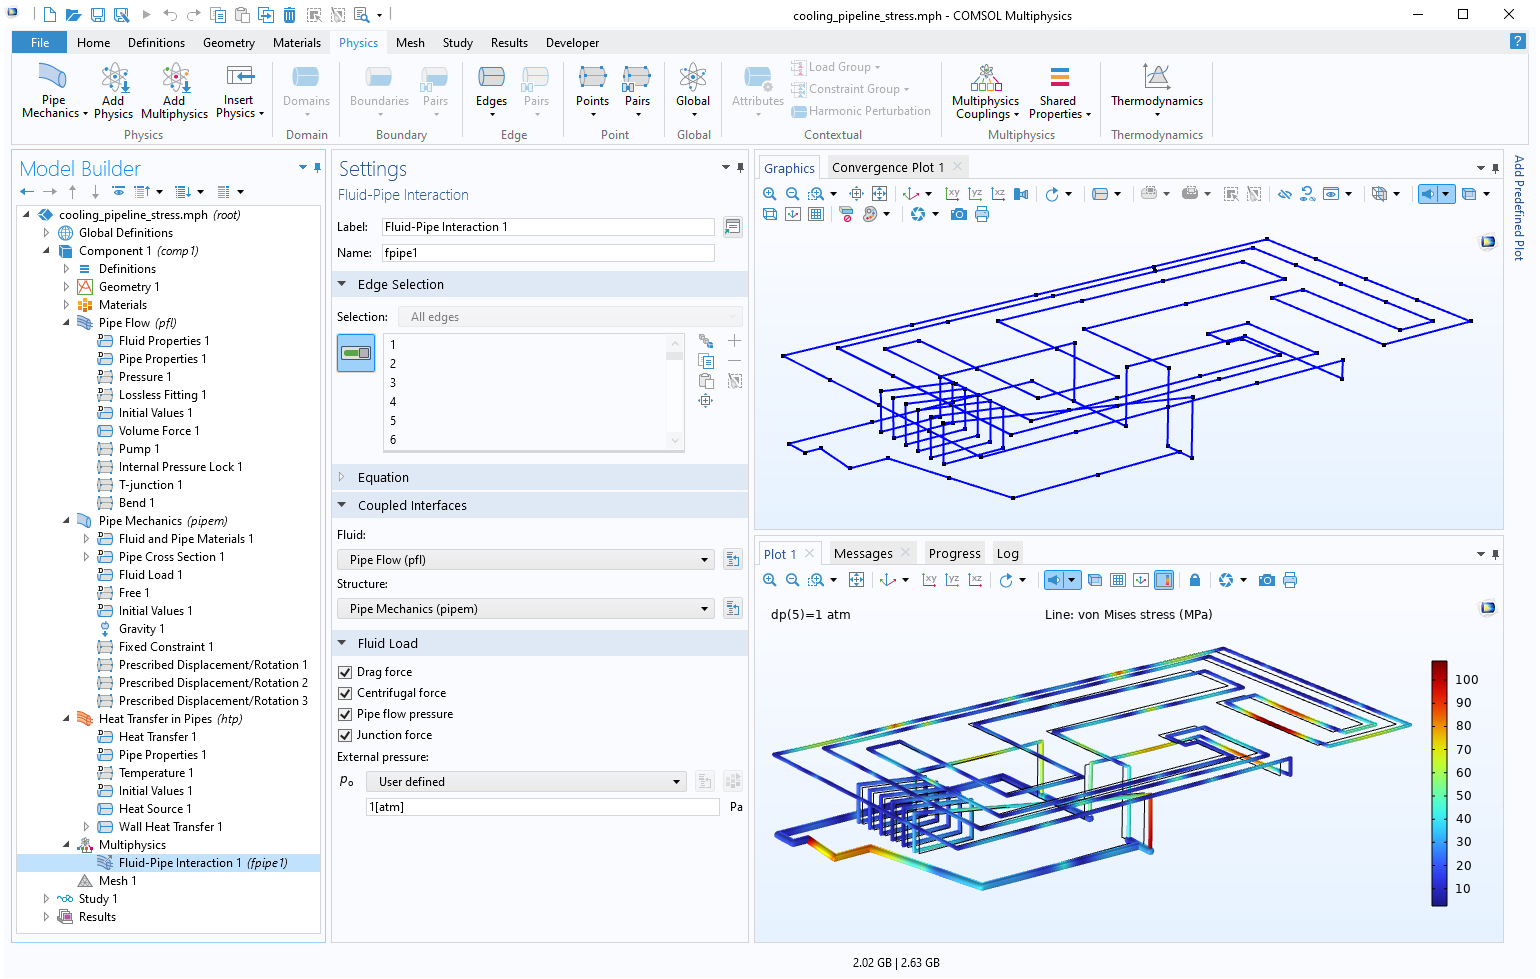
A pipe mechanics model coupling structural, fluid, and thermal effects.
The Pipe Mechanics interface also has a built-in Bend feature that corrects stiffnesses and stresses by providing k-factors and SIFs, as discussed above.
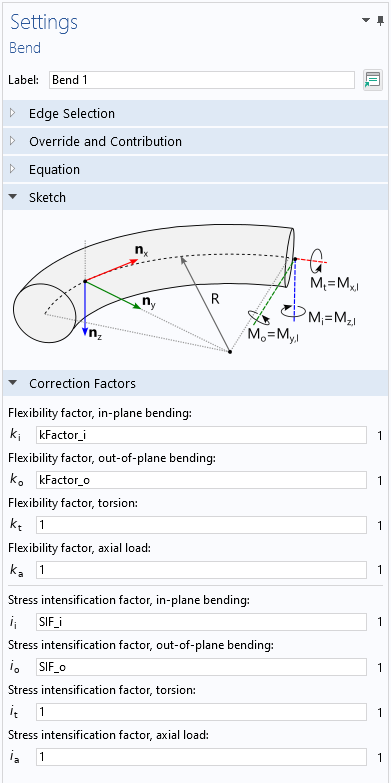
The Settings window of the Bend feature, showing the stiffness and stress correction factors.
Submodeling Parts
While large parts of piping systems are generally well approximated with beam theory, there may be components for which higher-fidelity modeling using solid or shell elements is more appropriate. For such cases, it’s important to set up a correct kinematic coupling between displacement and rotational degrees of freedom (DOFs). A consistent coupling can be easily added using the Structure-Pipe Connection multiphysics coupling.
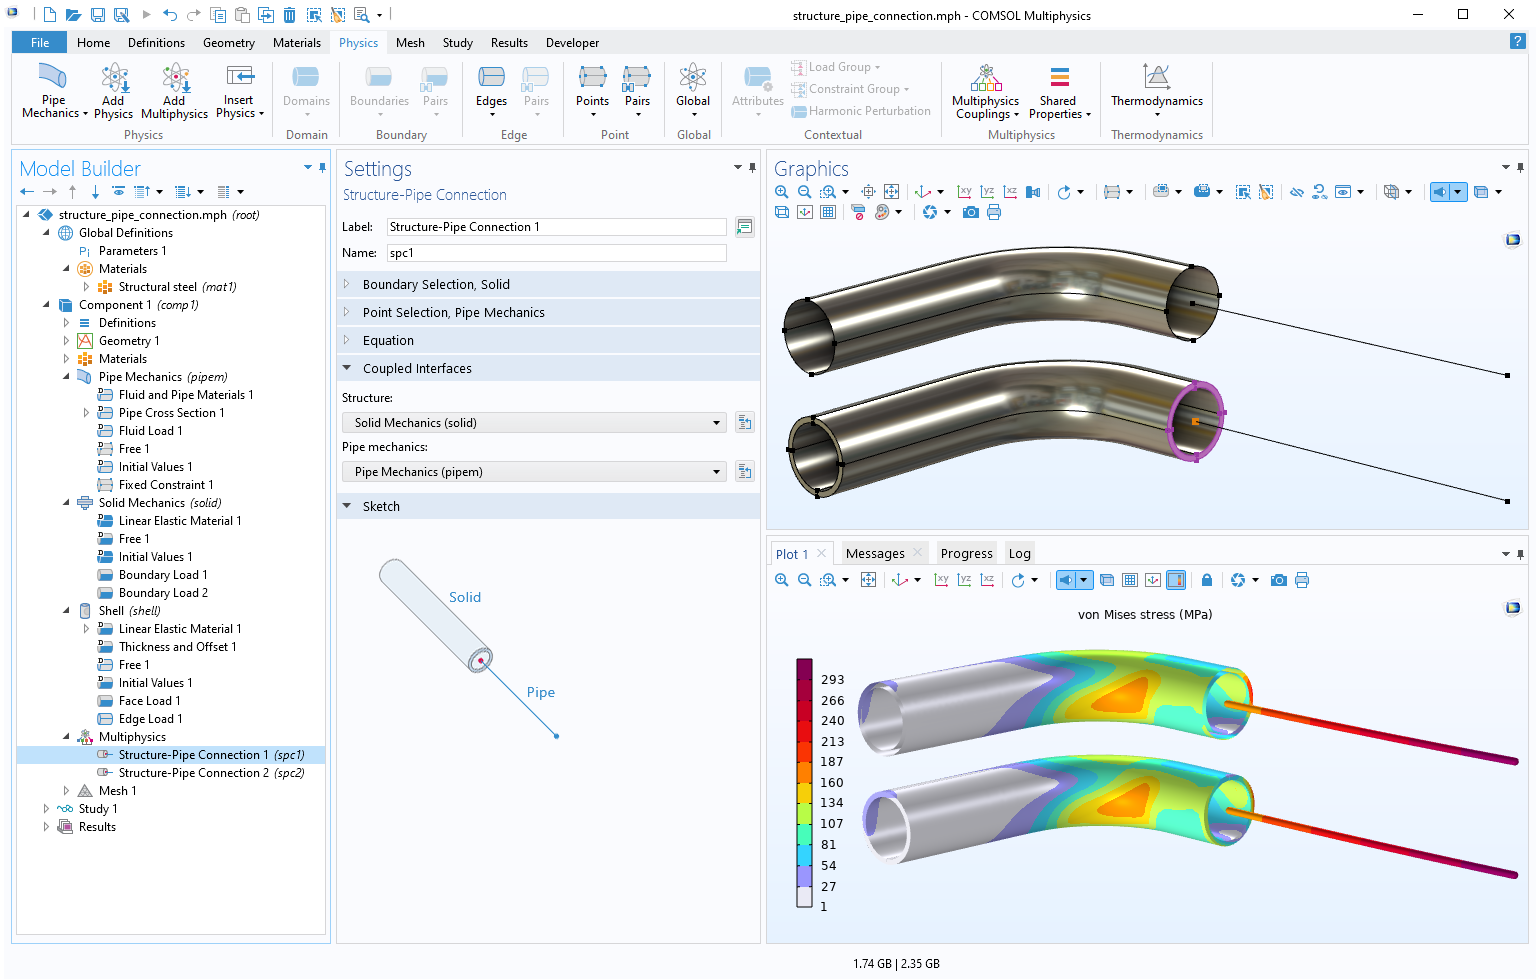
Coupling the Pipe Mechanics interface with the Solid Mechanics or Shell interface using the Structure-Pipe Connection multiphysics coupling.
Geometry Parts
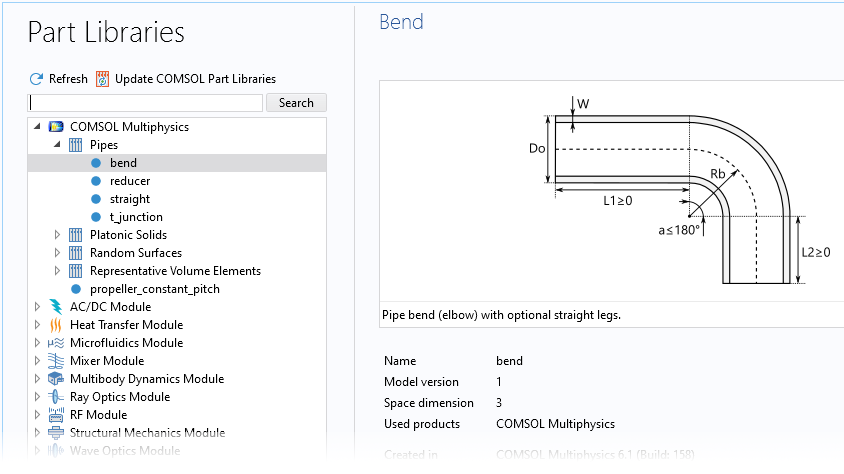
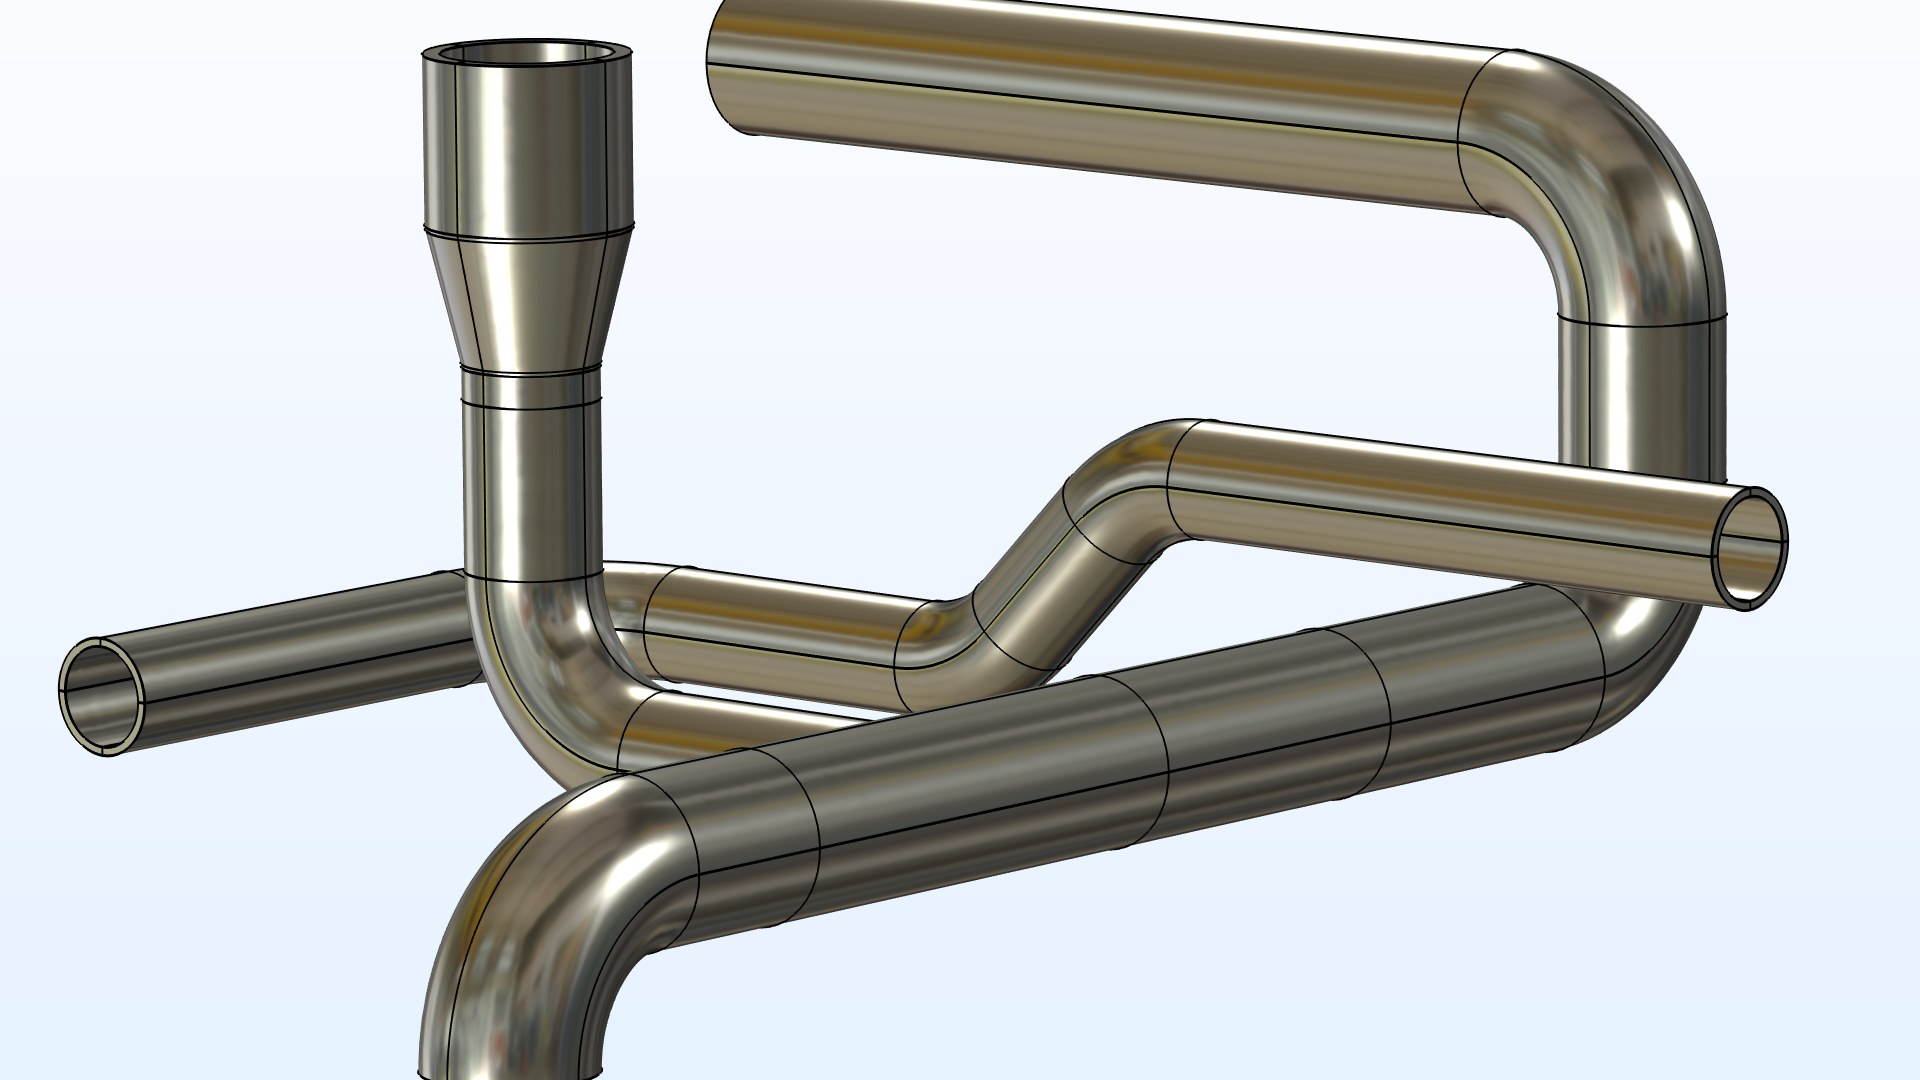
COMSOL Multiphysics also provides a number of predefined geometry parts for 3D piping analyses, for both structural and fluid analyses. These built-in, fully parameterized parts can be found in the Part Libraries. The parts are optimized to be easily meshed, and they contain helpful predefined selections and work planes to easily connect components and build complex piping systems.
The Part Libraries (left) provide many built-in geometry parts, such as fully parameterized piping parts. At right is an example of part of a piping system created from built-in geometry parts.
Further Reading
Learn more about the use of modeling and simulation for pipe design in these COMSOL blog posts:
- Designing District Heating Networks Using Topology Optimization
- Multiphysics Modeling of Stress Corrosion in Underground Pipelines
- How to Use Dispersion Curves to Analyze Fluid-Filled Pipes
- Studying Stress in Threaded Pipe Fitting Designs from CAD Assemblies
References
- E.A. Wais and E.C. Rodabaugh, “Background of SIFs and Stress Indices for Moment Loadings of Piping Components”, United States, 2005; https://www.osti.gov/biblio/841246
- “Stress Intensification Factors (i-Factors), Flexibility Factors (k-Factors), and Their Determination for Metallic Piping Components,” ASME, 2017; https://www.asme.org/codes-standards/find-codes-standards/b31j-stress-intensification-factors-flexibility-factors-determination-metallic-piping-components/2017/drm-enabled-pdf



Comments (2)
Mervin Blankenship
August 11, 2023thanks for info
Shanthakumar Pandian
April 27, 2024Great article. Thanks a lot.