
If you are using the Electric Currents physics interface in COMSOL Multiphysics® for the modeling of electromagnetic heating, you may have noticed that there are many different ways of exciting a model, especially when modeling in the frequency domain. You have options to specify current and voltage, and two different ways of specifying power as well as a circuit connection. Here, we will take a deeper look at this topic and understand how to choose between these options.
Table of Contents
- Introduction
- Terminal Power Excitation
- Fixed Current Excitation
- Why Do Losses Change with Frequency?
- Voltage Excitation
- An Important Remark About the Insulation
- Connecting to the Electric Circuit Physics Interface
- Depositing Fixed Power into the Model
- Closing Remarks
Introduction
The example that we will work with is shown below: It’s a model of a coaxial cable inserted into a metal cavity that contains a lossy dielectric with relative permittivity of 50 and electric conductivity of 30 mS/m.
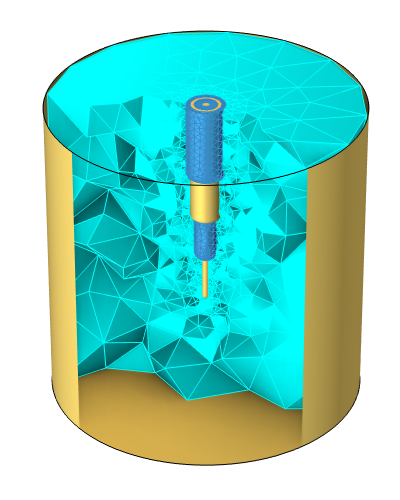
A coaxial cable inserted into a metal cavity with a sample of lossy dielectric material inside.
We have developed this model in depth in a previous article, where we described how this model can be solved using several different modeling approaches, all of which give nearly identical results in the low-frequency regime, but can start to diverge at higher frequencies. Building on those observations, what we will do here is run the model in the frequency range from 1–100 MHz, and compare the Electric Currents physics interface with the Electromagnetic Wave physics interface. As we saw earlier, we should expect very good agreement over this range. In both interfaces we will solve for the fields inside of the lossy dielectric as well as the insulator, and assume that the skin depth is sufficiently small inside of the metal coax conductors so that these can be modeled via boundary conditions.
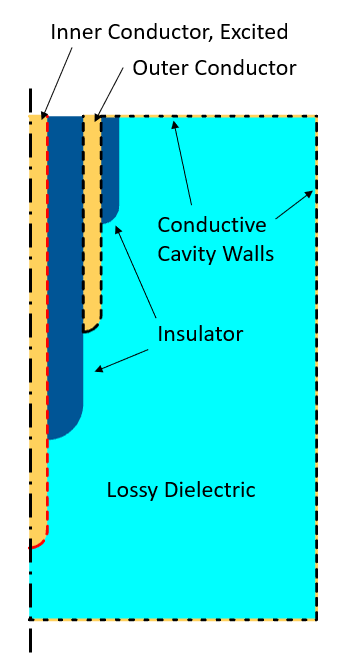
Schematic of the model.
The figure above highlights the boundary conditions. The excited inner conductor is shown with a dashed red line, all of the boundaries of this conductor are electrically connected. The outer conductor and the conductive cavity walls as well as the boundary of the of the insulator between them, are also electrically connected. The objective here is to further justify that the Electric Currents physics interface can be used for this type of modeling. To use this interface correctly, though, we do need to spend some time understanding the various excitation options.
Terminal Power Excitation
We start with exciting the model with the Terminal boundary condition, of type Terminated, which enables us to specify a power and a characteristic impedance. This boundary condition mimics a connection to a power supply via an infinite lossless transmission line of known characteristic impedance, such as a 50 ohm coaxial cable. The power supply at infinity supplies a sinusoidal signal, with constant cycle-averaged power. This signal propagates along the lossless transmission line and into the Electric Currents model, where it’s partially reflected back into the transmission line and partially dissipated within the model. The reflected component propagates back along the infinite lossless transmission line and does not interact with the power supply. The specified power must always be greater than or equal to zero, and this power will be dissipated within the model, reflected back into the terminated terminal, or transmitted into another boundary condition.
The Terminal condition has to be used in conjunction with another condition that fixes the electric potential somewhere else in the model, and typically a Ground boundary condition is used. We’ve already addressed the concept of ground, and it bears repeating that any set of electrically connected boundaries can be defined as a ground boundary condition. In this model, we will choose to define ground as the outer conductor and the cavity walls as well as the boundary between the two. That is, the outer conductor and the cavity walls are electrically connected and all held at an electric potential of zero.
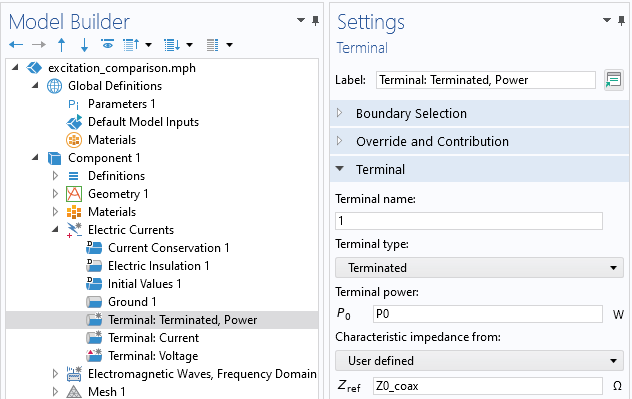
Screenshot of the Electric Currents Terminal condition, of type Terminated. Enter the impedance of the transmission line and supplied power.
Consider the signal coming from the power supply along the transmission line: part of the signal will be reflected back toward the power supply, which contains an isolator or circulator to protect the device. Ideally, this reflection is minimal, that way we can deposit as much power as possible into the material being heated. The magnitude of this reflection is quantified by the S-parameter, which is computed automatically via this boundary condition.
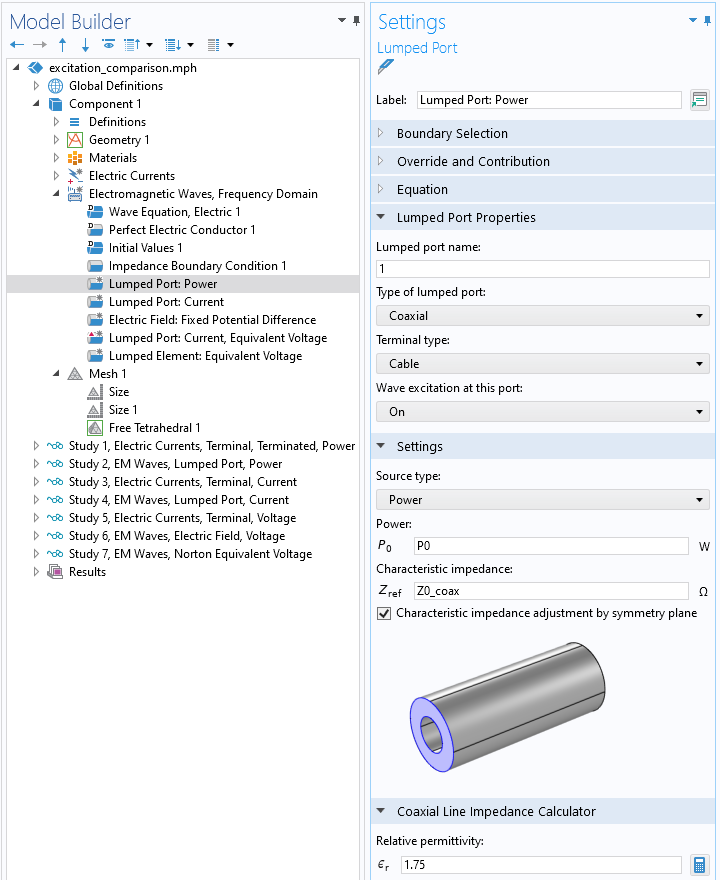
Screenshot of the Electromagnetic Waves, Lumped Port, of type Coaxial with source type Power. The cable impedance is an input, though it can also be computed from the geometry.
We compare this with the equivalent boundary conditions in the Electromagnetic Waves formulation. Here, we think in terms of sets of boundaries of electrically connected domains. In our frequency-domain model, there are two sets of such boundaries: the outer conductor, which is electrically connected to the cavity walls, and the inner conductor as shown in the schematic above. These are electrically separated across the annular gap of the inside of the coaxial cable, and it’s at this annular boundary that we apply the Lumped Port, of type Coaxial, and again specify a power and cable impedance. The physical interpretation is the same as before, and this boundary condition will also compute the S-parameter.
Comparison of computed losses when using Electric Currents and Electromagnetic Waves with power excitation.
We can compare the two approaches in terms of the heat deposited within the lossy material in the figure above. This shows excellent agreement over most of the frequency range. They do start to diverge at higher frequencies, and this is because the Electromagnetic Waves physics interface additionally considers inductive effects, not just the resistive and capacitive effects considered by the Electric Currents interface.
It’s important to understand the physical interpretation of the Terminal condition of type Power in the Electric Currents interface as well as the Lumped Port condition in the Electromagnetic Waves interface. These are meant to model a connection to an infinite lossless transmission line, with a power source at infinity that sends a propagating wave — a signal — down the line. That signal is partially dissipated within the model as heat, and partially reflected back into the infinite line, where it continues without ever interfering with the power source. In reality, of course, the reflected signal would interfere, and high-frequency systems can have significant reflections whenever there is an impedance mismatch, so sources will have isolators or circulators to prevent signal reflections from damaging the power supply. At lower frequencies, where the characteristic wavelength is much longer than the entire system size, we can no longer think of excitations in terms of waves, and we turn to other excitation conditions.
Fixed Current Excitation
We turn to exciting the Electric Currents model with Terminal of type Current for modeling a source that applies a known current. Although, physically, there is still a transmission line connecting the source to the model, we no longer consider any signal being reflected back toward the source. Note that entering a negative or complex-valued number for the current is reasonable in a frequency-domain model. A complex-valued number, or a negative number, simply means an excitation with a phase shift, as described here. This current will flow through the model, and then through the Ground boundary condition or any other boundary condition that fixes the electric potential.
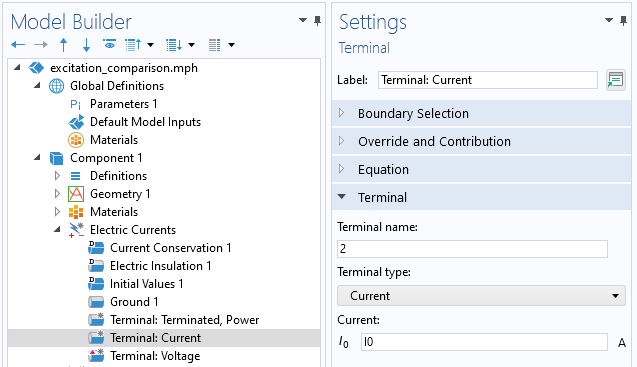
Screenshot of the Electric Currents Terminal condition, of type Current.
The equivalent condition within the Electromagnetic Waves interface is the Lumped Port of type Current, as shown in the screenshot below.
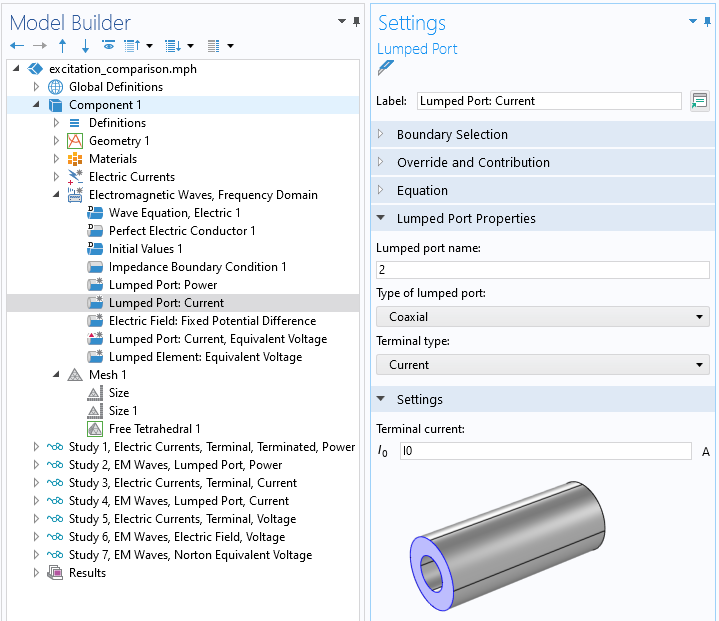
Screenshot of the Electromagnetic Waves, Lumped Port, of type Coaxial with Current excitation.
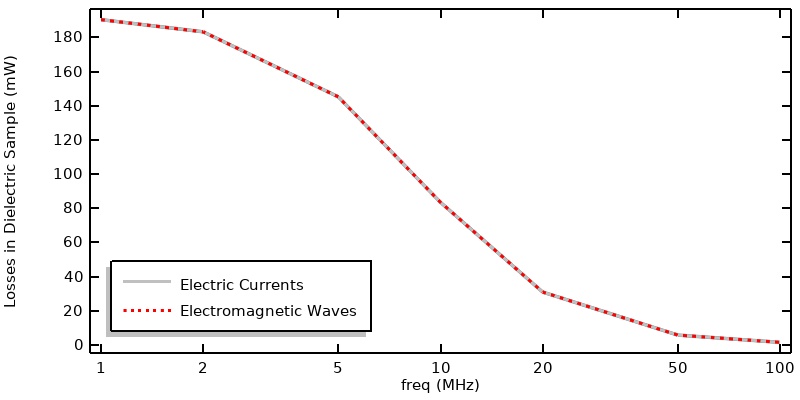
Comparison of results when exciting via a current.
The comparison of the two approaches is shown in the plot above, and excellent agreement is observed. What is noticeably different from the previous approach using power excitation is that the losses change much more dramatically as a function of frequency. This merits additional attention.
Why Do Losses Change with Frequency?
For a current-driven problem, with peak current I_0, we can compute the cycle-averaged loss within the entire model from the equation
where Z_s is the impedance of the system, as seen from the point of view of the terminal. Impedance is one of the automatically computed outputs of the Terminal, Current type and the Electromagnetic Waves, Lumped Port boundary condition. The table below presents the values over the frequency range:
| Frequency (MHz) |
Electric Currents Impedance (Ohms) |
Electromagnetic Waves Impedance (Ohms) |
|---|---|---|
| 1 | 3807.2-436.4i | 3807.0-436.3i |
| 2 | 3664.6-840.0i | 3664.3-839.8i |
| 5 | 2903.6-1663.2i | 2903.5-1662.9i |
| 10 | 1668.4-1909.9i | 1668.4-1909.4i |
| 20 | 618.13-1414.1i | 618.19-1413.3i |
| 50 | 114.38-653.8i | 114.48-652.2i |
| 100 | 29.249-334.4i | 29.367-331.1i |
Table of impedance as a function of frequency from both formulations.
You can observe from this data that the real part of the impedance drops with frequency, while the imaginary part becomes more negative. That is, the part becomes less lossy, and more capacitive, at higher frequencies.
We should look for a simple explanation to explain this trend, so let’s ignore all of the geometric complexity and think of this model purely in terms of a single material sitting between two electrodes. We can think of this case, at the most simplistic level, as being a parallel RC circuit, with the resistance being due to the material conductivity and the capacitance due to the permittivity. The current through these two parallel paths — the conduction currents due to the material conductivity and the displacement currents due to the permittivity — will change with frequency. At higher frequencies, there will be more displacement current relative to conduction current, so the ratio of the magnitude of the complex part of the impedance to the real part of the impedance increases.
With this understanding of impedance and how it varies with frequency, we can also address why the power excitation behaves differently over frequency. The power excitation instead represents an incoming signal that is partially reflected out of, and partially absorbed into, the model. The reflection is given by the S-parameter. For a one-port system, this can be computed from Z_s and Z_0, the cable impedance:
and, for a one-port system, the power absorbed within the system is given by
For this system, which has a high impedance mismatch between the cable and the sample of material being heated, a lot of the incident power will be reflected back. If you are instead exciting via a fixed current source, reflection due to impedance mismatch is not considered. All of the current will flow through the material either as conduction current or displacement current, and only the conduction currents lead to heating.
With these equations and material properties in mind, we should now have an understanding of why different excitation conditions demonstrate different heating as a function of frequency.
Voltage Excitation
Next we look at the Electric Currents Terminal of type Voltage. This boundary condition has an unambiguous meaning at DC, and at very low frequencies, e.g., the 60 Hz line voltage in household electric outlets. However, at higher frequencies we need to think a bit more carefully about how to get the same result from the Electric Currents interface and the Electromagnetic Waves interface.
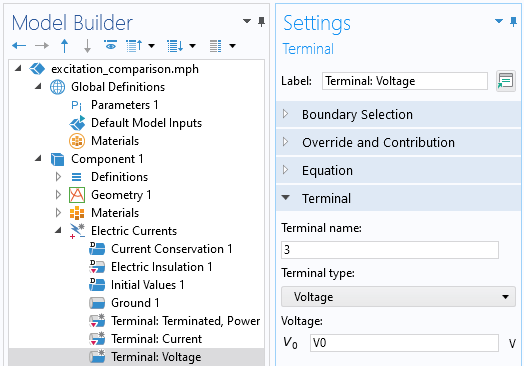
Screenshot of the Electric Currents Terminal condition, of type Voltage.
The Electromagnetic Waves physics interface has no boundary condition that is directly equivalent to fixing a voltage over an entire surface; you can only set the electric field at a boundary between two surfaces, which does not have a very firm physical interpretation at higher frequencies. We will look at this approach first, and then present a second approach.
The closest analogue of the Electric Currents, Voltage boundary condition in the Electromagnetic Waves interface is an Electric Field boundary condition, applied at the same annular boundary that the Lumped Port was applied in the previous approaches. Within this Electric Field boundary condition, we apply the expression for the distribution of the electric field that will lead to the same electric potential difference across the gap. For a coaxial cable (aligned with the z-axis), the analytic electric field within the dielectric is
This expression is evaluated on the finite element mesh and will become more accurate with mesh refinement. The settings for the boundary condition, and a sample mesh, are shown in the screenshot below.
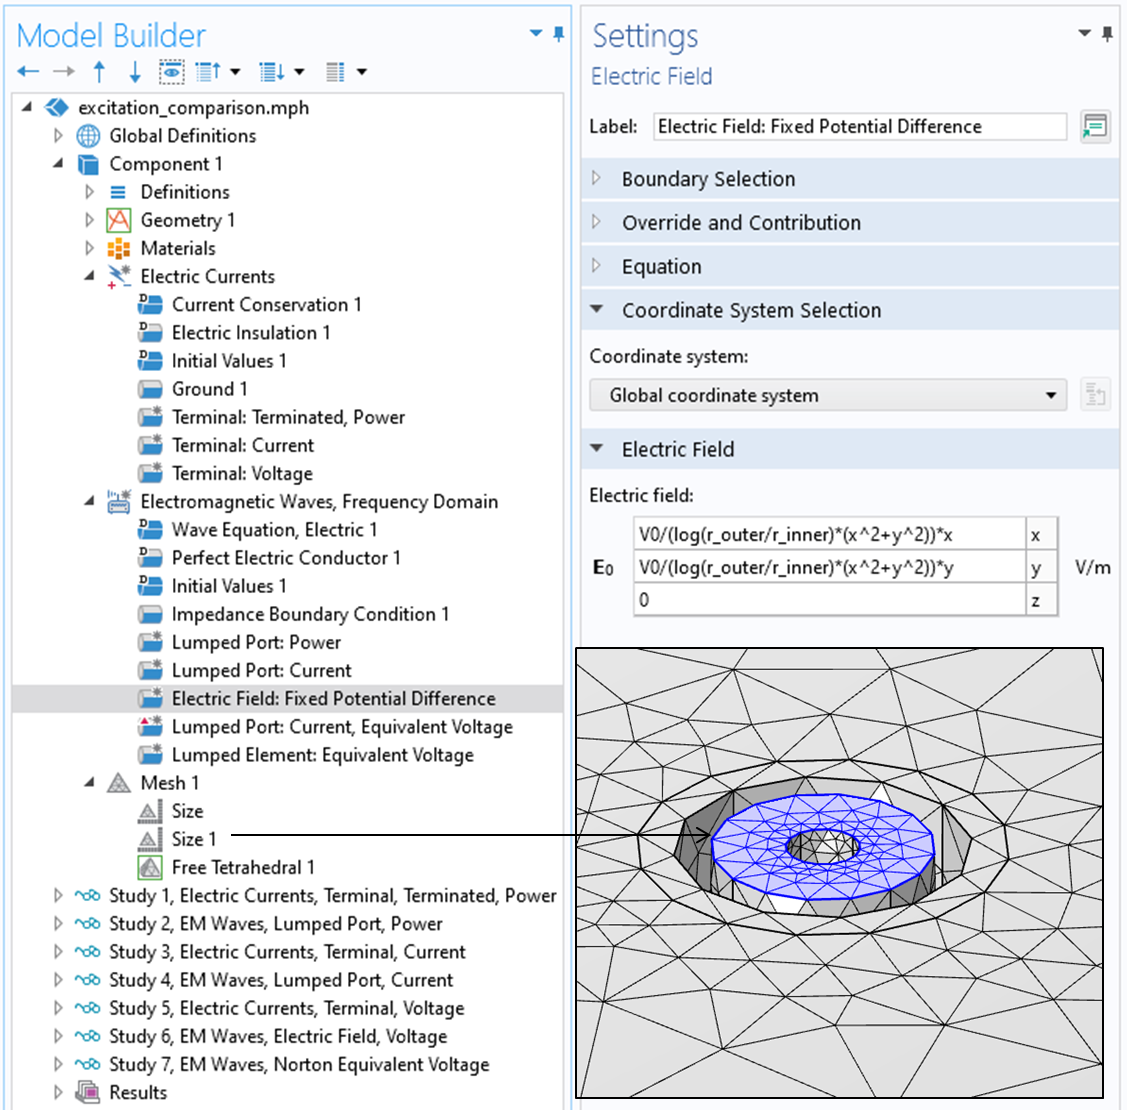
Screenshot of the Electric Field boundary condition in the Electromagnetic Waves interface, along with a visualization of the mesh.
Although this approach of fixing the electric field in the Electromagnetic Waves physics interface is the most direct analogue to the Voltage condition in the Electric Currents physics interface, it’s quite difficult to interpret physically, so it can be helpful to consider alternatives.
An approximation of a voltage condition can also be implemented by taking the Norton equivalent of a voltage source and using a Lumped Port, of type Current, in parallel with a Lumped Element, of relatively small resistance, placed a short distance away along the coaxial cable. The applied current is then adjusted such that the electric potential drop across this lumped element is approximately the applied voltage we want.
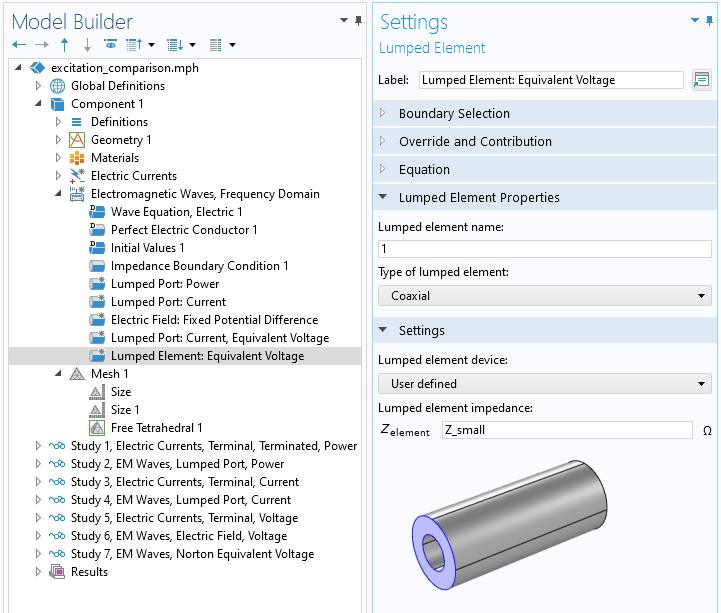
Screenshot of the Lumped Element boundary condition in the Electromagnetic Waves interface.
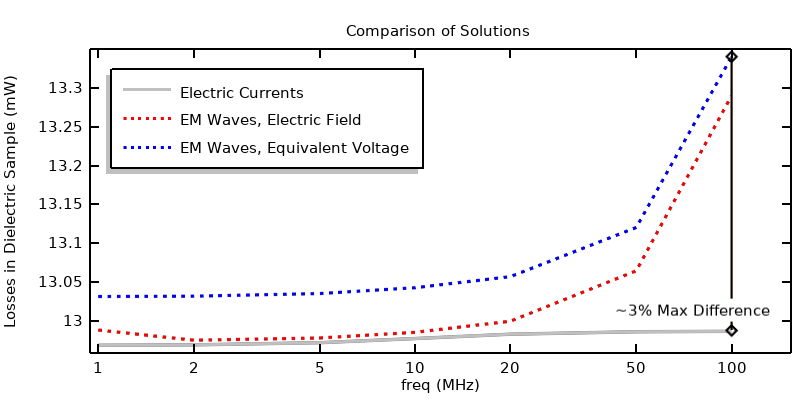
Comparison of results when using voltage excitations.
We can evaluate the losses from these approaches and compare them, as shown in the figure above. Again, there is good agreement over a wide frequency range. Even at 100 MHz the difference is less than 3% between them. We can also compute the losses from the impedance and applied peak voltage:
An Important Remark About the Insulation
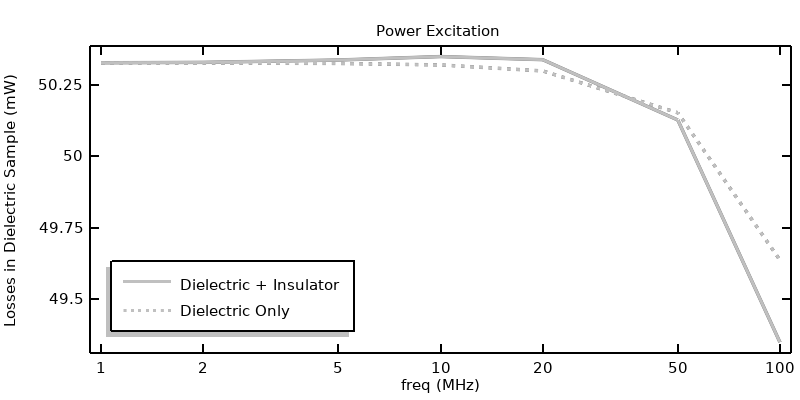
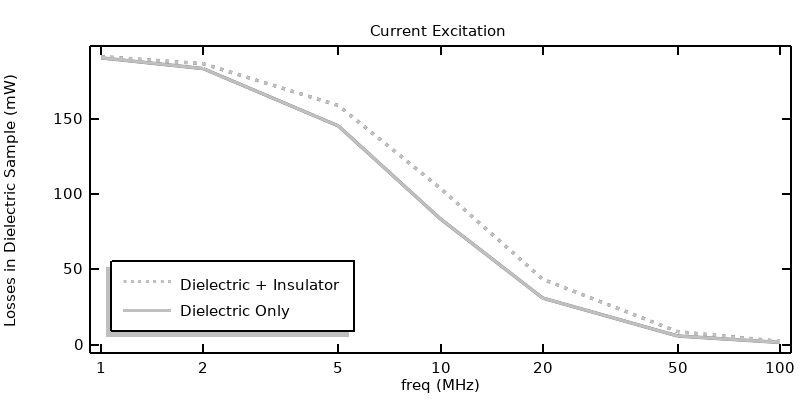
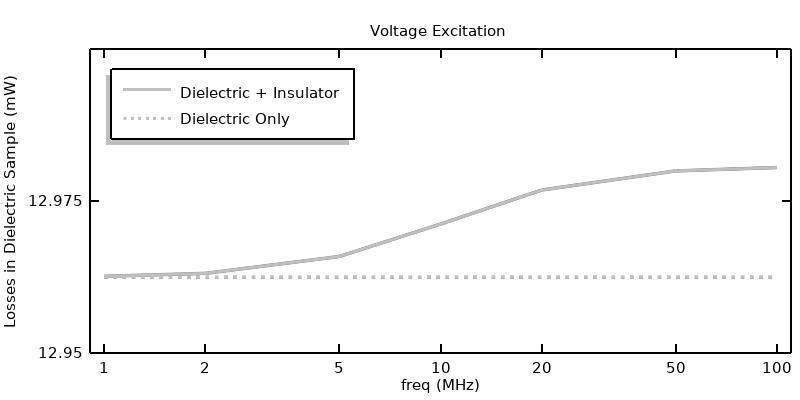
In the previous article, it is observed that the insulator material inside of the coaxial conductors and surrounding it could be omitted from the Electric Currents model entirely for the case of a power excitation. It’s worth checking this observation for all of the different excitation types. We can re-solve all of the previous approaches, solving for the Electric Currents in only the lossy dielectric sample, and then compare results, as shown in the figure below. The power and voltage excitations show very similar results, regardless of the modeling of the insulation. However, when exciting via current, the results are significantly different at higher frequencies since a displacement current path is being omitted from the model.
Comparison of the losses when solving for the Electric Currents in the insulator and dielectric sample versus solving for the Electric Currents in only the dielectric sample. The difference is pronounced for the current excitation, but negligible for the voltage or power excitation.
Connecting to the Electric Circuit Physics Interface
The voltage and current source conditions that we have looked at so far are idealized in that we ignore any intermediate structure between our source and our system being modeled. But it’s often the case that there is some electrically significantly structure that we do need to consider. We could include the exact details of these structures within the model, but a simplified approach is also available via the Electrical Circuits physics interface, and this can be combined with either the Electric Currents or Electromagnetic Waves physics interface.
As an example, suppose that we want to model a simple filter, as shown in the schematic below. A voltage source connected to a capacitor, inductor, and resistor in series with the system is being modeled. The Electrical Circuits interface is based on the concept of nodes, at which the electric potential is computed. The current between these nodes is computed based on the impedance of whatever is between the nodes, and this can be any feature of the Electrical Circuit interface, or can be computed from another physics interface via an External Coupling feature. In this example, we want to place our model between nodes 3 and 4.
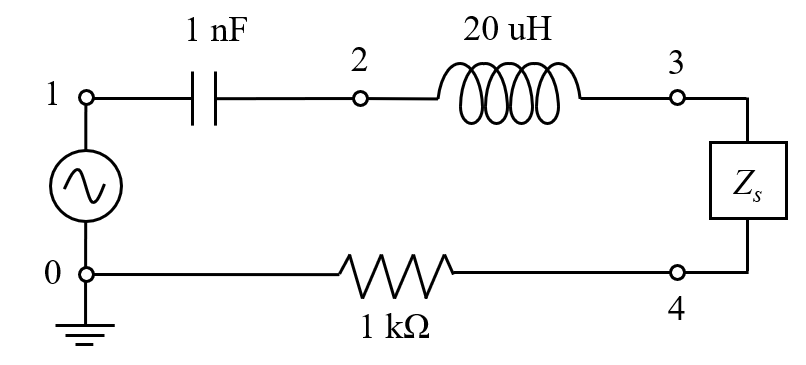
Circuit diagram of a voltage source, capacitor, inductor, and resistor connected to the system model.
Within the context of connecting an Electrical Circuit to the Electric Currents interface, the coupling is defined via the External I-terminal feature. This couples the electric potential of a node within the Electrical Circuits interface with the electric potential at a set of surfaces within the Electric Currents interface, as defined via the Terminal boundary condition of type Circuit. With this approach there should be only one Ground condition in the model and it should be within the Electrical Circuits interface.
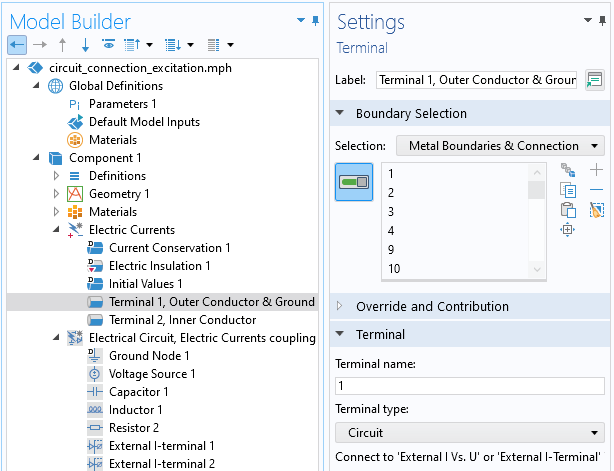
The Terminal condition of type Circuit. The electric potential of selected surfaces of the terminal will be coupled with one node of the Electrical Circuit.
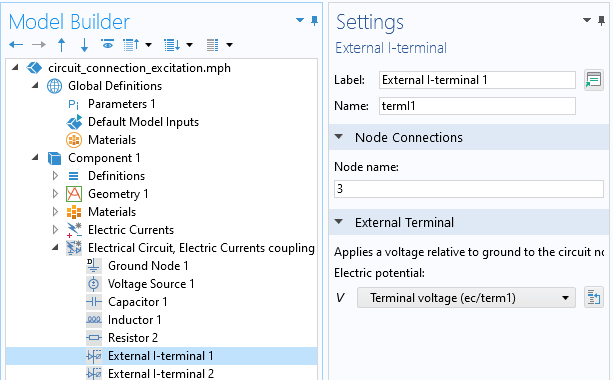
The External I-terminal feature specifies the coupling between the node of the Electrical Circuit and the Terminal electric potential.
Within the context of connecting an Electrical Circuit with the Electromagnetic Waves interface, the coupling is defined via the External I vs. U feature. This couples the electric potential difference between two Electrical Circuit nodes with the electric potential difference across a Lumped Port, of type Circuit, within the Electromagnetic Waves interface.
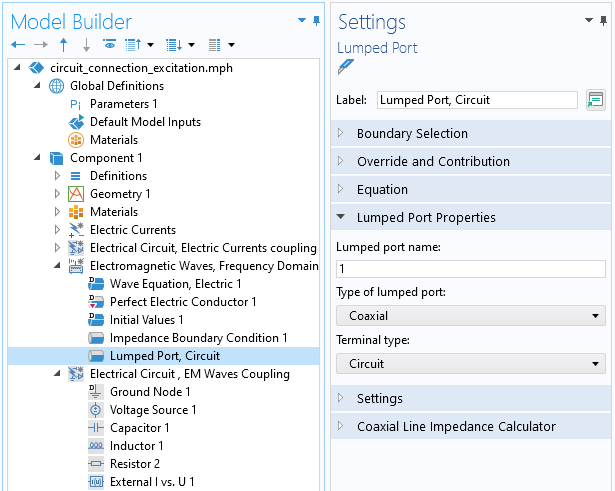
The Lumped Port of type Circuit. The electric potential difference will be coupled with the difference in potential between two nodes of the Electrical Circuit interface.
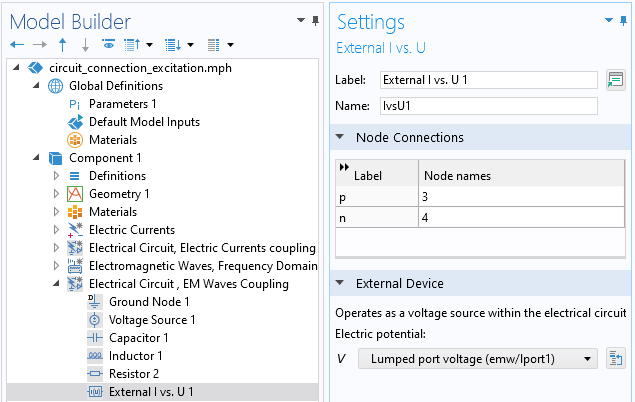
The External I vs. U feature couples the potential difference of the Lumped Port between two nodes of the Electrical Circuit.
There is an additional computational cost to adding the Electrical Circuit interface, as it will often require using the Direct solver to compute the Fully Coupled system of equations (see also our knowledge base entry “Understanding the Fully Coupled vs. Segregated approach and Direct vs. Iterative linear solvers”). This increases memory requirements and computational time. The results are shown in the figure below, and there is negligible difference between the two approaches. Note that the peak in the losses versus frequency is due to the lumped inductor.
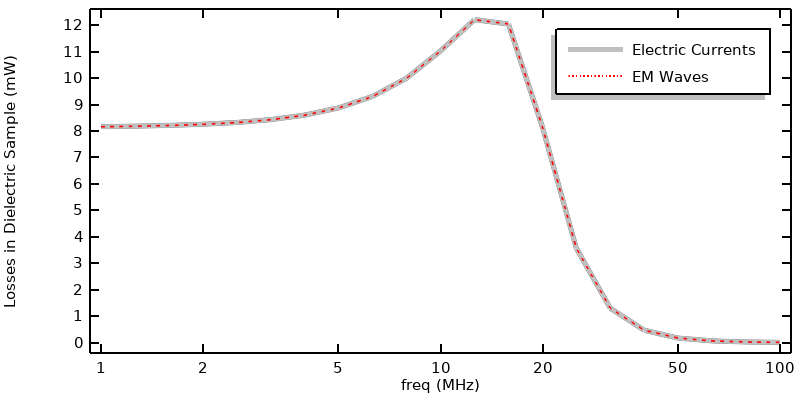
Losses versus frequency when a capacitor, inductor, and resistor are included in series between the voltage source and model.
Depositing Fixed Power into the Model
Finally, suppose that you want to model a source that includes a feedback loop that adjusts the input such that a fixed power is deposited. There are several ways to achieve this. We start by briefly mentioning the two built-in options and discuss their limitations, and then introduce a third, more general approach that requires more set up but offers more flexibility.
Within the Electric Currents, Terminal boundary condition, the Power option implements feedback by introducing an additional coupling equation into the model that will adjust the applied current such that the specified peak-to-peak power is deposited within the model. That is, whatever power is specified within the terminal will be twice the power dissipated within the domain, for a frequency-domain model. This additional, fully coupled equation results in a nonlinear system of equations that is nonsymmetric and nonlinear, meaning that convergence depends on initial values, scaling, and solver settings, and will require a fully coupled direct solver. It will thus be computationally expensive and should be reserved solely for cases where there is a very strong nonlinearity within the model, such as for plasma modeling.
Within the Electromagnetic Waves physics interface, there is the Port boundary condition, with the Enable active port feedback option. The Port boundary condition can be used for any type of waveguide or transmission line. This boundary condition is less computationally demanding. However, both of these approaches have a drawback: they deposit the specified power within the entirety of the model, over all domains and boundary conditions that can introduce losses.
Suppose that we instead want to specify the deposited power into just one domain (or boundary) of the model. In this case, we need to use a different approach, introducing a Global Equation that iteratively adjusts the input to achieve the ideal output, as described here.
In short, this approach is composed of three steps, regardless of the physics being solved:
- Specify the excitation using a variable defined via a Global Equation.
- Write an update expression for the Global Equation that will iteratively update the magnitude of the excitation during the solution.
- Ensure that the segregated solver is being used so that the Global Equation is solved as a separate step.
We will look at the case of current excitation applied to Electric Currents in detail, as the other cases are fairly similar in setup.
To begin, the applied current is specified not as a constant, but via a variable, as shown in the screenshot below:
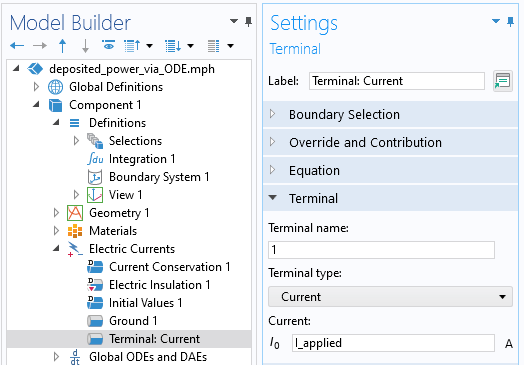
Screenshot showing the current specified as a variable.
Next, the update equation for the applied current is specified via the Global Equations interface, as shown in the screenshot below.
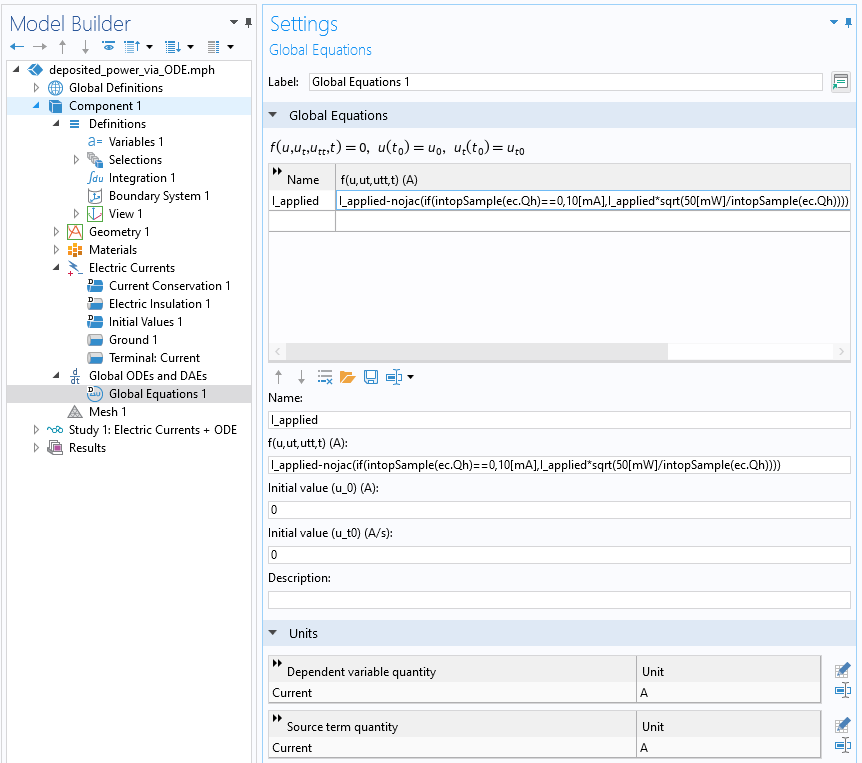
Implementing a feedback equation via an additional Global Equation. Note that the units are set to Amps.
The iterative update equation is:
I_applied-nojac(if(intopSample(ec.Qh)==0,10[mA],I_applied*sqrt(50[mW]/intopSample(ec.Qh)))).
This equation makes usage of an Integration Coupling named intopSample() that computes the integral of the losses within the sample domain. This equation first checks if the integrated loss is zero (the initial state), and if at the initial state, the equation sets the current to 10 mA, otherwise the equation compares the computed dissipation with the target dissipation of 50 mW and scales the applied current. So, this one expression contains both the initialization of the current as well as the update expression. It’s therefore necessary to ensure that the segregated solver is used and that the variable from the Global ODEs and DAEs interface is solved first, as shown in the screenshot below. The second segregated step, solving for the Electric Currents, can then use the computationally efficient iterative solver.
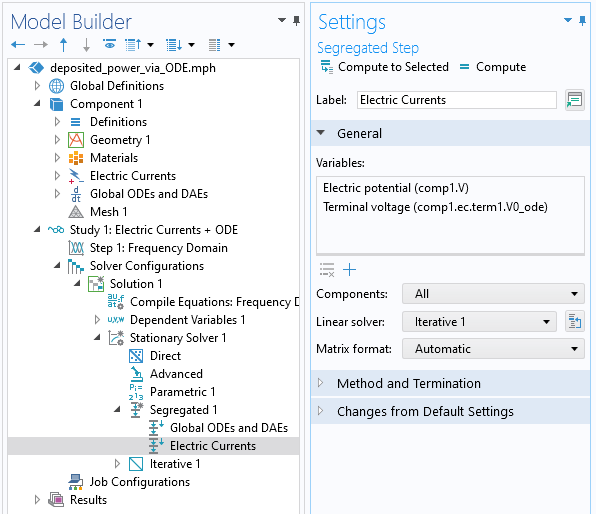
The segregated solver settings. The initialization and feedback equation is solved first, and the the physics are solved with the default iterative solver.
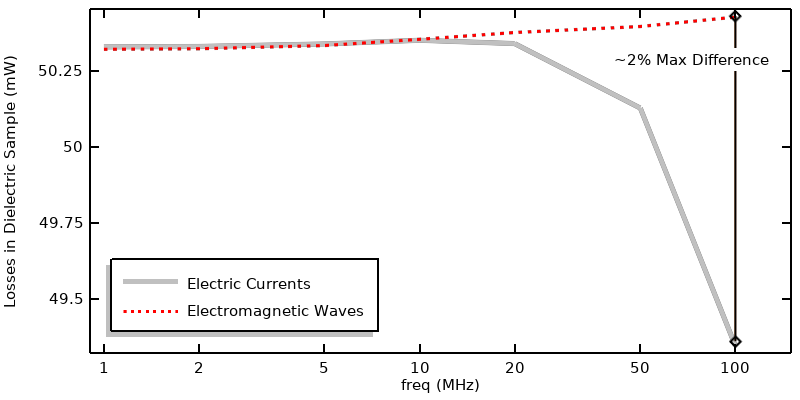
With this approach, the losses in the dielectric sample will be 50 mW at all frequencies, and we can plot the applied current, or the applied voltage, that will achieve this dissipation.
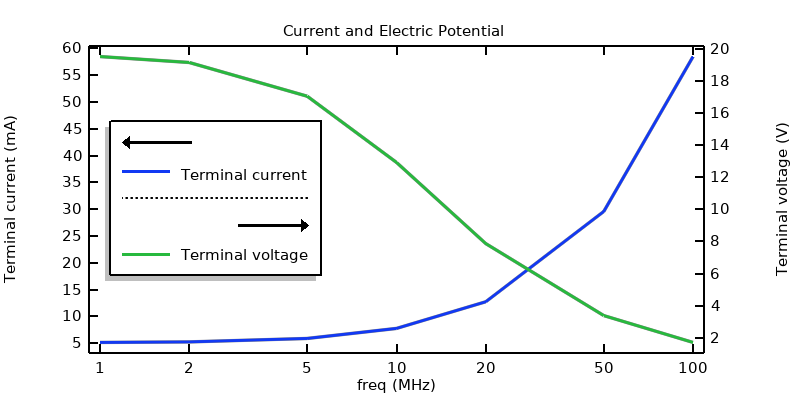
The terminal current and terminal voltage that will lead to a specified dissipation within the sample domain.
Closing Remarks
We have gone through the excitations used for frequency-domain electric currents modeling, and have compared them with their analogues in the Electromagnetic Waves physics interface. The focus here has been on the 1–100 MHz frequency range for this system, but the conclusions can extend below this range or even above it, depending on the case in question. The takeaway here is an understanding of the differences between the excitation options and how to use them. The associated files are available via the button below.




Comments (2)
Julian Anaya
May 11, 2023Great tutorial Walter!
Walter Frei
May 11, 2023 COMSOL EmployeeThank you Julian, Happy Modeling!