
When simulating acoustic waves, vibrating mechanical hardware, or fluid in a channel — just to name a few applications — you may be interested in visualizing the movement or shape change in a device. Postprocessing and visualization can help enhance your understanding of simulation results, and using plots to illustrate physical motion allows you to put everything into perspective. Deformations are a great way to accomplish this.
3D Deformations and Scaling
A deformation refers to a node that can be added to a plot to deform the visual results according to a chosen vector quantity. In structural mechanics applications, you might want to show the displacement of a part. In acoustics models, which we’ll discuss most extensively here, you can visualize the actual shape of the wave.
Let’s consider the example of a condenser microphone, which can be found under File > Application Libraries > Acoustics Module > Electroacoustic Transducers > condenser microphone, or downloaded here. For those of you who do not have the Acoustics Module installed, note that you can still open the tutorial model to investigate the settings and run postprocessing.
The condenser microphone tutorial model studies the deformation of a membrane (a diaphragm) in the microphone that transforms mechanical displacement into an AC signal. An existing plot in the solved tutorial model called 3D Membrane deformation already shows the deformation of the diaphragm:

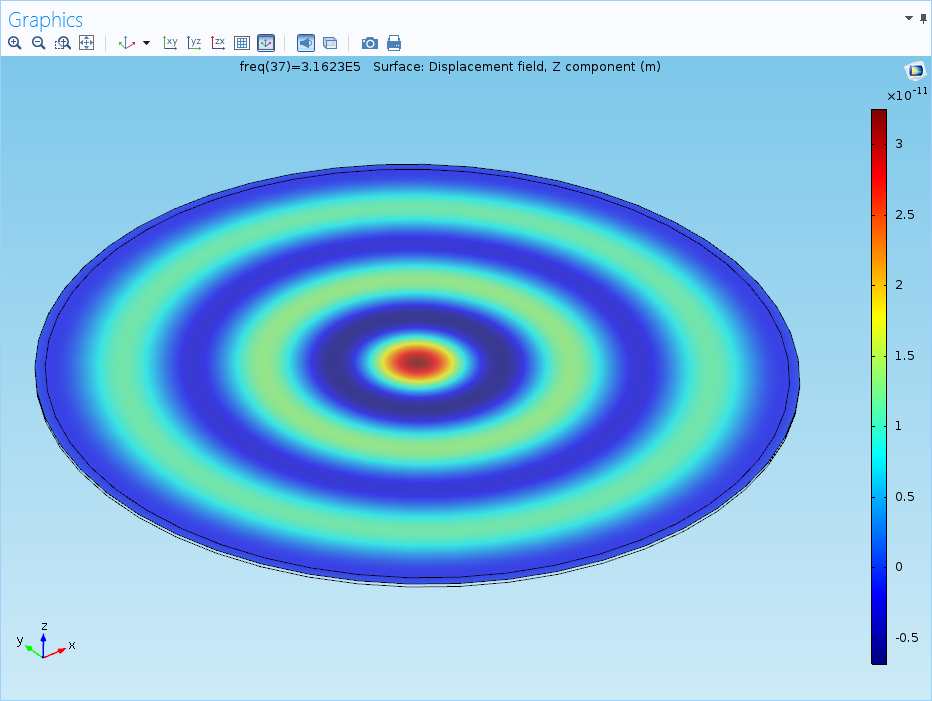
The surface node plots the displacement field in the vertical direction at a chosen frequency. The plot below illustrates the maximum frequency in the simulation, with the deformation disabled (to disable a node, right-click and choose Disable):
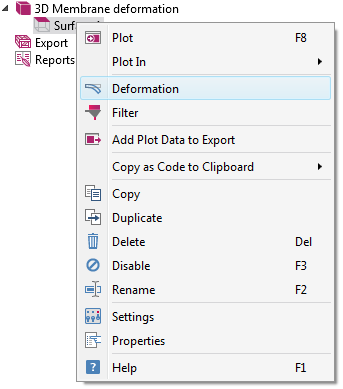
To add a deformation from scratch, right-click the appropriate plot node and choose Deformation:
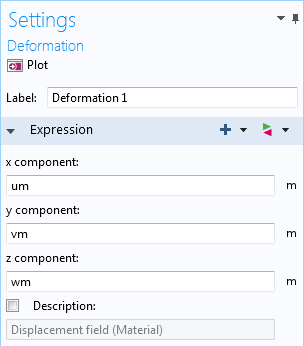
Deformations can be applied to most 2D and 3D plot types — arrow, isosurface, contour, streamline, surface, slice, and volume. In the settings, you can choose the relevant vector quantity (in this case, the displacement field):
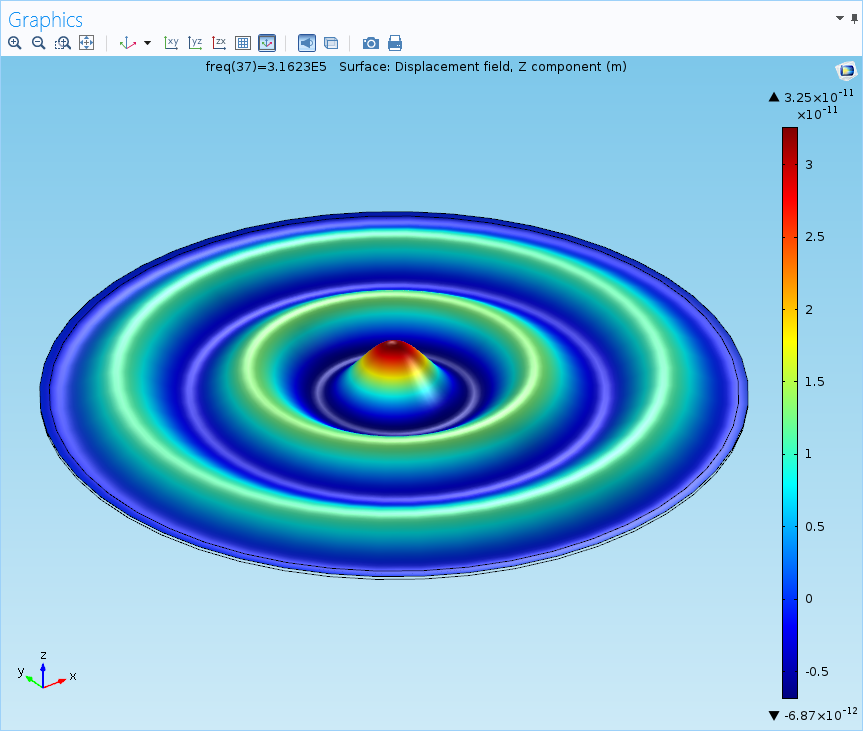
With the deformation plot re-enabled, we can see the changes in the shape of the membrane for this frequency:
If you take another quick look at the settings, you’ll notice that there is a very large scale factor:

Deformations are often scaled by a large factor in order to make microscale changes and deflections visible, or to shrink enormous deformations so they don’t obscure important parts of the model. In very small devices such as MEMS hardware or in the case of this microphone, real deformations are not always visible to the naked eye.
Height Expressions
Height expressions are a special kind of deformation that, rather than being based on a vector quantity, plot a single variable. This type of deformation allows you to transform a 2D plot into a 3D plot. In another acoustics simulation (found under File > Application Libraries > Acoustics Module > Piezoelectric Devices > piezoacoustic transducer or downloaded here), one plot uses a height expression to demonstrate the acoustic pressure field generated by a piezoacoustic transducer.
The pressure field is originally plotted on a surface in two dimensions:
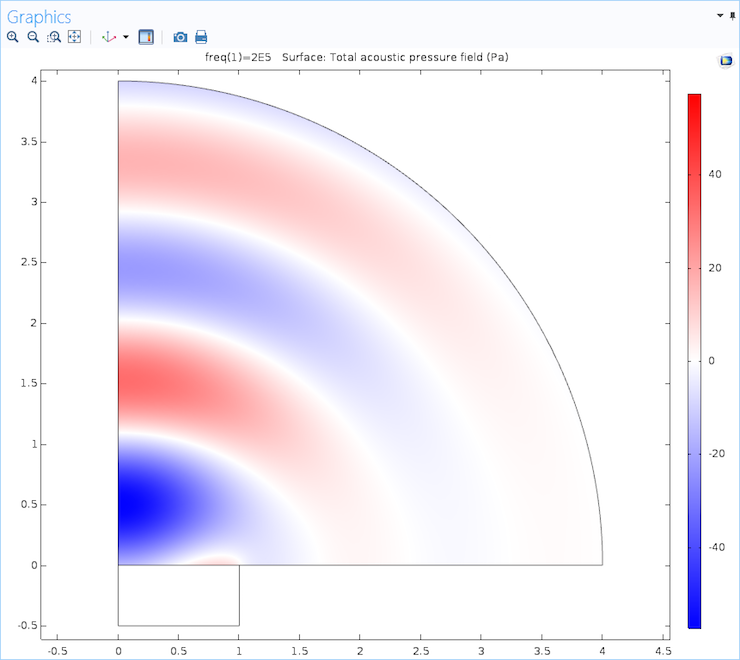
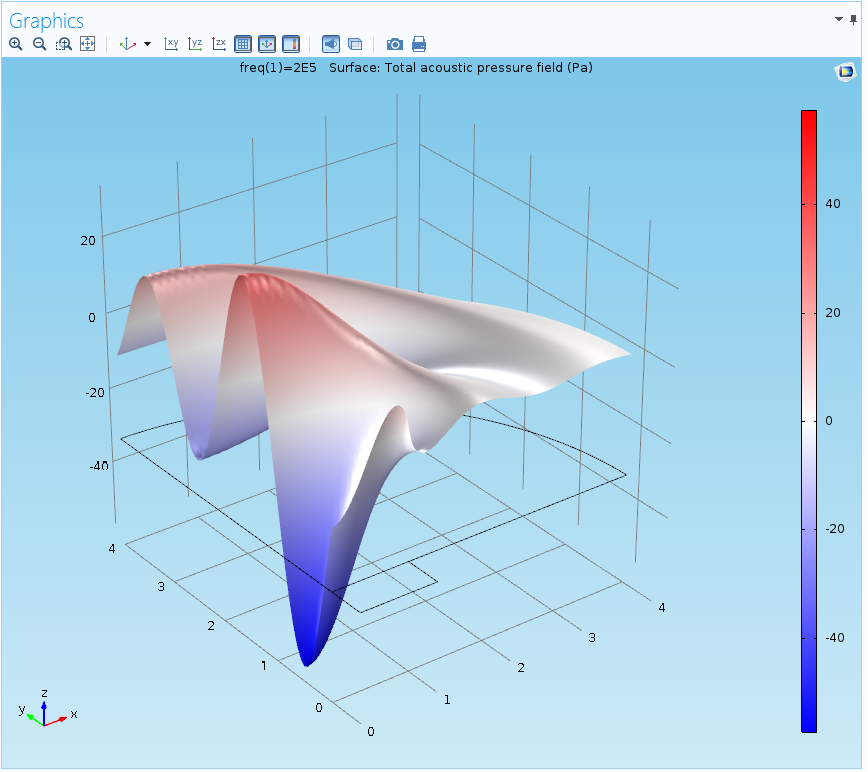
A height expression, however, will turn this surface into a 3D plot, showing the height of the peaks and troughs:
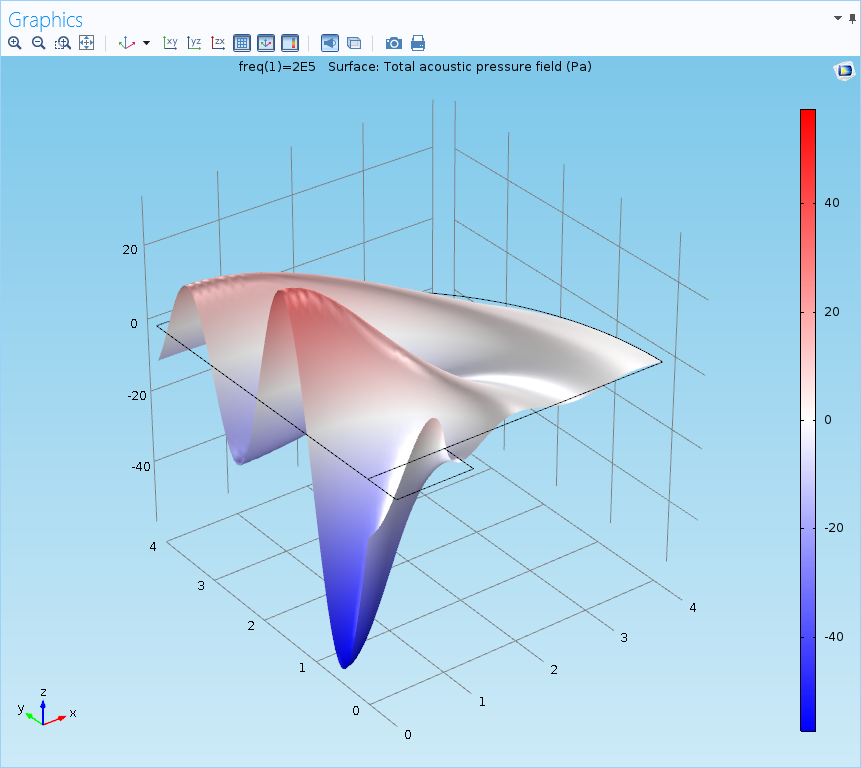
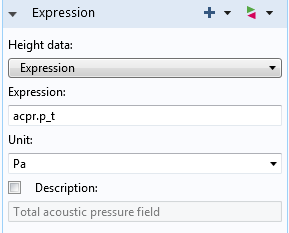
This particular height expression pulls settings from the parent node; however, the settings can also be set to use an expression selected by the user. In this tutorial model, the default expression for the height data will base the height of the surface at each point on the magnitude of the acoustic pressure field:
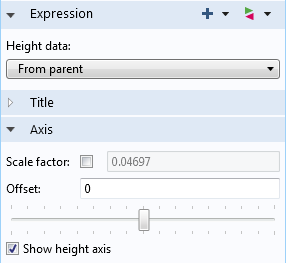
Height expressions also have an offset toggle bar (shown above) that allows you to manually shift the entire deformed structure in the z-direction. The plot below indicates the results, with an offset of 1.5.
Periodic Arrays
Finally, we’ll take a look at 2D deformations that are very useful for creating periodic arrays — arrangements where an object or pattern is repeated over and over, but usually only a single cell or slice of the device has been modeled.
To demonstrate this, we’ll turn to the plasmonic wire grating tutorial model. The tutorial model can be found under File > Application Libraries > RF Module > Demo Tutorials > plasmonic wire grating or downloaded here. This example computes transmission and reflection coefficients for a planar electromagnetic wave incident on a wire grating. Rather than modeling the entire device, a unit cell representing only one bar of the grating is used. However, the tutorial model contains a periodic condition to indicate that, in the real structure, the cell is repeated on either side of itself.
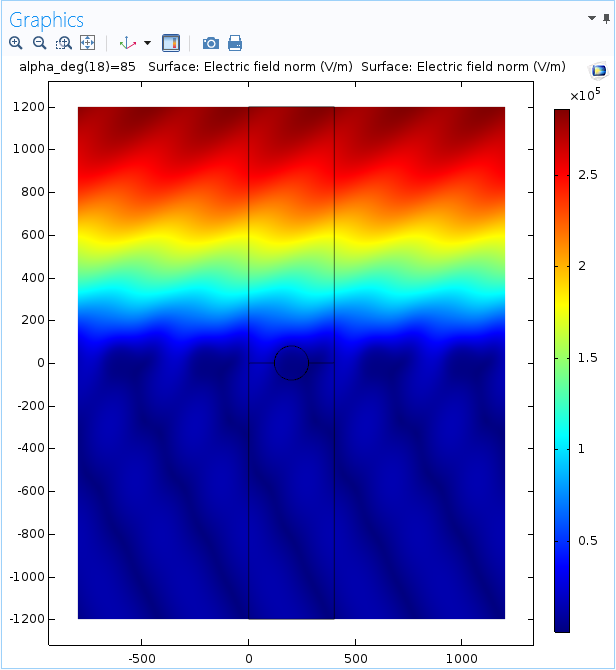
The results for the plasmonic wire grating tutorial model show the electric field norm on the grating for a chosen angle of incidence. Although the solved tutorial model in the Application Libraries contains an array data set, we have generated a new surface plot that demonstrates the creation of an array using deformations:
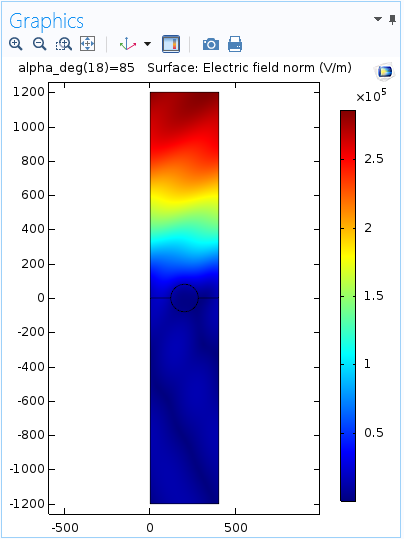
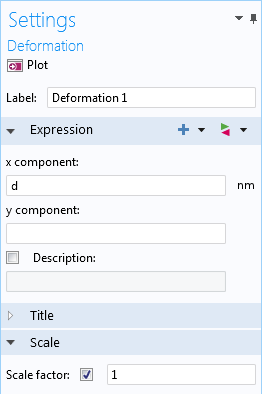
In some cases, a 2D array data set is faster and easier to use than a deformation; however, individual deformations enable you to control the exact placement of different copies of a solution. Here, we have translated a second surface by d nanometers (nm), which is the width of the unit cell, in the positive x-direction:
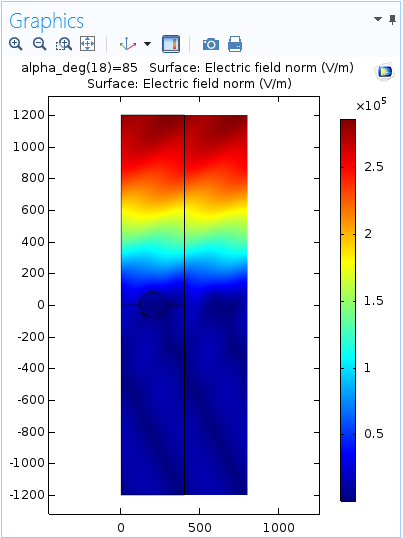
The scaling factor is set to 1 to ensure that the surface moves by the correct distance. Notice that the title is now duplicated as well. The plot title can be disabled in the node for each surface plot in order to avoid repeats. The same can be done for color legends.
We can duplicate this surface and simply change the expression for the x-component in each plot, and thus line up several cells next to each other:
The figure below illustrates the results with four translated copies of the surface. The original plot is in the center, with the outline of the data set shown:
Additional Examples
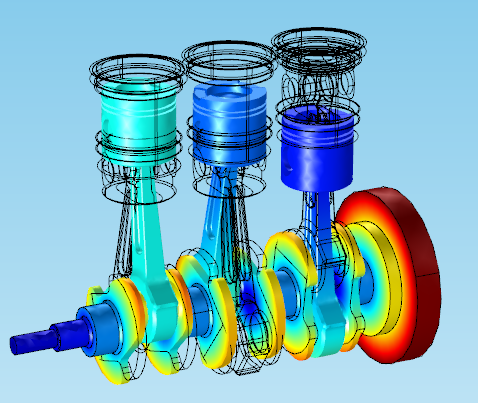
While we won’t go into detail here about other cases of using deformations, you might also want to show displacements in many structural mechanics and fluid models. For example, the plot below shows the displacement of a reciprocating engine in motion, with the outlines of the original position:
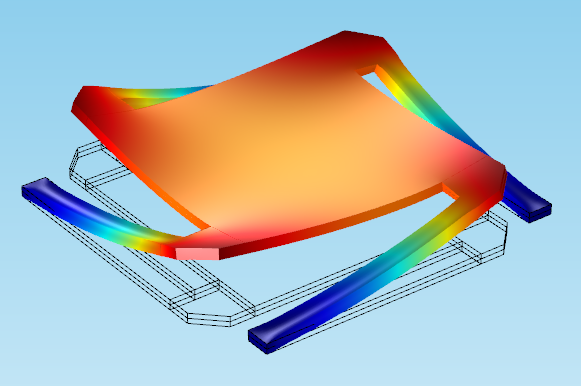
In this tutorial model of a micromirror, a deformation shows the displacement field (with u, v, and w components) to depict the mirror’s response to different levels of prestress. The outline of the original position (flat) is shown underneath:
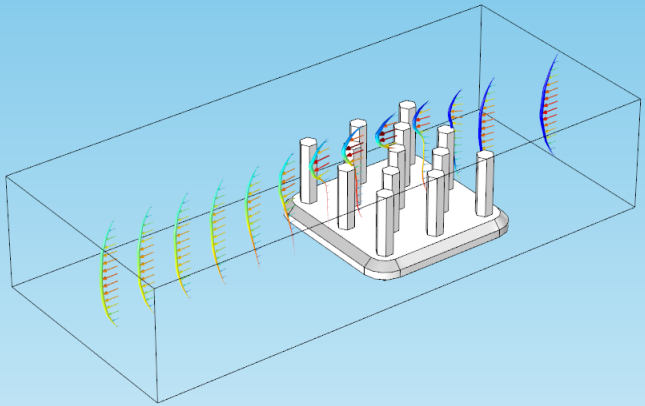
Deformations can also be used to creatively illustrate fluid flow so the meaning becomes clearer. In the figure below, a line plot is deformed according to the velocity of air flowing across a heat sink:
That wraps up our blog post on deformations. In the next blog post of our postprocessing series, we will focus on various tips and tricks designed to advance your postprocessing techniques!


Comments (0)