
By modeling the effects of heat and moisture transport in an insulated roof, building physics engineers can design mold-resistant and sustainable roof structures. In order to demonstrate this point, we analyze heat and moisture transport in an insulated roof model based on a Heat, Air and Moisture StanDardization (HAMSTAD) benchmark. Then, we use the temperature and relative humidity computed from the benchmark model as inputs for a mold growth prediction model.
Mold Growth in an Insulated Roof
Designing roofs with insulation has been a common practice for centuries. In ancient Egypt, people used dried mud bricks to build their homes, which kept them cool in the heat and warm in the cold. Ancient Romans used the fire-resistant mineral asbestos for insulation in their building materials.

Example of mud brick homes built along a canal in Egypt. Image by Bernard DUPONT. Licensed under CC BY-SA 2.0, via Wikimedia Commons.
Insulated roofs are still popular today, but a problem affecting them is not: mold growth. Fortunately, we have the capability to design mold-resistant roofs using simulation.
Surprisingly, mold itself isn’t dangerous (or toxic). However, certain molds (like stachybotrys chartarum, or “black mold”) release spores that include dangerous substances called mycotoxins. Once mycotoxins become airborne, they can be inhaled, absorbed through the skin, and ingested. Excess exposure to mycotoxins is believed to cause a myriad of health issues, including allergies, inflammation of the respiratory system, memory loss, and more. Even dead mold spores can still cause lasting negative health effects.

Closeup of mold in a Petri dish. Image by RimmaKhaz — Own work. Licensed under CC BY 4.0, via Wikimedia Commons.
Most mold found in (and on) roofs is considered nontoxic and relatively harmless to people, but it’s still an unwanted trespasser. Mold multiplies fast, and it can look and smell unpleasant. Plus, it can negatively impact building sustainability.
Moisture is a key cause of mold growth in a roof. Mold only needs 24–48 hours of moisture exposure to grow. One way moisture can form is from excess condensation. In this example, we analyze an insulated roof model with high risk of condensation at the contact surface between its load-bearing and insulation layers.
Modeling a HAMSTAD Benchmark Case
In 2000, the European Union developed five HAMSTAD benchmarks in order to standardize heat, air, and moisture transport practices in building constructions. These one-dimensional benchmark cases are a popular choice when it comes to testing the accuracy of simulation tools used in building physics.
Here, we focus on simulating the first HAMSTAD benchmark case using the COMSOL Multiphysics® software and add-on Heat Transfer Module. This benchmark covers heat and moisture transport in an insulated roof.
To start, we model the insulated roof, which consists of three main parts, including the:
- Moisture barrier
- Load bearing
- Insulation layer
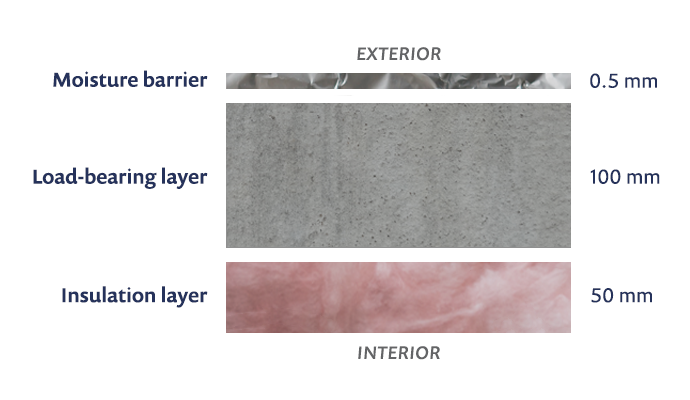
For this model’s geometry, the main focus is on the load-bearing and insulation layers. The moisture barrier is not included in the geometry, but is shown here for visual purposes. The structure is completely airtight.
The load-bearing and insulation layers are porous. However, the load-bearing layer is capillary active (water-flow absorbent), while the insulation layer is capillary nonactive (water-flow resistant). The two materials’ opposite capillary qualities induce high relative humidity levels at the contact surface between them, resulting in the internal condensation that causes the mold to grow.
The moisture transport in the load-bearing and insulation layers depends on the following property functions:
- Water content
- Vapor permeability
- The liquid diffusion coefficient, obtained from the liquid permeability and suction pressure
The heat transfer in the load-bearing and insulation layers depend on the following property functions:
- Density, heat capacity, and thermal conductivity of dry materials
- Water content
Simulating Heat and Moisture Transport in an Insulated Roof
The simulation covers a span of five years, with the climatic load applied over a one-year period. The exterior and interior of the insulated roof are exposed to different temperatures. A convective heat flux in the exterior is defined by varied seasonal temperatures, while a convective heat flux in the interior is defined by a constant temperature of 20°C (68°F). Partial vapor pressure from the benchmark’s climate data is used to define a convective moisture flux in the interior. The exterior and interior spaces have an initial temperature of 20°C (68°F), and the load-bearing and insulation layers have relative humidity values of 99.2% and 60%, respectively.
Simulation Results
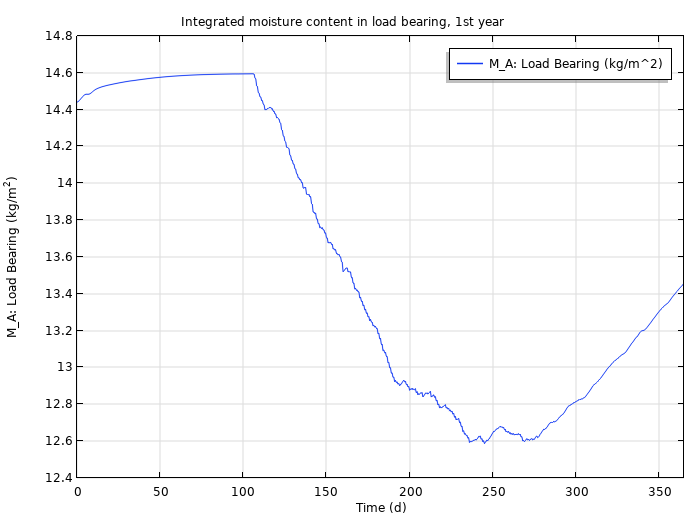
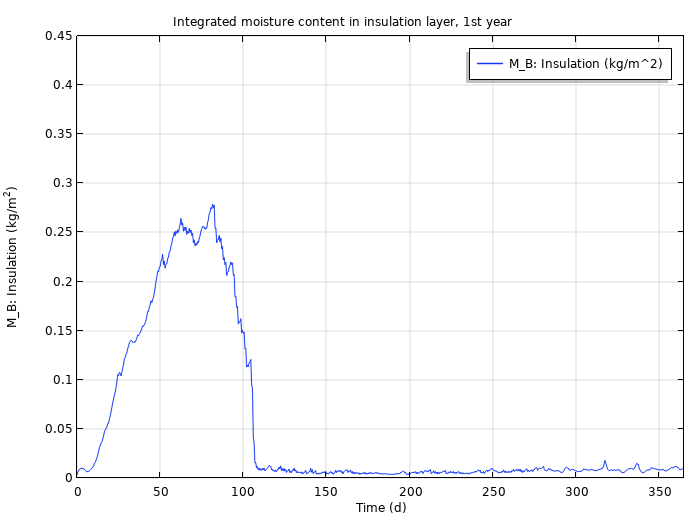
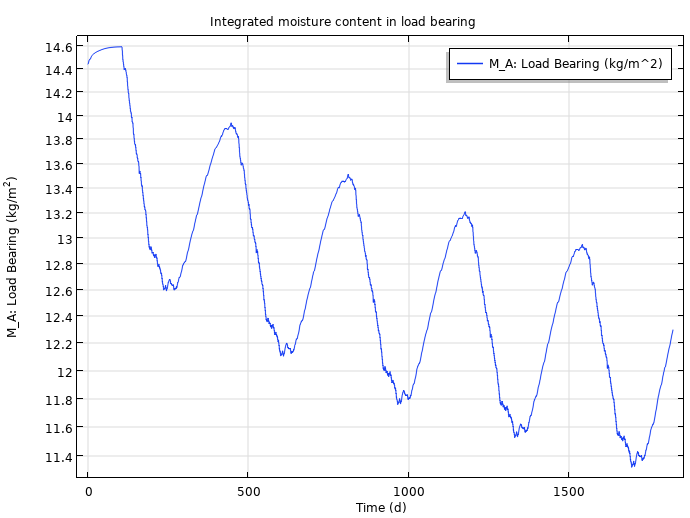
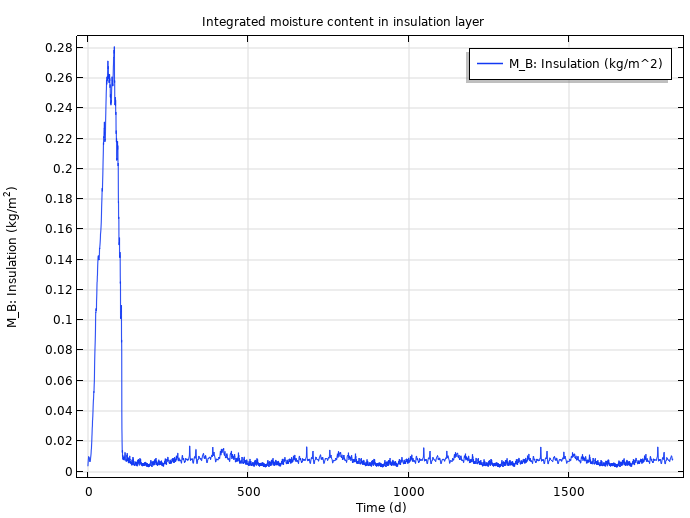
In the graphs below, you can view the numerical results obtained from the COMSOL Multiphysics simulation.
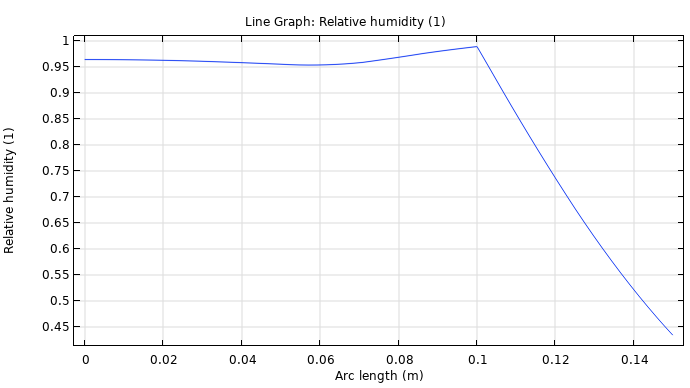
The relative humidity in both the load-bearing and insulation layers after one year.
The integrated moisture content in the load-bearing layer (left) and insulation layer (right) after one year.
The integrated moisture content in the load-bearing layer (left) and insulation layer (right) after five years.
The COMSOL Multiphysics results are in very good agreement with the numerical results of the HAMSTAD benchmark, which demonstrates that you can confidently use the Heat Transfer Module to generate verifiable results. Next, we can use the temperature and relative humidity computed by this simulation as inputs for a VTT mold prediction model.
The VTT Mold Growth Model
The VTT model predicts mold growth and decline at the surface of materials as a function of temperature and relative humidity. It’s an empirical model that is based on regression analysis of measured data with different mold species. The original VTT model only accounts for mold growth on wood-based materials, like pine and spruce sapwood, while the updated VTT model includes additional building materials, like concrete, glass, and metal products.
In this model, mold growth development is defined by the mold index (M), which is computed by solving ordinary differential equations (ODEs). The mold index is expressed on a scale from 0 to 6. A mold index of 0 indicates no mold growth, and an index of 6 indicates almost 100% mold growth. Mold makes its first visual appearance at an index of 3.
It’s important to note that the updated VTT model also includes four mold sensitivity classes:
- Very sensitive (untreated wood)
- Sensitive (wood-based boards)
- Medium resistant (cement)
- Resistant (glass and metal materials)
Solving the VTT Model with COMSOL Multiphysics®
The temperature and relative humidity computed in the benchmark tutorial are used as inputs for mold growth prediction in the medium-resistant sensitivity class. We can determine the mold growth index over time for each sensitivity class by using the Heat and Moisture Transport in Building Materials interface in the Heat Transfer Module, as well as mold growth and decline rate equations and conditions.
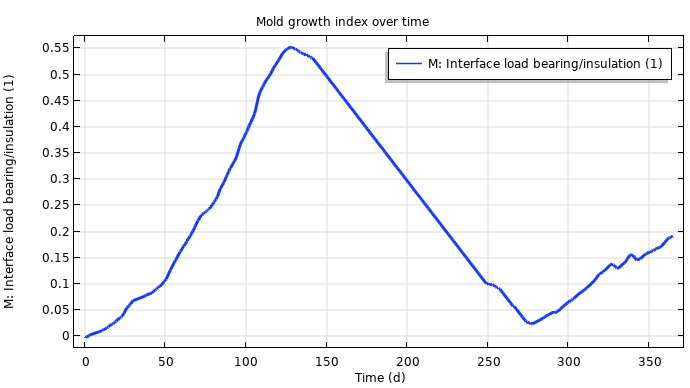
Mold index over time for the medium-resistant sensitivity class. The results show small amounts of mold on the material’s surface, indicating mold is in its initial stages of growth.
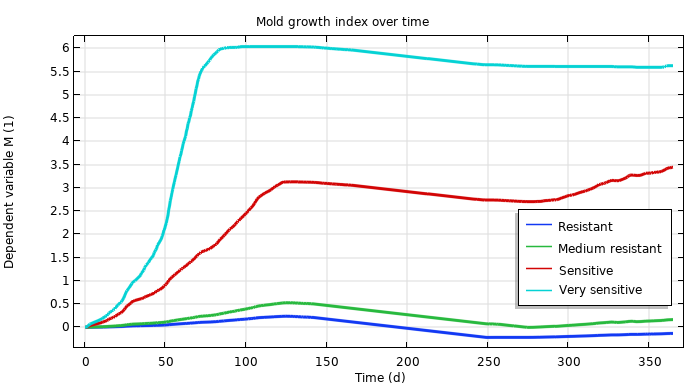
Mold index over time for all sensitivity classes.
Next Steps
Try modeling heat and moisture transport and mold growth in an insulated roof by clicking the links below. Doing so will take you to the Application Gallery examples.




Comments (0)