The sand on a windswept beach, the swirl of distant stars, the skin of a tropical fish: wherever we look, we may see patterns in nature. Under certain conditions, intricate designs can emerge from a seemingly random mixture of elements and forces. This pattern-making process of morphogenesis can be observed in living things and inanimate matter, and, in some cases, be described by reaction-diffusion equations. With chemical modeling, we can simulate the conditions behind the emergence of Turing patterns, and we can watch the visually stunning results!
From Autocatalytic Reaction to Turing Pattern
The Cubic Autocatalysis: Exploring the Gray-Scott Model tutorial model, which was developed using the Chemical Reaction Engineering Module, simulates the effects of autocatalytic chemical reactions governed by reaction-diffusion equations. Here is an example of a simple autocatalytic reaction:
A + B → 2B
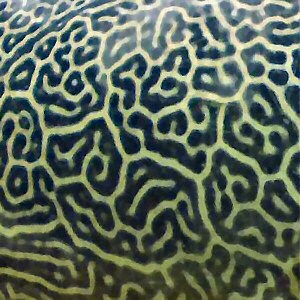
If a reaction is fueled by the presence of substance A and substance B, then the reaction will produce substance B until it runs out of substance A. As the relative proportion of B rises while A decreases, the entire mixture will spread around in its domain. This movement — or diffusion — will not be linear, but it won’t be entirely random, either. It will create designs called Turing patterns after Alan Turing, the great mathematician who described this process in a 1952 paper, “The Chemical Basis of Morphogenesis” (Ref. 1).

The skin of a giant pufferfish, which displays one of the many Turing patterns found in nature. Image by Chiswick Chap, licensed under CC BY-SA 3.0, via Wikimedia Commons.
The Gray-Scott Model of Multistable Reaction-Diffusion Systems
What happens if we make our autocatalytic reaction-diffusion system even more nonlinear? In the 1980s, researchers P. Gray and S.K. Scott (Ref. 2) explored the behavior of a reaction that would accelerate faster:
A + 2B → 3B
Gray and Scott added, as a condition of their system, that substance B would decay over time. Their research found that these conditions would cause the reaction-diffusion process to exhibit multistability. This means that the dynamic process would achieve an equilibrium, where the quantities and distribution of A and B would be nearly stable — but only for a moment. The system would proceed to oscillate between stability and periods of rapid and intricate spatial diffusion. This phenomenon is now named after Gray and Scott, and its action has been observed in chemistry, physics, and biology.
Simulating the Gray-Scott Model in COMSOL Multiphysics®
The autocatalysis tutorial model enables construction of a Gray-Scott model simulation. You can set parameters of the reaction-diffusion process and then generate an animation of its effects. These actions take place in a user-defined 2D component that describes a rectangular field with periodic boundary conditions. This component is based on an idealized continuous stirred tank reactor (CSTR), which assumes perfect mixing of reagent as it enters a chemical reactor vessel. The reaction begins with the addition of a uniform concentration of substance A and substance B, which interact inside the CSTR.
The animation below shows the initial concentrations of substance A and substance B and how they change over time. Note that while the two substances are presented side by side, they are in fact crowded together in the same domain. The reaction begins with an inflow of mixed A and B into the CSTR. The rate of inflow is described by parameter k, which is swept across 10 equidistant values. This sweep enables us to identify how the rate of inflow affects the behavior of the reaction-diffusion process, and the patterns it creates. Here is an animation of the reaction caused by an inflow of 0.0609/s:
Animation of the changing quantities and distribution of substances A (left) and B (right), as sustained by an inflow of reagent at a rate of 0.0609/s.
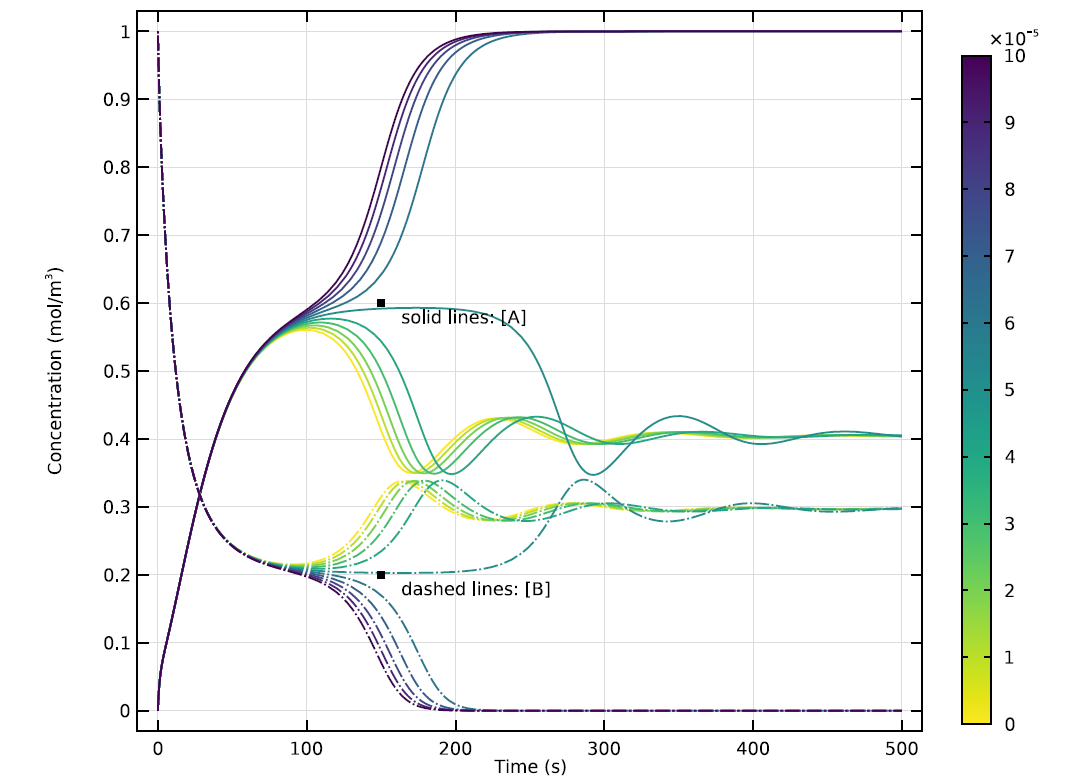
At this rate of inflow, the distribution of the two substances evolves rapidly, until the rate of change levels off. As the value of k shifts along a parameter sweep, the reaction’s behavior will also change in interesting ways. The graph below shows these progressions for 10 different values of k.

Time evolution of concentrations of A and B in a 0D version of the model, showing results for 10 different values of k. Note the apparent oscillation of the reaction’s waveform at some values of k.
At certain values of k, the concentrations of A and B will quickly achieve a stable equilibrium. At other values, there will be transitional oscillations as the reaction proceeds toward a condition where A and B can coexist. This relatively stable state may be far from uniform, however…
Animation of the changing quantities and distribution of substances A and B, as sustained by an inflow of reagent at a rate of 0.0611/s.

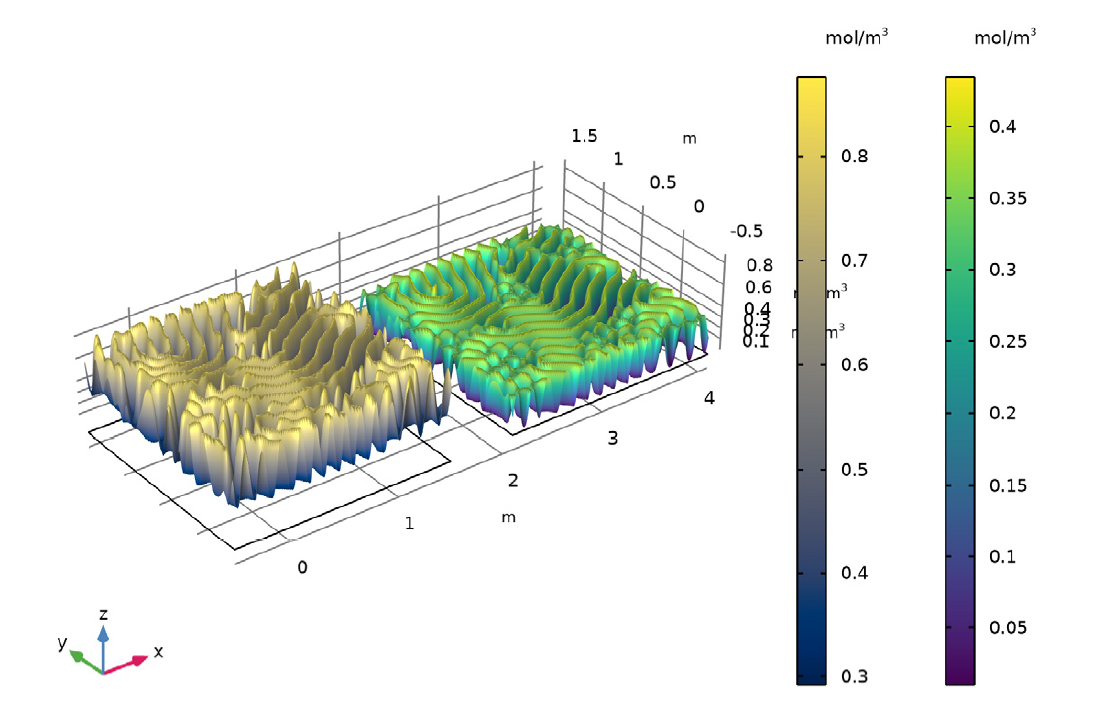
Illustration showing final state of concentration of A and B for k = 0.06011.
As seen in the animation and images above, the reaction-diffusion process can generate spectacular Turing patterns under the right conditions.
Tuning Your Own Turing Patterns
Ready to explore the morphogenetic processes that help bring order to the universe? Or, would you just like to create some cool animations? Either way, you can get started by downloading the Cubic Autocatalysis: Exploring the Gray-Scott Model tutorial model via the button below, including instructions on how to run the animation player in the COMSOL Multiphysics software.
References
- A.M. Turing, “The Chemical Basis of Morphogenesis,” Phil. Trans. R. Soc. Lond. B, vol. 237, pp. 37–72, 1952.
- P. Gray and S.K. Scott, “Autocatalytic Reactions in the Isothermal Continuous Stirred Tank Reactor, Oscillations and instabilities in the system A + 2B=>3B; B=>C,” Chemical Engineering Science, vol. 39, pp. 1087–1097, 1984.


Comments (0)