
When modeling acoustic devices, it’s often enough to account for linear propagation alone, even though nonlinearities are always present. However, when the signaling amplitude reaches high levels in a design, nonlinear effects become important. Engineers can include nonlinear effects in simulations by taking advantage of the Nonlinear Acoustics (Westervelt) feature in the COMSOL Multiphysics® software, as demonstrated by an exponential horn example.
Using an Acoustic Horn to Increase Sound Amplitude
One of the oldest ways of amplifying sound is by using an acoustic horn. A classic example is the mechanical phonograph. Invented by Thomas Edison in the 1870s, the phonograph is a system made of a foil-wrapped wooden cylinder (later made of wax); a needle; and a horn placed against the foil, or metal diaphragm.
With a phonograph, you can make a recording simply by speaking into the horn, with the vibration causing the needle to etch grooves into the foil. You can also listen to a recording by placing the needle at the beginning of the groove and turning the handle of the machine. As the needle moves along the groove pattern, the vibrations it makes are amplified by the horn. These capabilities inspired acoustic engineers to improve upon the design and soon, the cylinders were replaced with flat record discs, and more advanced horns were used to improve the sound amplification.
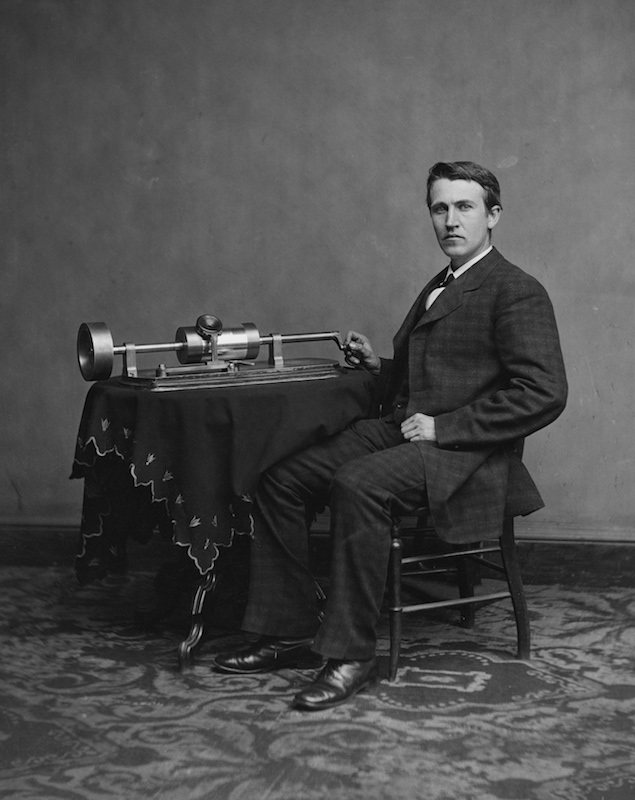
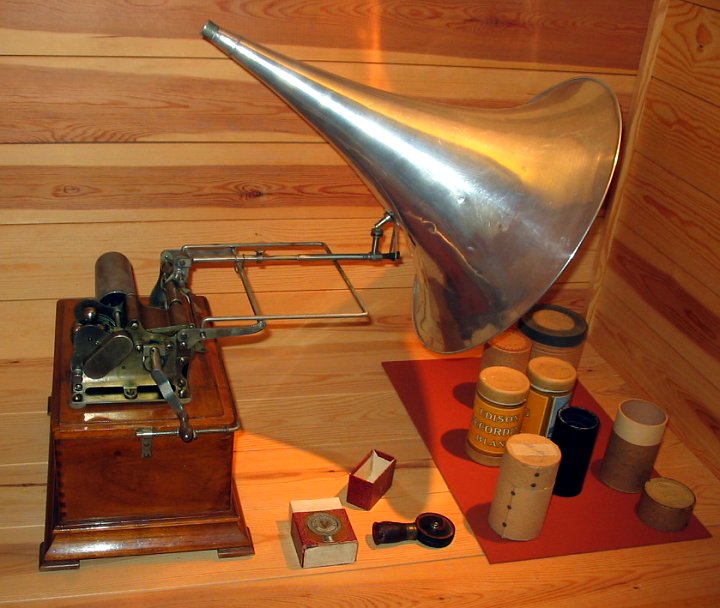
Left: Thomas Edison and an early phonograph. Image in the public domain in the United States, via Wikimedia Commons. Right: A phonograph with a classic horn shape next to cylinders. Image by Tomasz Sienicki — Own work. Licensed under CC BY-SA 3.0, via Wikimedia Commons.
Nowadays, the acoustic horn is a common element used in electrodynamic loudspeakers or for signaling on ships and trains. At first, horn speakers could not amplify sound very far. After electricity entered the picture, though, horn speakers could transfer low levels of electric power into high levels of sound capable of filling large venues. Instead of a mechanically driven diaphragm, an electrically driven loudspeaker uses an electromagnetic moving coil and diaphragm to produce sound that is amplified through a horn. These high-efficiency speakers are often used in public address systems at outdoor parks or sports stadiums as well as in loud alarm systems. For high-amplitude signaling, the electromagnetic motor is often replaced with a compressed air driver.
The reason the horn is so effective is because its shape allows for a controlled cross-section increase. This results in a so-called impedance match between the sound source (a loudspeaker) and the surrounding air. The idea is that an acoustic horn can radiate sound efficiently in a large frequency range. Efficient radiation is obtained when the pressure is in phase with the particle velocity, which requires a large surface at lower frequencies. The acoustic horn permits this; the sound is generated by a small source (at the throat of the horn) but radiated by a large surface (the mouth of the horn). The impedance matching properties of the horn ensure that the radiated wave front is altered as little as possible (from throat to mouth), keeping the pressure and particle velocity in phase. The simplest one-dimensional description of horn acoustics is given by the Webster horn equation. One common type of horn driver is the exponential horn, which has good impedance-matching capabilities.
When the acoustic horns are driven at very high amplitudes — as is often the case for signaling (for ships or trains) or in sound systems used for concert venues — the nonlinear behavior of the acoustics needs to be taken into account. Because of the geometry of the horn, the high sound pressure levels (SPLs) are typically located in the throat of the horn. While nonlinear propagation is present at lower amplitudes, it doesn’t show its effects until high sound amplitudes are reached. Thus, it’s important to account for nonlinear effects in simulations when using an acoustic horn for high-amplitude signaling.
As a good rule of thumb for the applicability of linear acoustics, it is valid as long as the acoustic pressure p is much smaller than \rho c^2 (that is, |p| \ll \rho c^2), where \rho is the fluid density (1.2 kg/m3 for air) and c is the speed of sound (343 m/s for air). This gives a value of \rho c^2 = 1.4 \cdot 10^5 Pa for air. Assuming that “much smaller than” corresponds to a factor of 100, linear acoustics applies up to roughly an SPL of 154 dB.
Modeling High-Amplitude Acoustics with the Westervelt Model
You can model the propagation of nonlinear acoustic waves generated by a horn using the Acoustics Module, an add-on to COMSOL Multiphysics. Simulation allows you to see how the input waveform at the horn’s throat affects the waveform as output at the mouth. In this exponential horn example, the model is set up so that a harmonic input at the throat driven at the frequency f0 = 130 Hz. This generates an acoustic wave with the frequency spectrum containing the harmonics 2f0, 3f0, 4f0, etc. The model mesh resolves up to the fourth harmonic 4f0. Nonlinear acoustic simulations require a full nonlinear transient analysis of the system, as frequency-domain models only apply in the linear case.
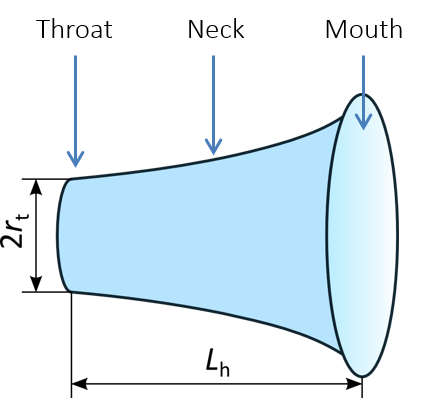
A schematic of the acoustic horn model.
The Pressure Acoustics, Transient interface is used in this example for the transient computation of the acoustic pressure, while the dissipative (thermally conducting and viscous) material model and the Nonlinear Acoustics (Westervelt) domain condition (the latter of which is available as of version 5.4 of the COMSOL® software) simulate the nonlinear propagation of acoustics in the physical domain. As shown below for the 2D axisymmetric model, the model includes the Exterior Field Calculation boundary condition (also available as of version 5.4), which comes into play when computing and visualizing the radiation pattern (more on that later), as well as perfectly matched layers (PMLs), which are used together with the lossless Transient Pressure Acoustics Model node to simulate the open nonreflecting condition toward infinity.
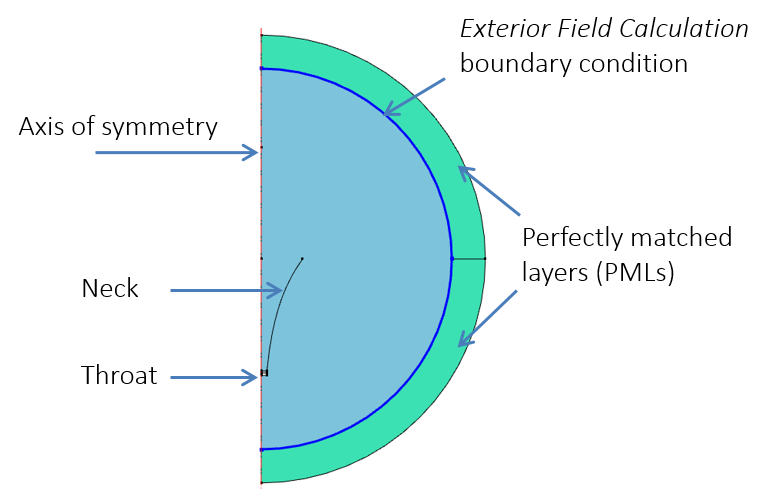
2D axisymmetric model setup.
The nonlinear transient study has two steps:
- Time-dependent analysis
- Time-to-frequency fast Fourier transform (FFT)
For the first step, the Nonlinear Acoustics (Westervelt) feature automatically tunes the time-dependent solver. This convenient functionality helps make the underlying nonlinear problem more effective. Once the solution reaches a steady state, a time-to-frequency FFT is performed, and the result is stored on the exterior field calculation boundary, where it is used to calculate the exterior field.
Evaluating the Simulation Results
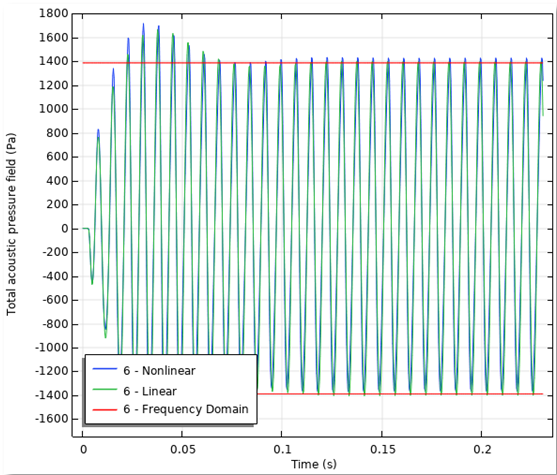
First up in the results, you can take a look at the acoustic pressure. The plot to the left below compares the linear (green) and the nonlinear (blue) behaviors in a point just in front of the horn. The red lines correspond to the amplitude computed from the frequency-domain model. From this graph, you can visualize the total nonlinear acoustic pressure at high amplitudes.
On the left, there’s a comparison of the linear and nonlinear approaches for computing the acoustic pressure. The animation on the right visualizes the total nonlinear acoustic pressure profile.
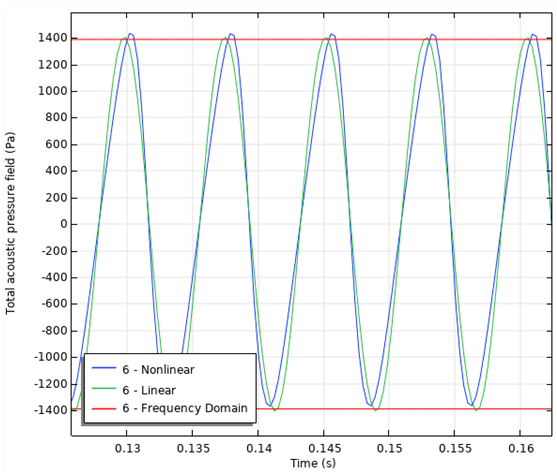
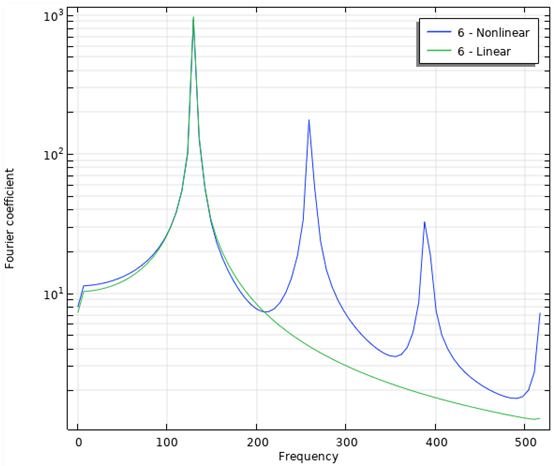
Next, you can analyze the frequency content of the signals. The image on the left shows the transient computation of the acoustic pressure, zoomed in on 5 periods. The image on the right displays the frequency spectrum for both the linear and nonlinear analyses. From the graph, it is evident that the nonlinear model contains higher harmonic components. Due to the nonlinear behavior, energy is pumped from the fundamental frequency to the higher harmonics.
Acoustic pressure as function of time (left) and frequency spectrum with the nonlinear harmonic components clearly visible (right).
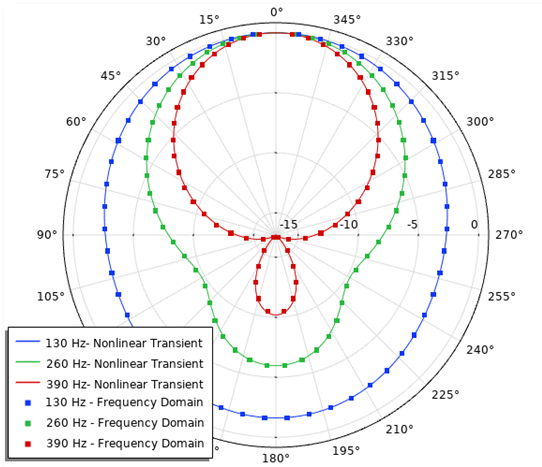
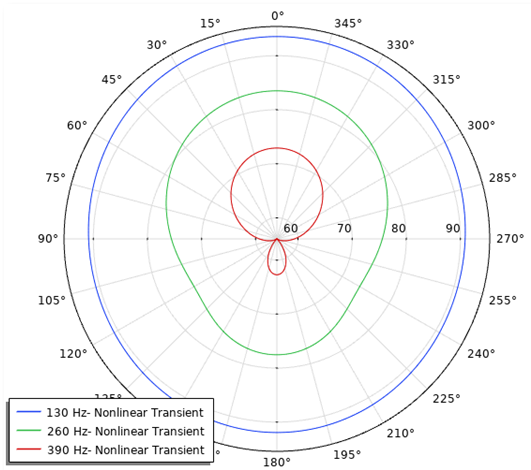
Next, you can examine the exterior field. The exterior field calculation feature makes it possible to visualize the radiation pattern of the acoustic field at any given distance from the source, enabling you to study the exterior field SPL. Below on the left is the normalized exterior field SPL, showing the nonlinear analysis versus the single frequency domain. In the image on the right, you can see the nonlinear transient analysis, showing the exterior field SPL at the first three harmonic frequency components. The latter graph also shows the relative amplitude of the various components.
On the left is the normalized exterior field SPL for a nonlinear analysis versus a single frequency domain. On the right is the nonlinear transient analysis for the exterior field SPL of the first three frequency components.
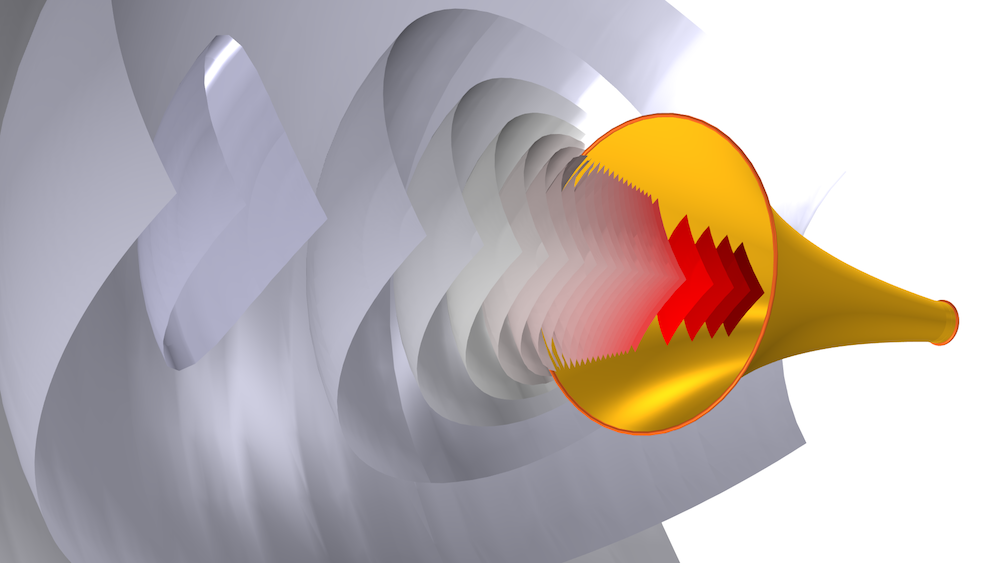
Nonlinear effects in the exponential horn model.
As shown from this example, the Nonlinear Acoustics (Westervelt) feature and the Exterior Field Calculation boundary condition help account for and visualize nonlinear propagation and effects in acoustics simulations, thereby enabling engineers to improve upon acoustics designs requiring higher-amplitude signaling.
Next Steps
Try modeling an acoustic horn yourself: Click the button below, which will take you to the Application Gallery. From there, you can download a step-by-step guide and the MPH file.
Further Resources
- Read about nonlinear acoustics simulations in the following blog posts:
- Ready for more nonlinear acoustics modeling? Try out this tutorial:




Comments (0)