Application Builder Updates
Chatbot
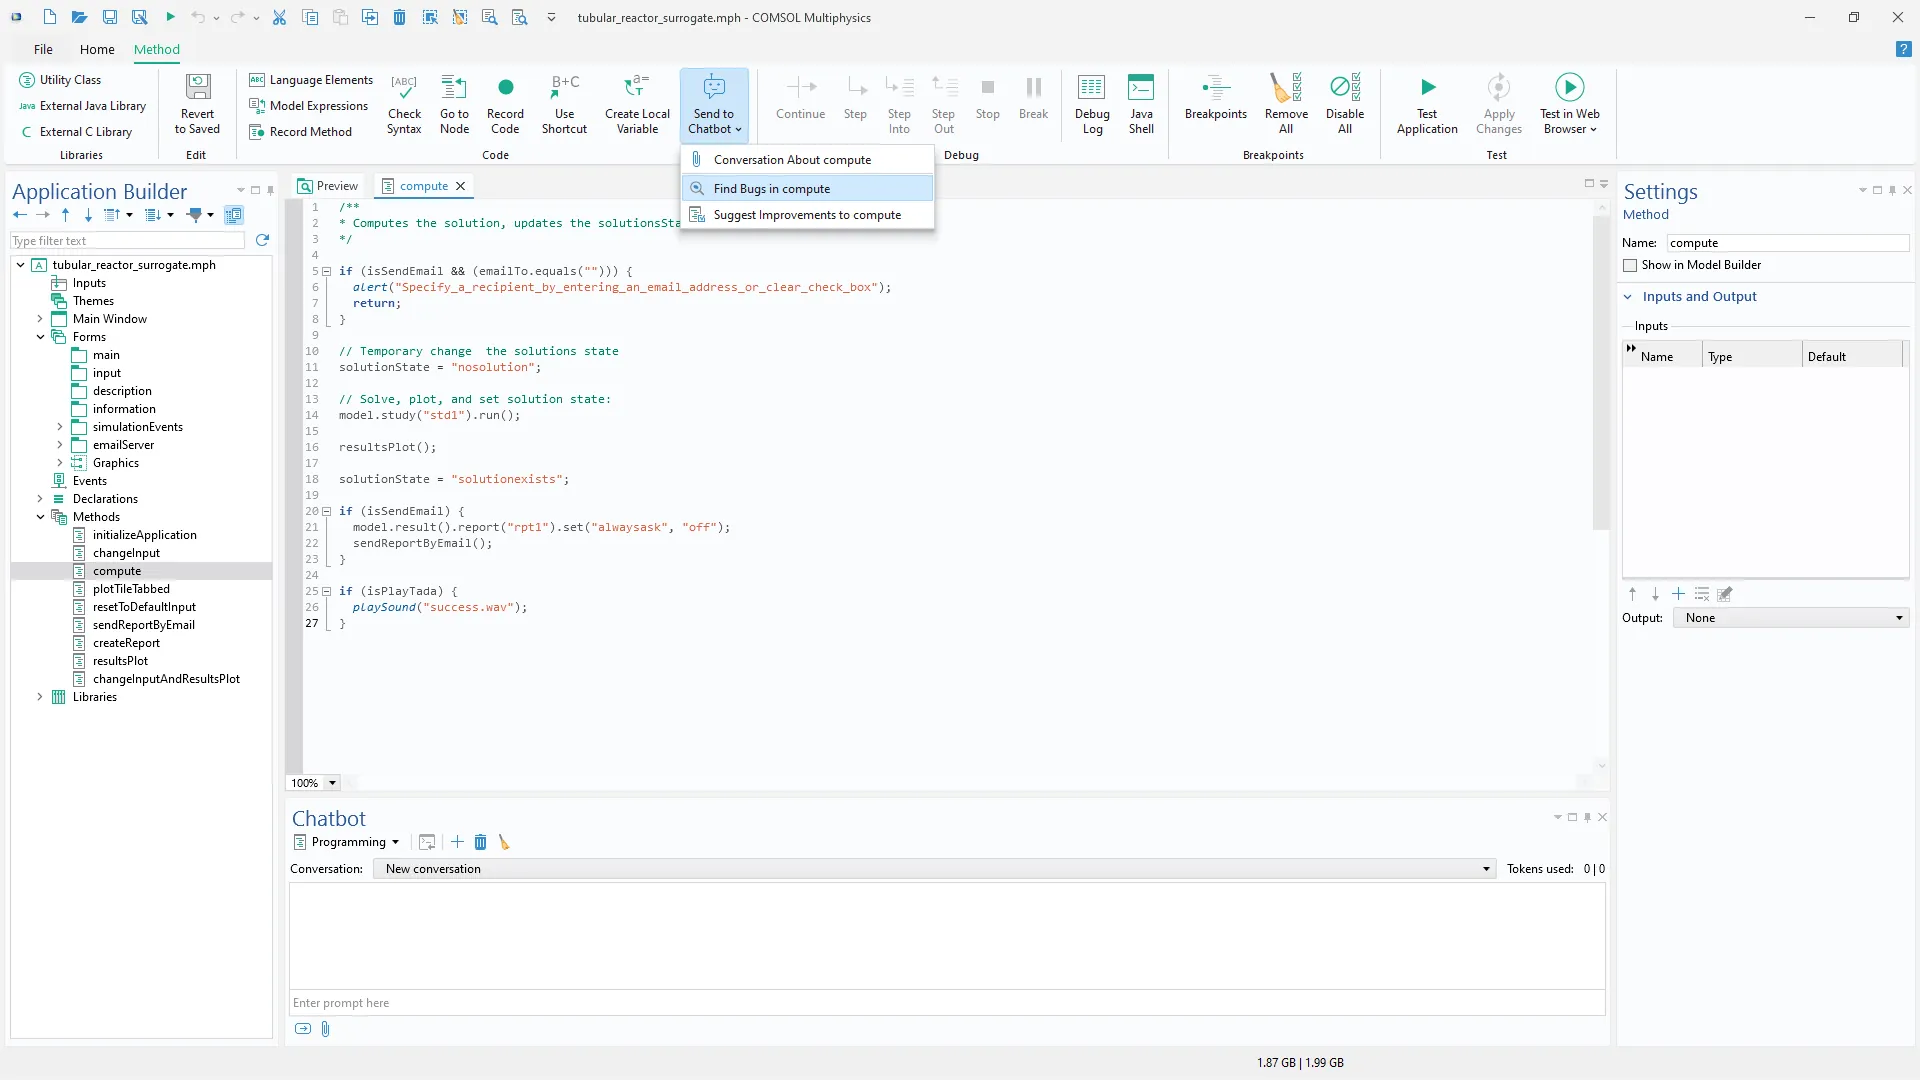
A new Chatbot window is available, which makes it possible to communicate with OpenAI's GPT models to generate and debug COMSOL API for use with Java code and to prompt modeling questions related to the COMSOL Multiphysics® software. The chatbot functionality has been primed for use with COMSOL Multiphysics® and enables seamless interaction without having to copy-paste messages to and from external AI tools. Instead, methods can easily be attached to be checked for bugs or to run API code suggested by the AI model, with the results immediately visible in the Model Builder and the Graphics window.
The Chatbot window is available in the Windows® version of the software. In order to use it, an OpenAI account and an OpenAI API key are required. Note that obtaining an API key typically requires signing up for an API key payment plan.
Java Shell
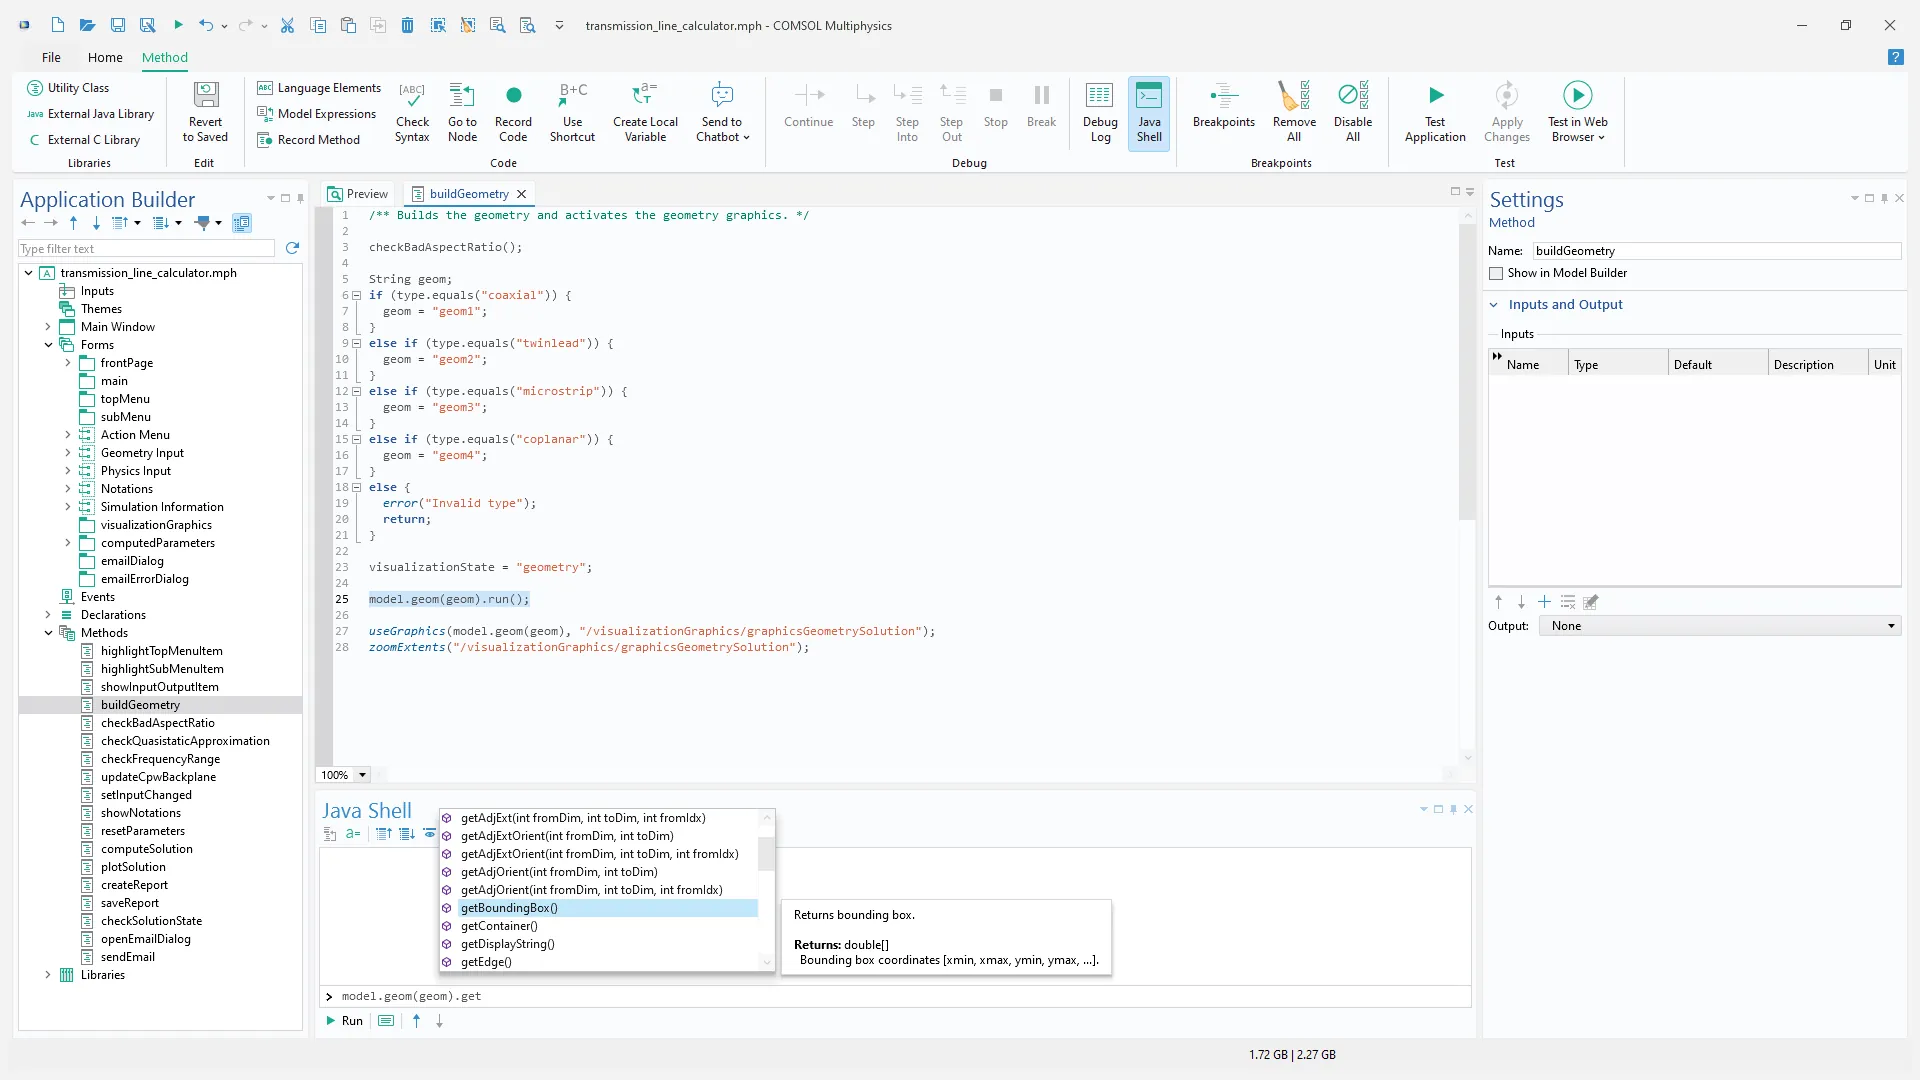
The Java Shell window is an interactive environment that provides a command prompt for running Java code, supporting all of the features of the Method Editor, such as code completion, syntax highlighting, and more. This new functionality can be used to quickly modify a model through the COMSOL API for use with Java, without needing to create a model method first. It can be used, for example, to prototype code for methods, bulk create features, inspect properties, or change declaration variables. It is also useful for debugging methods in the Application Builder, making it possible to perform code evaluations while stopped at a breakpoint.
The Java Shell window is available in the Windows® version of the software and can be accessed from the Model Builder, Application Builder, and Model Manager workspaces, where, for instance, it enables interaction with databases using the API.
Data Viewer
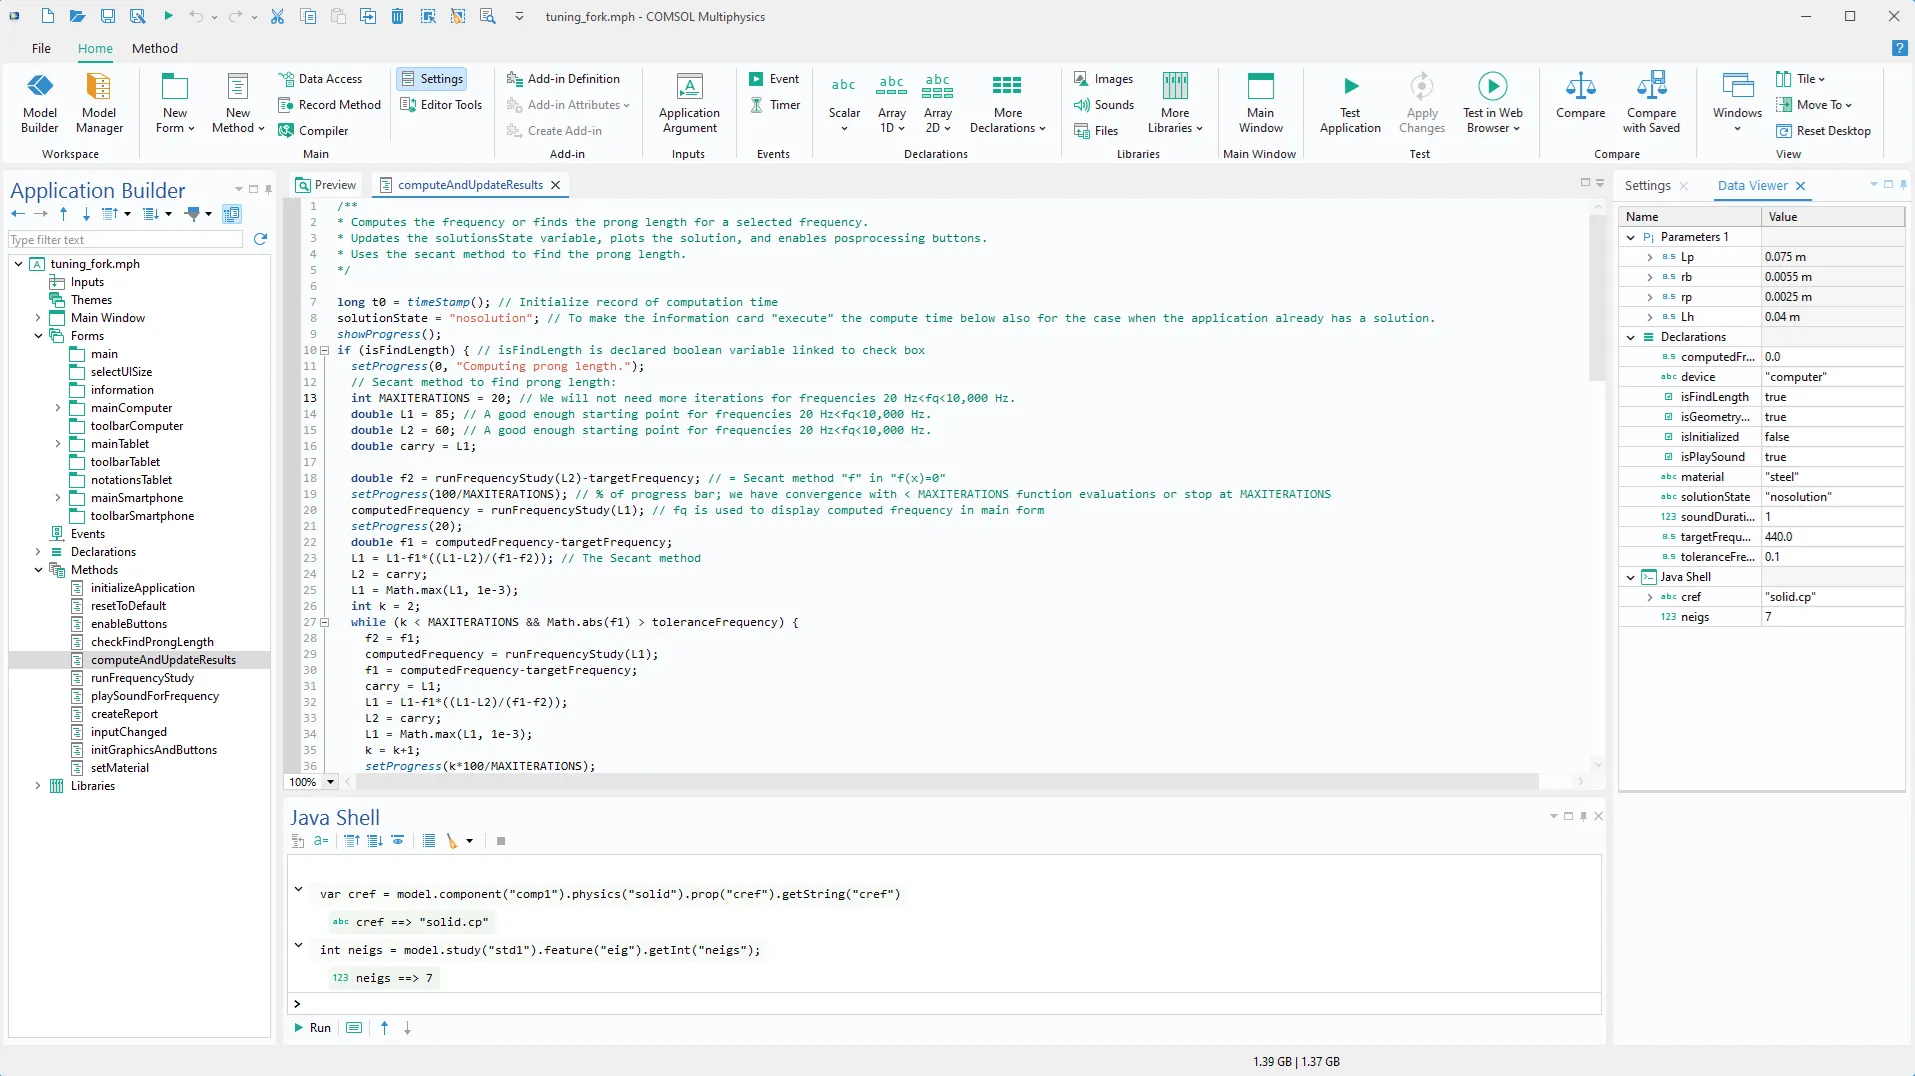
The Variables window that was previously used while debugging in the Application Builder displayed and allowed the modification of parameters, declarations, and Java variables when stopped at a breakpoint. In version 6.3, the window has been renamed Data Viewer and is now always accessible (including when in the Model Builder workspace), which enables quick viewing and updating of parameters and declarations no matter where you are in the software. The window also shows Java variables from the new Java Shell window.
Form Toolbars
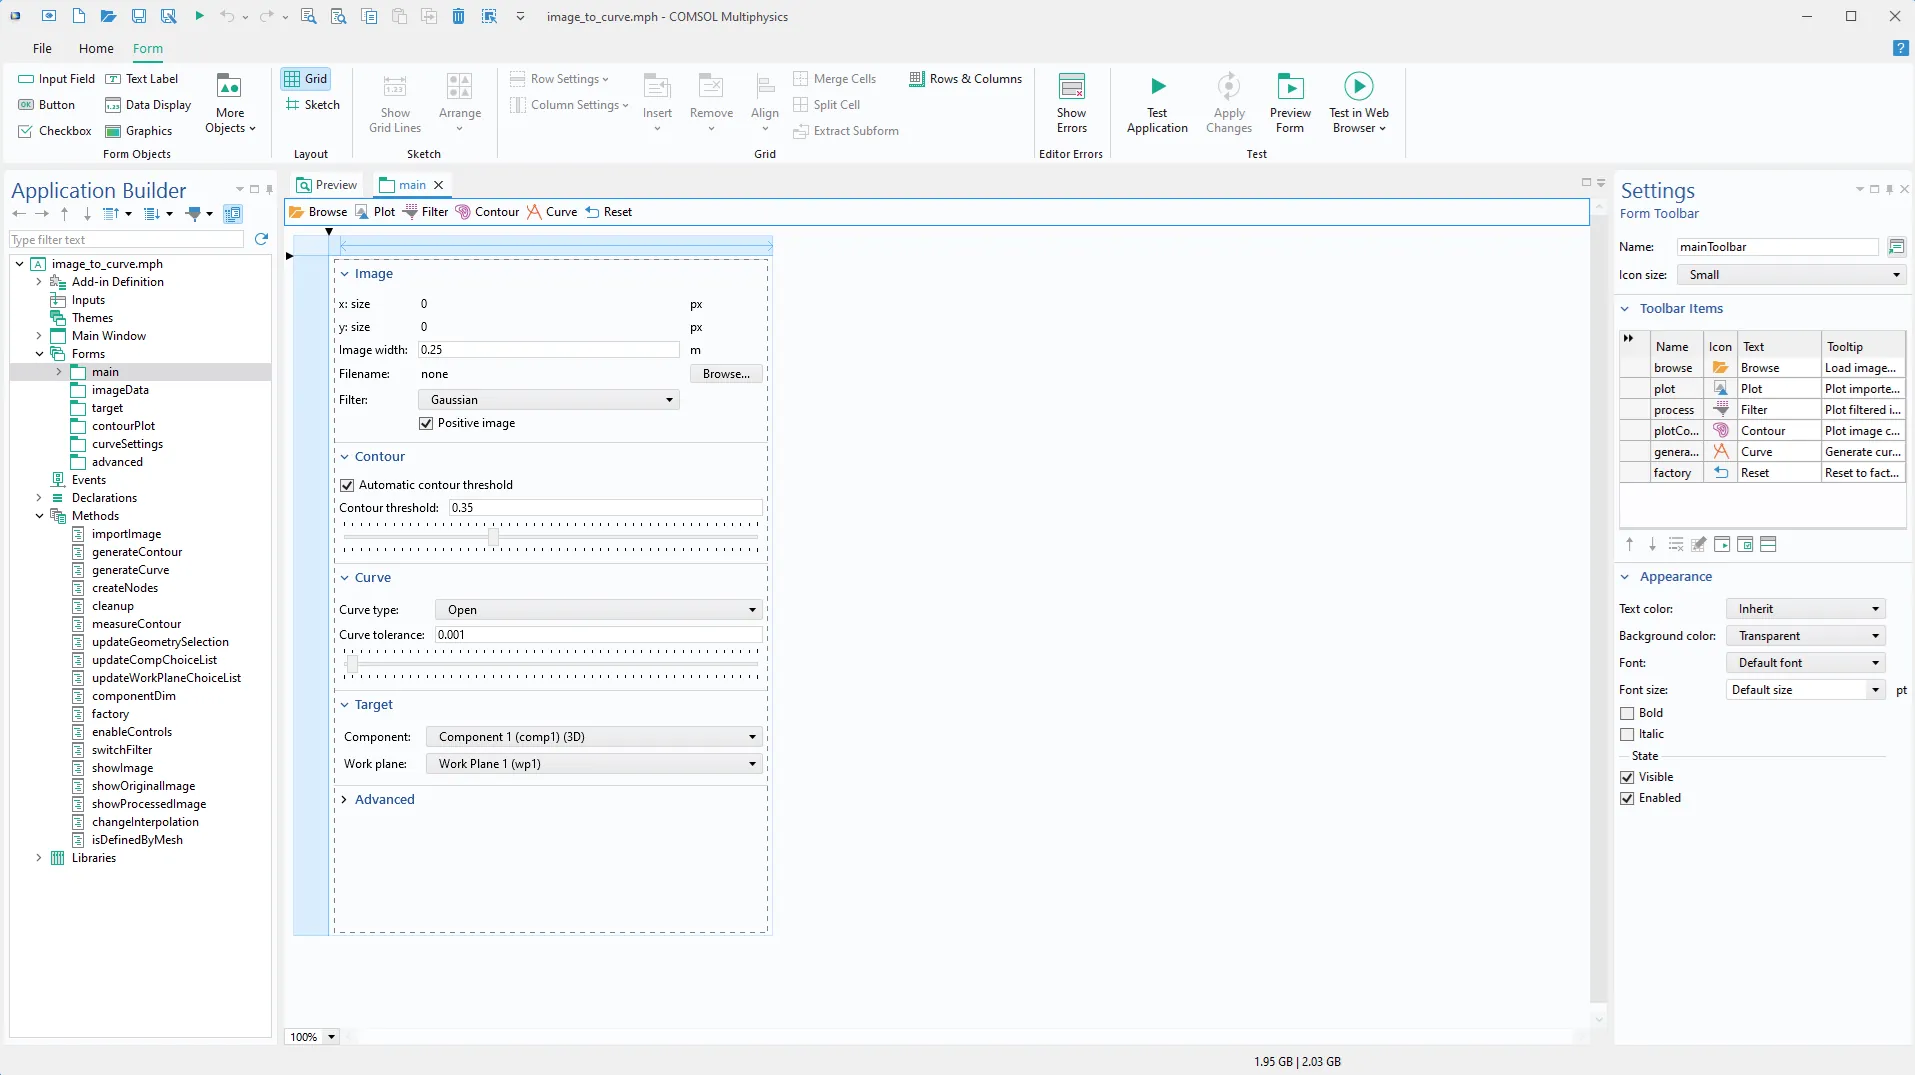
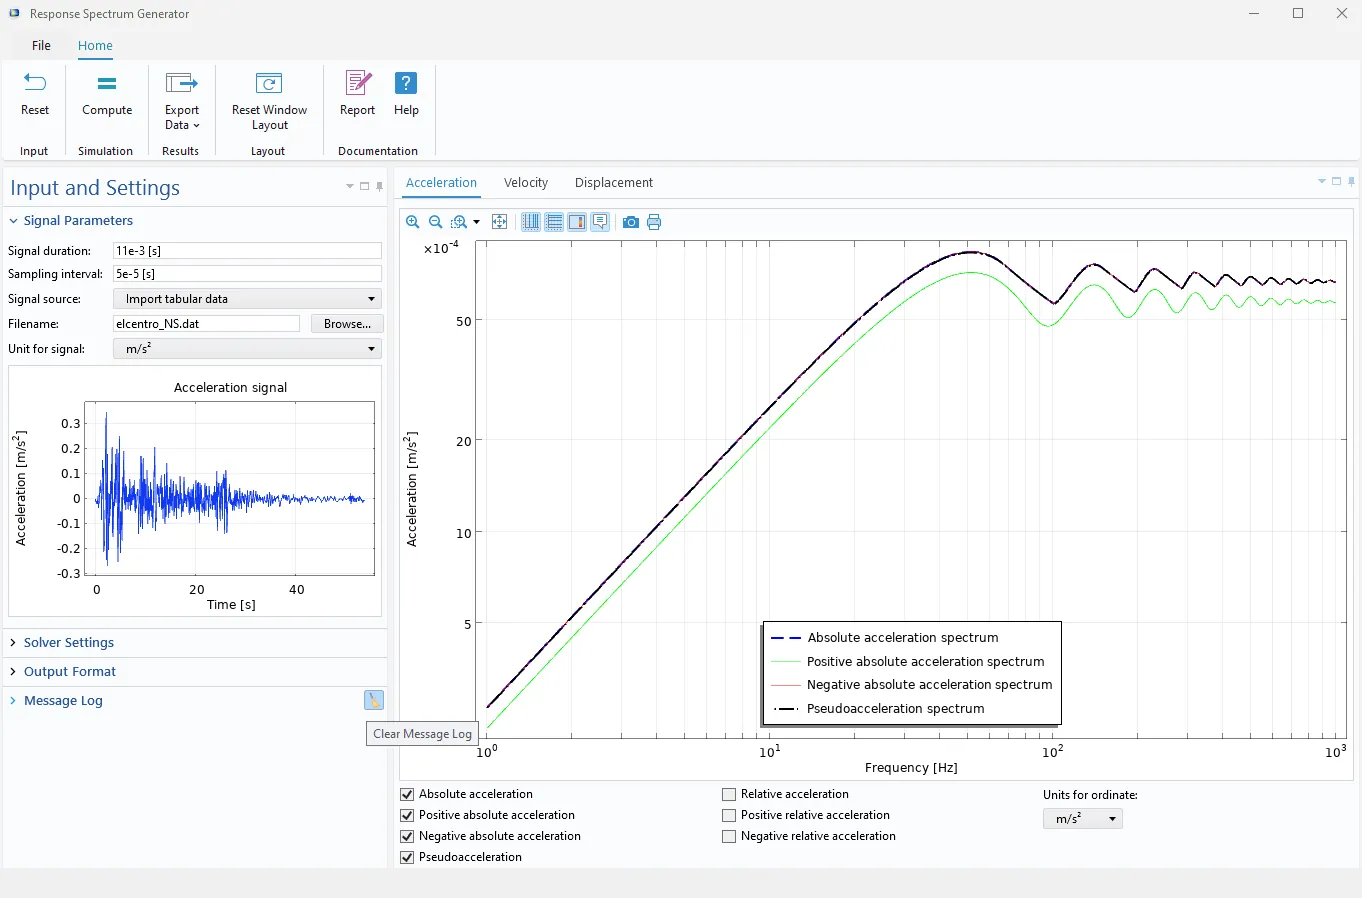
A Form Toolbar is a new form object that can be added to a form's header area. The display of the toolbar depends on the form's context. For instance, if the form is used in a subwindow or as a settings form, the toolbar will be fixed at the top of the form, even when the content below scrolls out of view. This ensures that the toolbar is always easily accessible. If the form is used in a section within a form collection, the toolbar appears in the section header, offering a convenient location for section-specific commands.
This new feature can be seen in the Circuit Extractor, Image to Curve, Mesh Partition with Ball, and Planar Cut add-ins.
Method Editor
- The Method Editor now supports Java 11, including code completion.
- Several file-reading utilities have been updated to include support for specifying a delimiter. This includes
readCSVFile,readMatrixFromFile, andreadStringMatrixFromFile. - It is now possible to save a copy of a running app using the new
saveApplicationCopyAsmethod. This option is also available as a command in GUI Commands > File Commands.
General Updates
The new and improved user interface design applies automatically to any simulation apps running on Windows®. For more information, see the COMSOL Desktop® release highlights page.
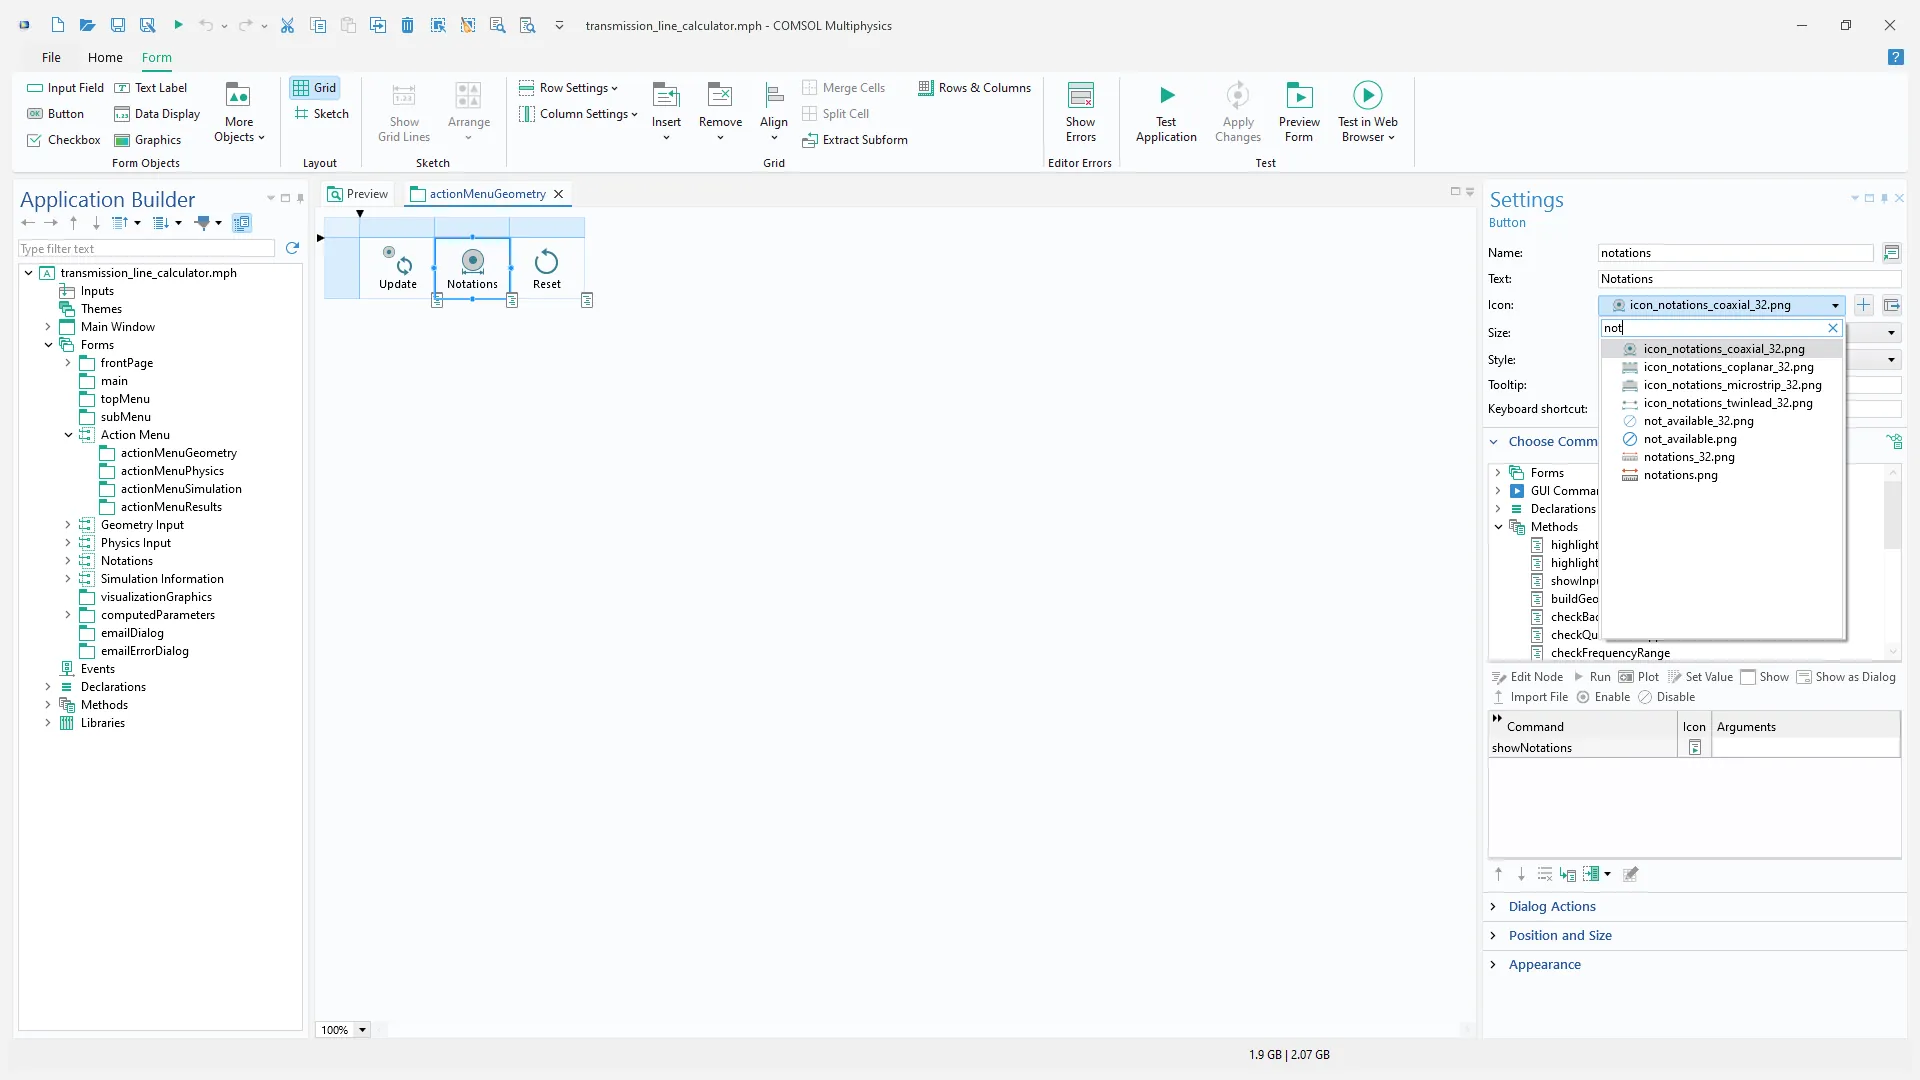
When choosing icons in the Application Builder, it is now possible to filter the list of images, making it easier to locate the desired icon.
New Tutorial Applications and Add-In
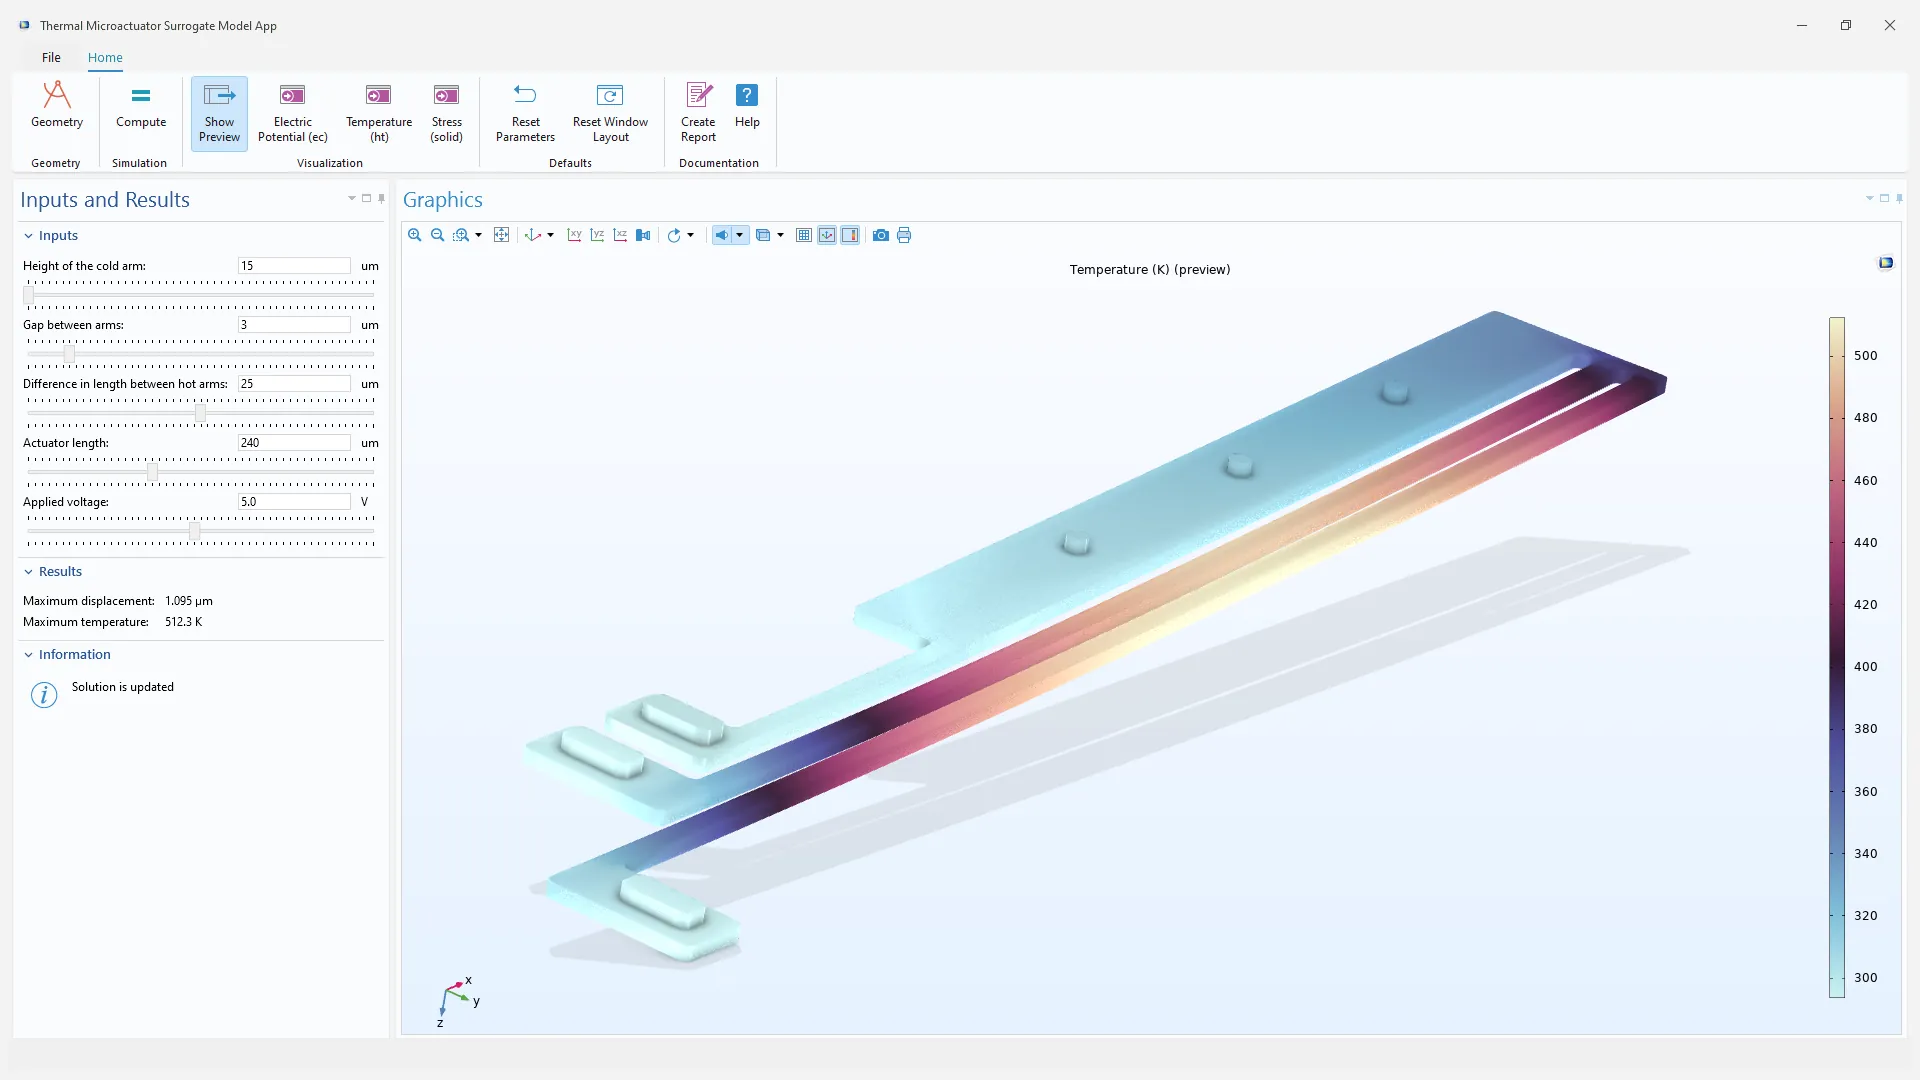
COMSOL Multiphysics® version 6.3 introduces a new add-in and several new example applications.
Surrogate Model Training of a Battery Test Cycle
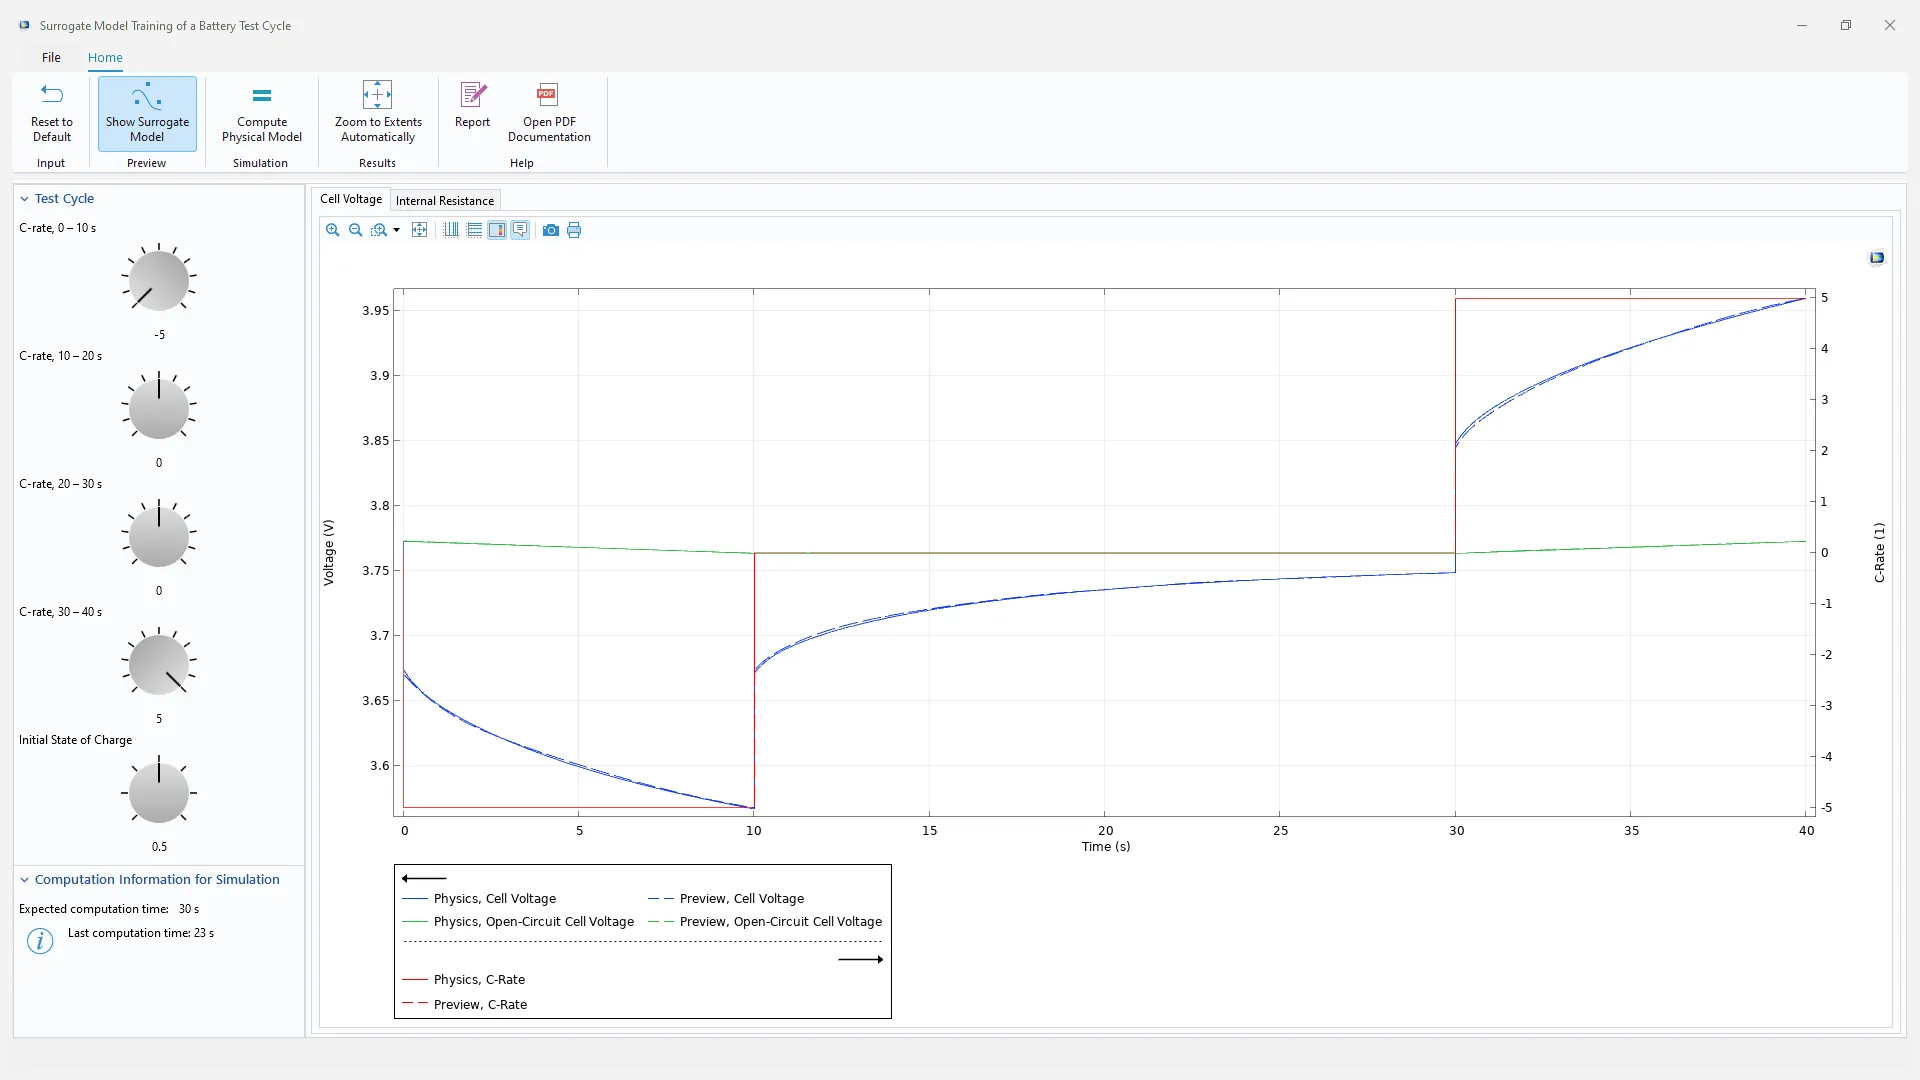
Application Library Title:
lib_test_cycle_surrogate
Download from the Application Gallery
Response Spectrum Generator
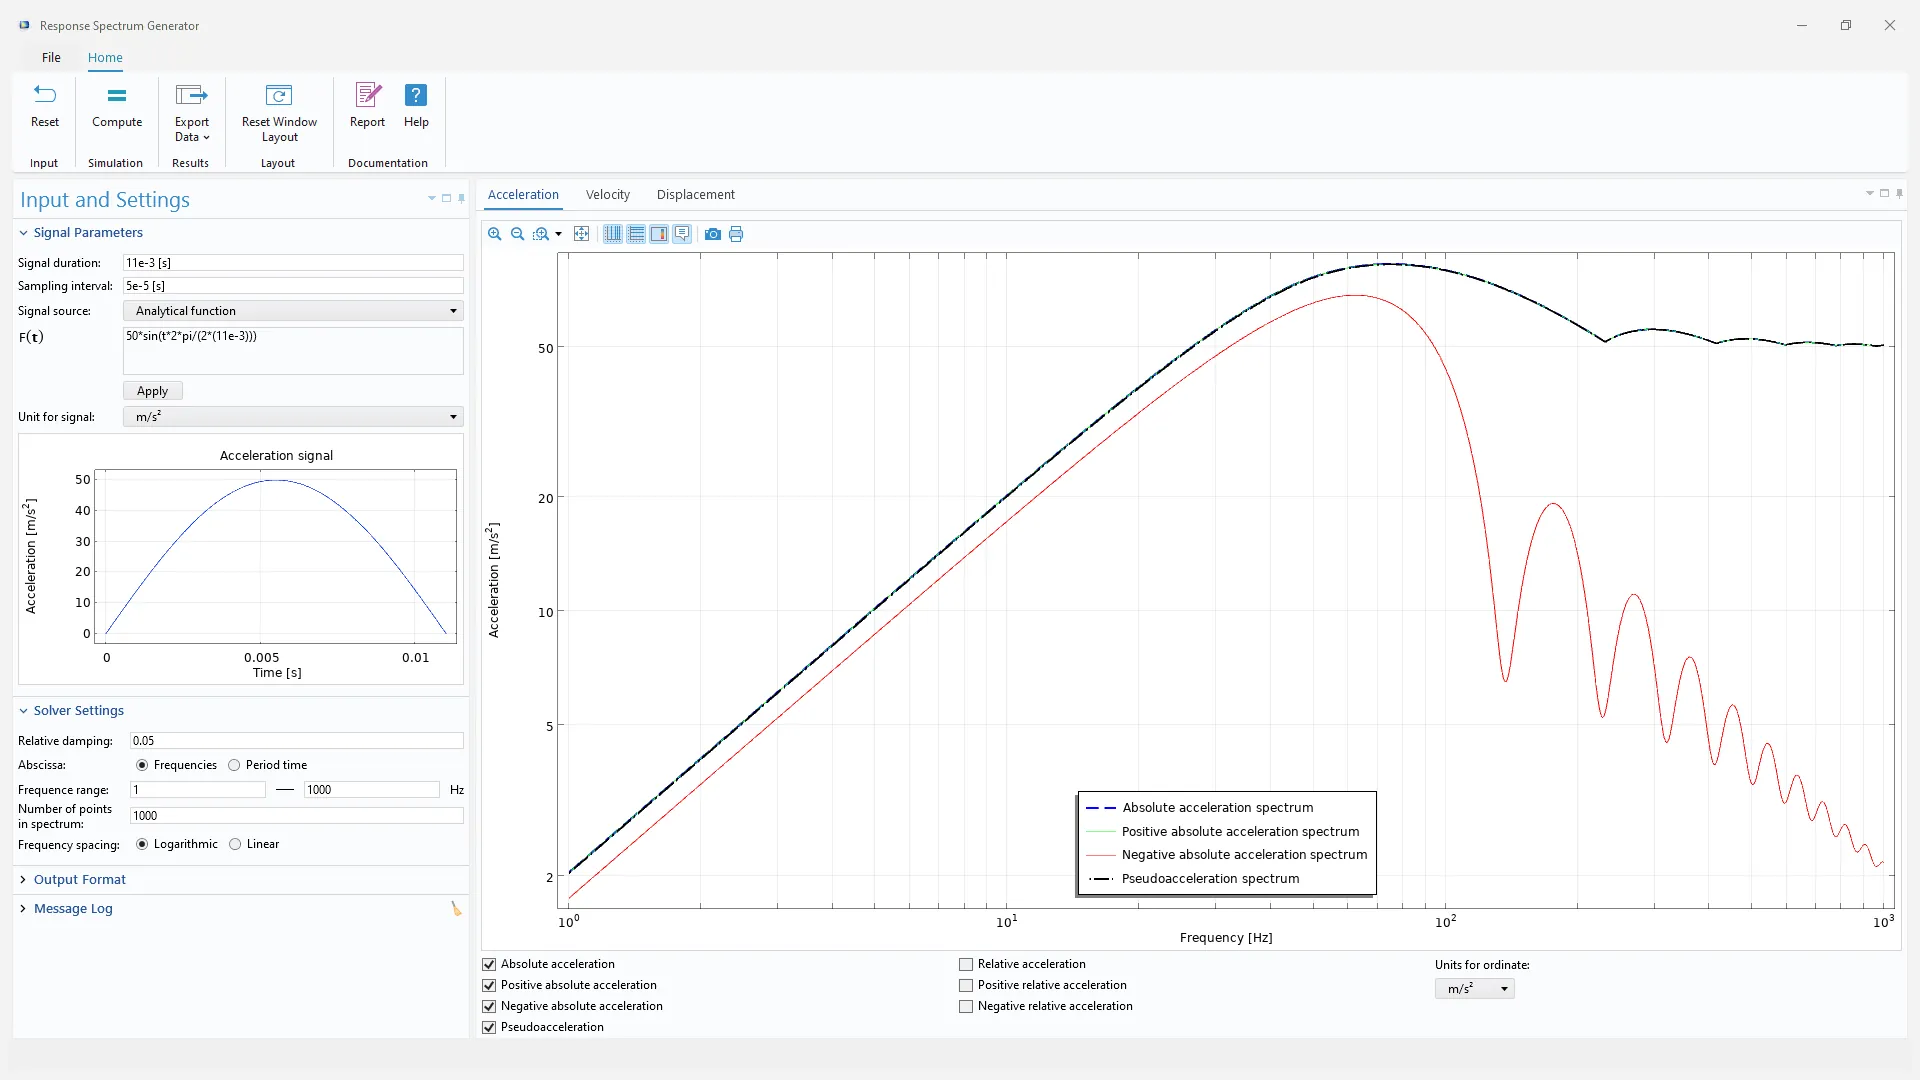
Application Library Title:
response_spectrum_generator
Download from the Application Gallery
Digital Twin Analyzer of an Electric Scooter Battery
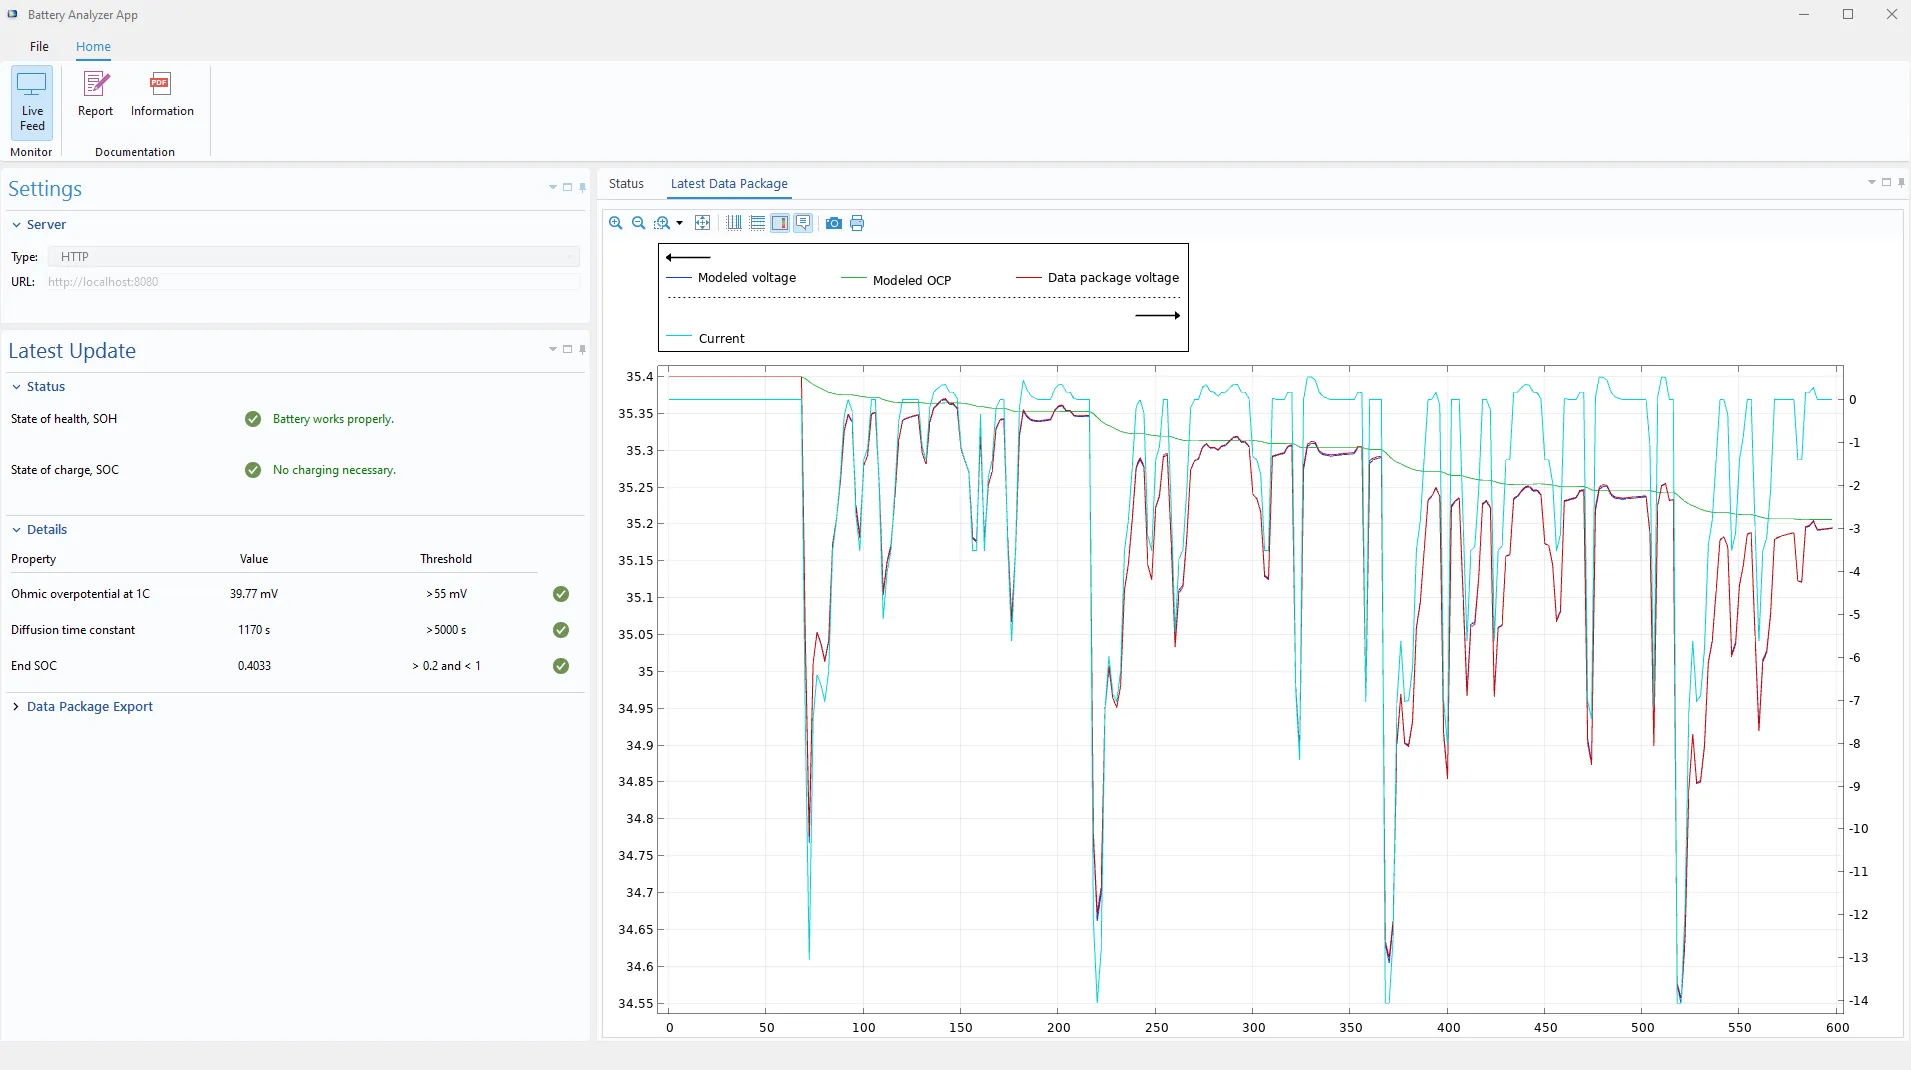
Application Library Titles:
lib_digital_twin_analyzer
lib_digital_twin_simulator
Download from the Application Gallery
Homogenized Porous Material Properties
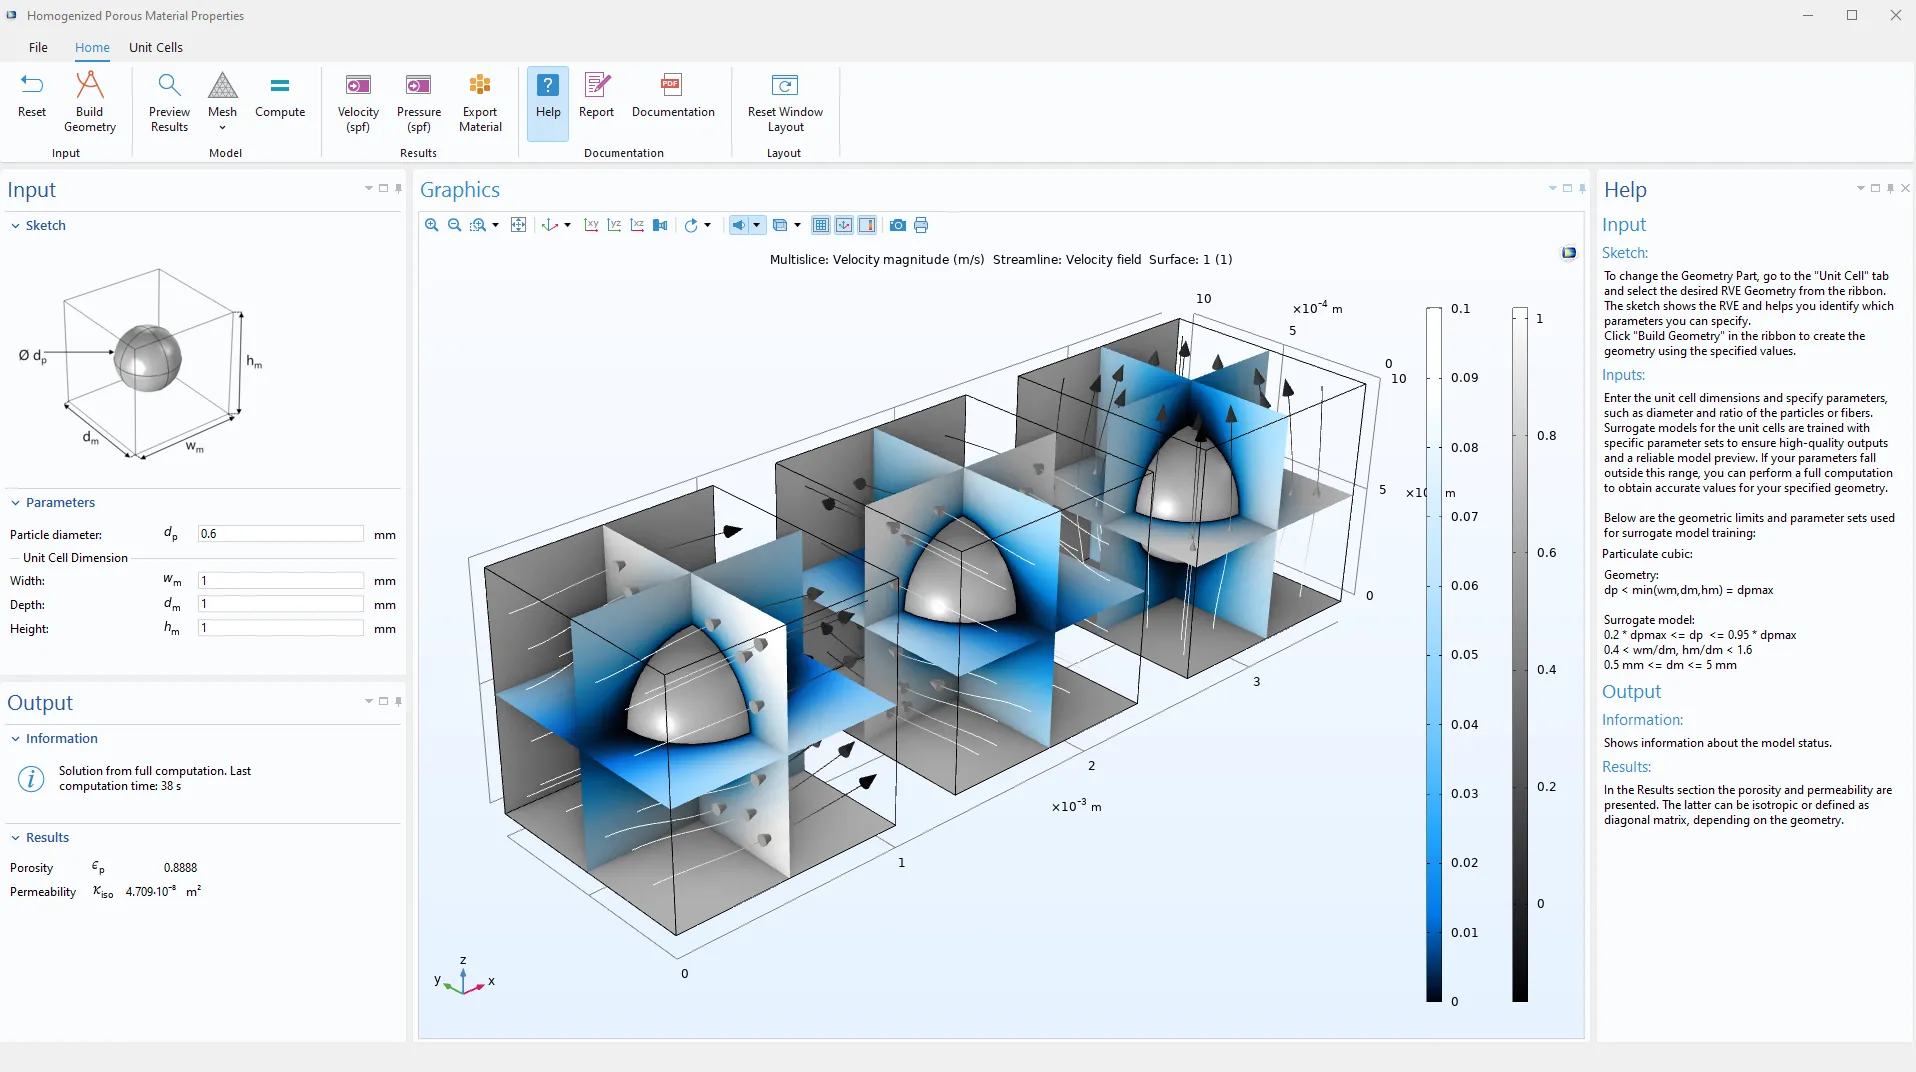
Application Library Title:
homogenized_porous_material_properties
Download from the Application Gallery
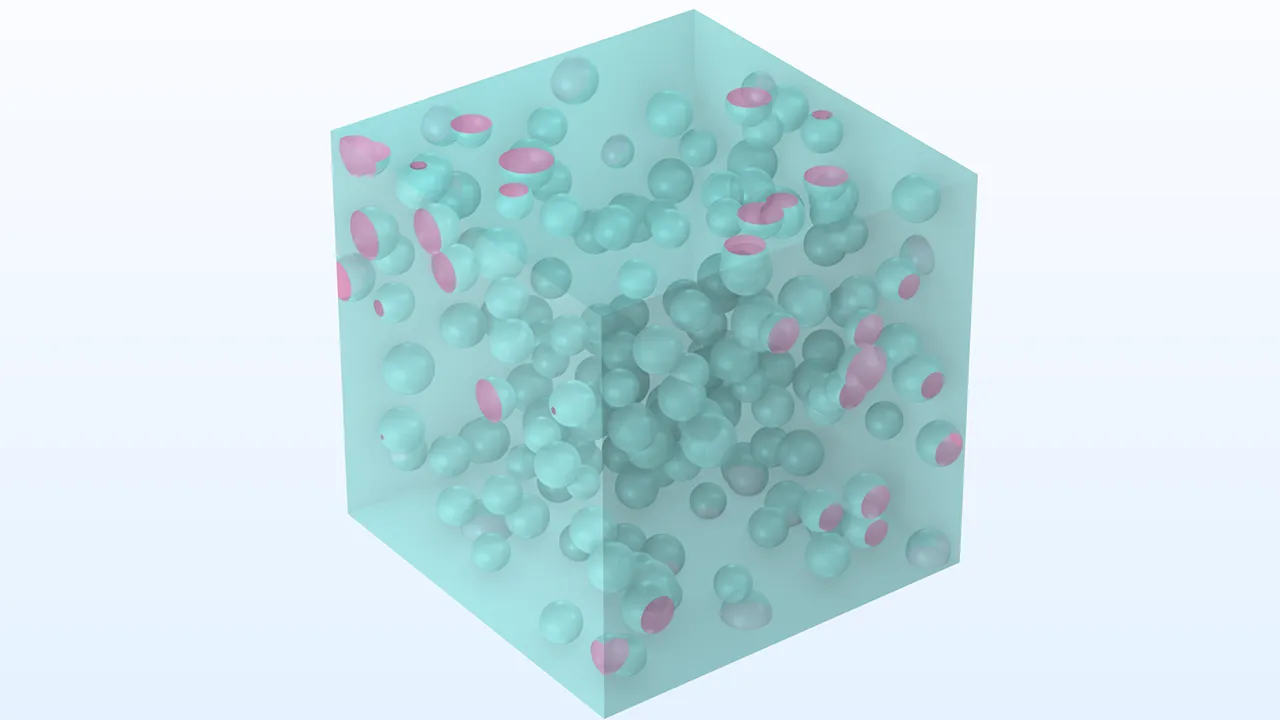
Random Particulate Composite RVE Add-In
Oracle and Java are registered trademarks of Oracle and/or its affiliates. Microsoft and Windows are trademarks of the Microsoft group of companies.

